Estrategia ATR multiespecie de futuros de divisas digitales (tutorial)
El autor:FMZ~Lydia, Creado: 2022-11-08 10:34:22, Actualizado: 2023-09-15 20:55:33
Recientemente, algunos de nuestros usuarios de la plataforma están deseando trasplantar una estrategia MyLanguage en una estrategia JavaScript, que puede agregar de manera flexible muchas ideas de optimización. Incluso ampliar la estrategia a versiones de múltiples especies. Debido a que la estrategia MyLanguage es generalmente una estrategia de tendencia, y muchas de ellas se ejecutan basadas en el modelo de precio de cierre. La interfaz API del intercambio de solicitudes de estrategia no es muy frecuente, lo que es adecuado para trasplantar a una versión de estrategia de múltiples especies. En este artículo, tomaremos una estrategia MyLanguage simple como ejemplo para trasplantarla en una versión simple del lenguaje JavaScript. El propósito principal es la enseñanza y la investigación de respaldo.
La estrategia de MyLanguage para trasplantarse
TR:=MAX(MAX((H-L),ABS(REF(C,1)-H)),ABS(REF(C,1)-L));
ATR:=EMA(TR,LENGTH2);

MIDLINE^^EMA((H + L + C)/3,LENGTH1);
UPBAND^^MIDLINE + N*ATR;
DOWNBAND^^MIDLINE - N*ATR;


BKVOL=0 AND C>=UPBAND AND REF(C,1)<REF(UPBAND,1),BPK;
SKVOL=0 AND C<=DOWNBAND AND REF(C,1)>REF(DOWNBAND,1),SPK;

BKVOL>0 AND C<=MIDLINE,SP(BKVOL);
SKVOL>0 AND C>=MIDLINE,BP(SKVOL);
// stop loss
// stop loss
C>=SKPRICE*(1+SLOSS*0.01),BP;
C<=BKPRICE*(1-SLOSS*0.01),SP;
AUTOFILTER;
La lógica de negociación de esta estrategia es simple. Primero, calcule ATR de acuerdo con los parámetros, luego calcule el promedio de los precios más altos, más bajos y de cierre de todos los BAR de la línea K, y luego calcule el indicador EMA de acuerdo con los datos promedio. Finalmente, combine ATR y el coeficiente N en los parámetros para calcular la upBand y downBand.
Las posiciones de apertura y venta se basan en el precio de cierre. Abre posiciones largas cuando supera la banda ascendente y vende la posición de apertura (cuando mantiene posiciones cortas). Abre posiciones cortas cuando supera la banda descendente y vende la posición de apertura. Cuando el precio de cierre alcance la línea media, la posición se cerrará, y cuando el precio de cierre alcance el precio de stop loss, la posición también se cerrará (de acuerdo con el SLOSS, el stop loss es 1, es decir, 0,01, es decir, 1%). La estrategia se ejecuta en un modelo de precio de cierre.
OK, si entendemos los requisitos estratégicos e ideas de MyLanguage, podemos comenzar a trasplantarlos.
Prototipo de estrategia de trasplante y diseño
Para facilitar el aprendizaje de las ideas de escritura de estrategias, los comentarios se escriben directamente en el código de estrategia.
// parse params parameters, and parse strings as objects
var arrParam = JSON.parse(params)

// this function creates a chart configuration
function createChartConfig(symbol, atrPeriod, emaPeriod, index) {   // symbol : trading pair, atrPeriod : ATR parameter period , emaPeriod : EMA parameter period, exchange object index corresponding to index
    var chart = {
        __isStock: true,
        extension: {
                layout: 'single',
                height: 600,
        },
        title : { text : symbol},
        xAxis: { type: 'datetime'},
        series : [
            {
                type: 'candlestick',    // K-line data series
                name: symbol,
                id: symbol + "-" + index,
                data: []
            }, {
                type: 'line',           // EMA
                name: symbol + ',EMA:' + emaPeriod,
                data: [],
            }, {
                type: 'line',           // upBand
                name: symbol + ',upBand' + atrPeriod,
                data: []
            }, {
                type: 'line',           // downBand
                name: symbol + ',downBand' + atrPeriod,
                data: []
            }, {
                type: 'flags',
                onSeries: symbol + "-" + index,
                data: [],
            }
        ]
    }
    return chart
}

// main Logic
function process(e, kIndex, c) {    // e is the exchange object, exchanges [0]..., kIndex is the K-line data series in the chart, and c is the chart object
    // obtain K-line data
    var r = e.GetRecords(e.param.period)
    if (!r || r.length < e.param.atrPeriod + 2 || r.length < e.param.emaPeriod + 2) {
        // if the K-line data length is insufficient, return
        return
    }

    // calculate ATR indicators
    var atr = TA.ATR(r, e.param.atrPeriod)
    var arrAvgPrice = []
    _.each(r, function(bar) {
        arrAvgPrice.push((bar.High + bar.Low + bar.Close) / 3)
    })
    // calculate EMA indicators
    var midLine = TA.EMA(arrAvgPrice, e.param.emaPeriod)
    // calculate upBand and downBand
    var upBand = []
    var downBand = []
    _.each(midLine, function(mid, index) {
        if (index < e.param.emaPeriod - 1 || index < e.param.atrPeriod - 1) {
            upBand.push(NaN)
            downBand.push(NaN)
            return
        }
        upBand.push(mid + e.param.trackRatio * atr[index])
        downBand.push(mid - e.param.trackRatio * atr[index])
    })

    // draw the chart
    for (var i = 0 ; i < r.length ; i++) {
        if (r[i].Time == e.state.lastBarTime) {
            // update
            c.add(kIndex, [r[i].Time, r[i].Open, r[i].High, r[i].Low, r[i].Close], -1)
            c.add(kIndex + 1, [r[i].Time, midLine[i]], -1)
            c.add(kIndex + 2, [r[i].Time, upBand[i]], -1)
            c.add(kIndex + 3, [r[i].Time, downBand[i]], -1)
        } else if (r[i].Time > e.state.lastBarTime) {
            // add
            e.state.lastBarTime = r[i].Time
            c.add(kIndex, [r[i].Time, r[i].Open, r[i].High, r[i].Low, r[i].Close])
            c.add(kIndex + 1, [r[i].Time, midLine[i]])
            c.add(kIndex + 2, [r[i].Time, upBand[i]])
            c.add(kIndex + 3, [r[i].Time, downBand[i]])
        }
    }

    // check the position
    var pos = e.GetPosition()
    if (!pos) {
        return
    }
    var holdAmount = 0
    var holdPrice = 0
    if (pos.length > 1) {
        throw "long and short positions are checked at the same time!"
    } else if (pos.length != 0) {
        holdAmount = pos[0].Type == PD_LONG ? pos[0].Amount : -pos[0].Amount
        holdPrice = pos[0].Price
    }

    if (e.state.preBar == -1) {
        e.state.preBar = r[r.length - 1].Time
    }
    // check the signal
    if (e.state.preBar != r[r.length - 1].Time) {   // closing price model
        if (holdAmount <= 0 && r[r.length - 3].Close < upBand[upBand.length - 3] && r[r.length - 2].Close > upBand[upBand.length - 2]) {   // the closing price cross over the upBand
            if (holdAmount < 0) {   // hold a short positions, close them
                Log(e.GetCurrency(), "close short positions", "#FF0000")
                $.CoverShort(e, e.param.symbol, Math.abs(holdAmount))
                c.add(kIndex + 4, {x: r[r.length - 2].Time, color: 'red', shape: 'flag', title: 'close', text: "close short positions"})
            }
            // open long positions
            Log(e.GetCurrency(), "open long positions", "#FF0000")
            $.OpenLong(e, e.param.symbol, 10)
            c.add(kIndex + 4, {x: r[r.length - 2].Time, color: 'red', shape: 'flag', title: 'long', text: "open long positions"})
        } else if (holdAmount >= 0 && r[r.length - 3].Close > downBand[downBand.length - 3] && r[r.length - 2].Close < downBand[downBand.length - 2]) {  // the closing price cross down the downBand
            if (holdAmount > 0) {   // hold long positions, close them
                Log(e.GetCurrency(), "close long positions", "#FF0000")
                $.CoverLong(e, e.param.symbol, Math.abs(holdAmount))
                c.add(kIndex + 4, {x: r[r.length - 2].Time, color: 'green', shape: 'flag', title: 'close', text: "close long positions"})
            }
            // open short positions
            Log(e.GetCurrency(), "open short positions", "#FF0000")
            $.OpenShort(e, e.param.symbol, 10)
            c.add(kIndex + 4, {x: r[r.length - 2].Time, color: 'green', shape: 'flag', title: 'short', text: "open short positions"})
        } else {
            // close positions
            if (holdAmount > 0 && (r[r.length - 2].Close <= holdPrice * (1 - e.param.stopLoss) || r[r.length - 2].Close <= midLine[midLine.length - 2])) {   // Hold a long position, the closing price is less than or equal to the midline, stop loss at the opening price
                Log(e.GetCurrency(), "trigger midline or stop loss, close long positions", "#FF0000")
                $.CoverLong(e, e.param.symbol, Math.abs(holdAmount))
                c.add(kIndex + 4, {x: r[r.length - 2].Time, color: 'green', shape: 'flag', title: 'close', text: "close long positions"})
            } else if (holdAmount < 0 && (r[r.length - 2].Close >= holdPrice * (1 + e.param.stopLoss) || r[r.length - 2].Close >= midLine[midLine.length - 2])) {  // Hold a short position, the closing price is greater than or equal to the midline, stop loss at the opening price
                Log(e.GetCurrency(), "trigger midline or stop loss, close short positions", "#FF0000")
                $.CoverShort(e, e.param.symbol, Math.abs(holdAmount))
                c.add(kIndex + 4, {x: r[r.length - 2].Time, color: 'red', shape: 'flag', title: 'close', text: "close short positions"})
            }
        }
        e.state.preBar = r[r.length - 1].Time
    }
}

function main() {
    var arrChartConfig = []
    if (arrParam.length != exchanges.length) {
        throw "Parameters and exchange objects do not match!"
    }
    var arrState = _G("arrState")
    _.each(exchanges, function(e, index) {
        if (e.GetName() != "Futures_Binance") {
            throw "The exchange is not supported!"
        }
        e.param = arrParam[index]
        e.state = {lastBarTime: 0, symbol: e.param.symbol, currency: e.GetCurrency()}
        if (arrState) {
            if (arrState[index].symbol == e.param.symbol && arrState[index].currency == e.GetCurrency()) {
                Log("restore:", e.state)
                e.state = arrState[index]
            } else {
                throw "The restored data does not match the current settings!"
            }
        }
        e.state.preBar = -1   // initial setting -1
        e.SetContractType(e.param.symbol)
        Log(e.GetName(), e.GetLabel(), "set contracts:", e.param.symbol)
        arrChartConfig.push(createChartConfig(e.GetCurrency(), e.param.atrPeriod, e.param.emaPeriod, index))
    })
    var chart = Chart(arrChartConfig)
    chart.reset()

    while (true) {
        _.each(exchanges, function(e, index) {
            process(e, index + index * 4, chart)
            Sleep(500)
        })
    }
}

function onexit() {
    // record e.state
    var arrState = []
    _.each(exchanges, function(e) {
        arrState.push(e.state)
    })
    Log("record:", arrState)
    _G("arrState", arrState)
}
Parámetros de la estrategia:
var params = '[{
        "symbol" : "swap",    // contract code
        "period" : 86400,     // K-line period, 86,400 seconds is a day
        "stopLoss" : 0.07,    // stop loss factor, 0.07 or 7%
        "atrPeriod" : 10,     // ATR indicator parameters
        "emaPeriod" : 10,     // EMA indicator parameters
        "trackRatio" : 1,     // upBand and downBand coefficients
        "openRatio" : 0.1     // The reserved opening percentage, which is not supported for now
    }, {
        "symbol" : "swap",
        "period" : 86400,
        "stopLoss" : 0.07,
        "atrPeriod" : 10,
        "emaPeriod" : 10,
        "trackRatio" : 1,
        "openRatio" : 0.1
    }]'
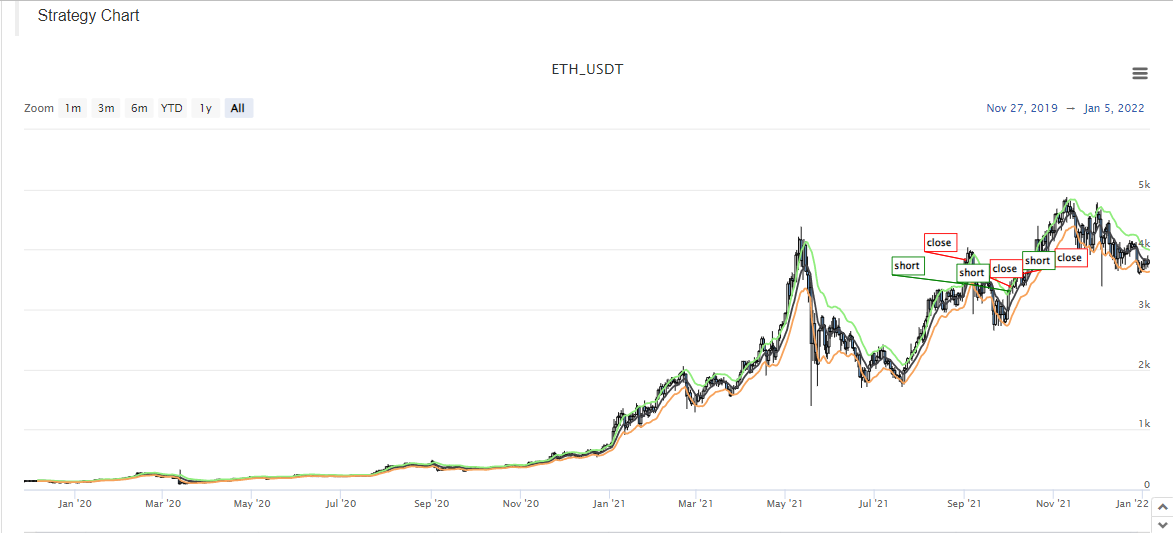
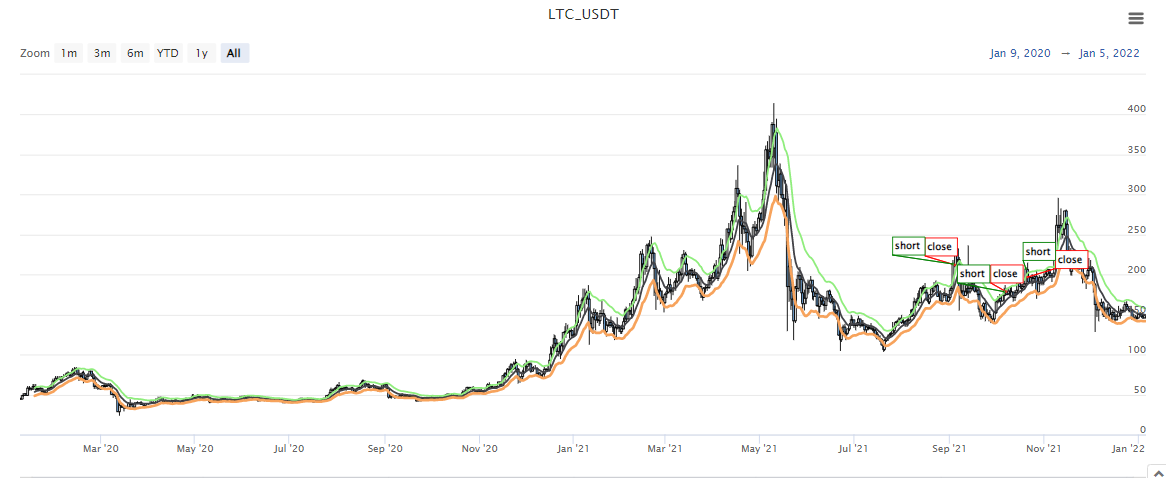
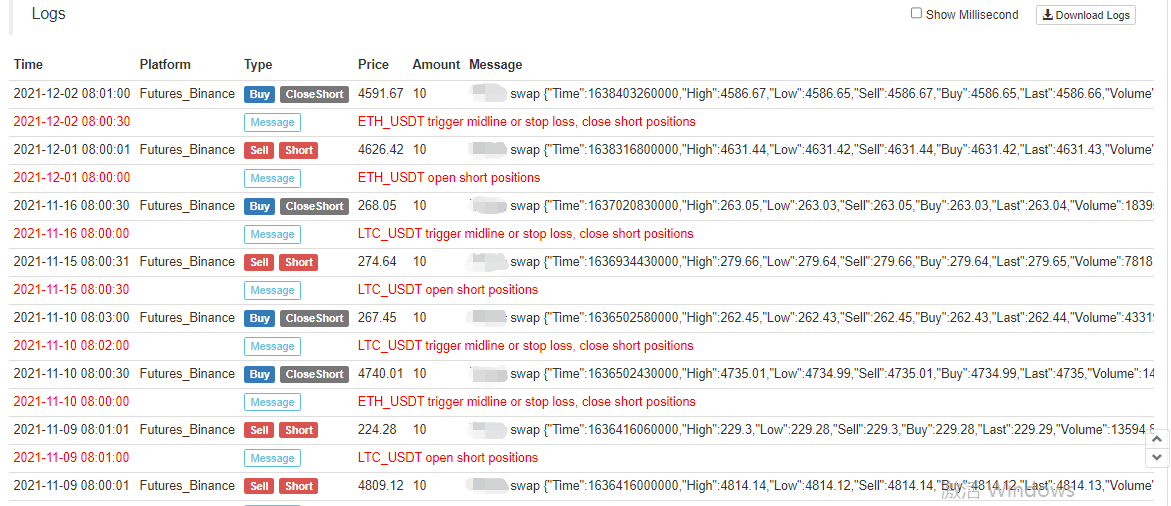
Capturas de pantalla de pruebas de retroceso:


Código fuente de la estrategia:https://www.fmz.com/strategy/339344
Las estrategias son para backtesting y investigación de aprendizaje solamente. Por favor, modifique, optimice, y haga referencia al bot real por usted mismo.
- Introducción al arbitraje de lead-lag en criptomonedas (2)
- Introducción al conjunto de Lead-Lag en las monedas digitales (2)
- Discusión sobre la recepción de señales externas de la plataforma FMZ: una solución completa para recibir señales con servicio HTTP incorporado en la estrategia
- Exploración de la recepción de señales externas de la plataforma FMZ: estrategias para una solución completa de recepción de señales de servicios HTTP integrados
- Introducción al arbitraje de lead-lag en criptomonedas (1)
- Introducción al conjunto de Lead-Lag en las monedas digitales (1)
- Discusión sobre la recepción de señales externas de la plataforma FMZ: API extendida VS estrategia Servicio HTTP incorporado
- Exploración de la recepción de señales externas de la plataforma FMZ: API de expansión vs estrategia de servicio HTTP incorporado
- Discusión sobre el método de prueba de estrategias basado en el generador de tickers aleatorios
- Explorar métodos de prueba de estrategias basados en generadores de mercado aleatorios
- Nueva característica de FMZ Quant: Utilice la función _Serve para crear servicios HTTP fácilmente
- Ganar 80 veces en 5 días, el poder de la estrategia de alta frecuencia
- Investigación y ejemplo sobre el diseño de estrategias de cobertura de Maker Spots y futuros
- Construir una base de datos cuantitativa de FMZ con SQLite
- Cómo asignar datos de versiones diferentes a una estrategia alquilada mediante metadatos de código de alquiler de estrategia
- Arbitraje de intereses de la tasa de financiación perpetua de Binance (mercado alcista actual anualizado 100%)
- Estrategia de punto de inflexión de futuros de divisas digitales con doble EMA (Tutorial)
- Suscribir Nueva estrategia de acciones para el spot de moneda digital (Tutorial)
- Realizar una idea con 60 líneas de código - Estrategia de pesca en el fondo del contrato
- Las operaciones de cambio de divisas en el mercado de divisas se clasifican en la categoría de operaciones de cambio de divisas.
- Diseño de un sistema de gestión de sincronización de pedidos basado en FMZ Quant (2)
- Escribir una herramienta de comercio semiautomático utilizando el lenguaje Pine
- Explora el diseño de estrategias de alta frecuencia del cambio mágico de LeeksReaper
- Análisis de la estrategia de LeeksReaper (2)
- La "estrategia mágica de doble EMA" de los veteranos de YouTube
- Implementación del lenguaje JavaScript de los indicadores de Fisher y dibujo en FMZ
- Ejemplo de diseño de la estrategia dYdX
- Diseño de un sistema de gestión de sincronización de pedidos basado en FMZ Quant (1)
- Análisis de la estrategia de LeeksReaper (1)
- El importe de las pérdidas derivadas de las operaciones de cobertura de las operaciones de cobertura de las operaciones de cobertura de las operaciones de cobertura de las operaciones de cobertura de las operaciones de cobertura de las operaciones de cobertura de las operaciones de cobertura.
- Estado actual y funcionamiento recomendado de la estrategia de tasas de financiación