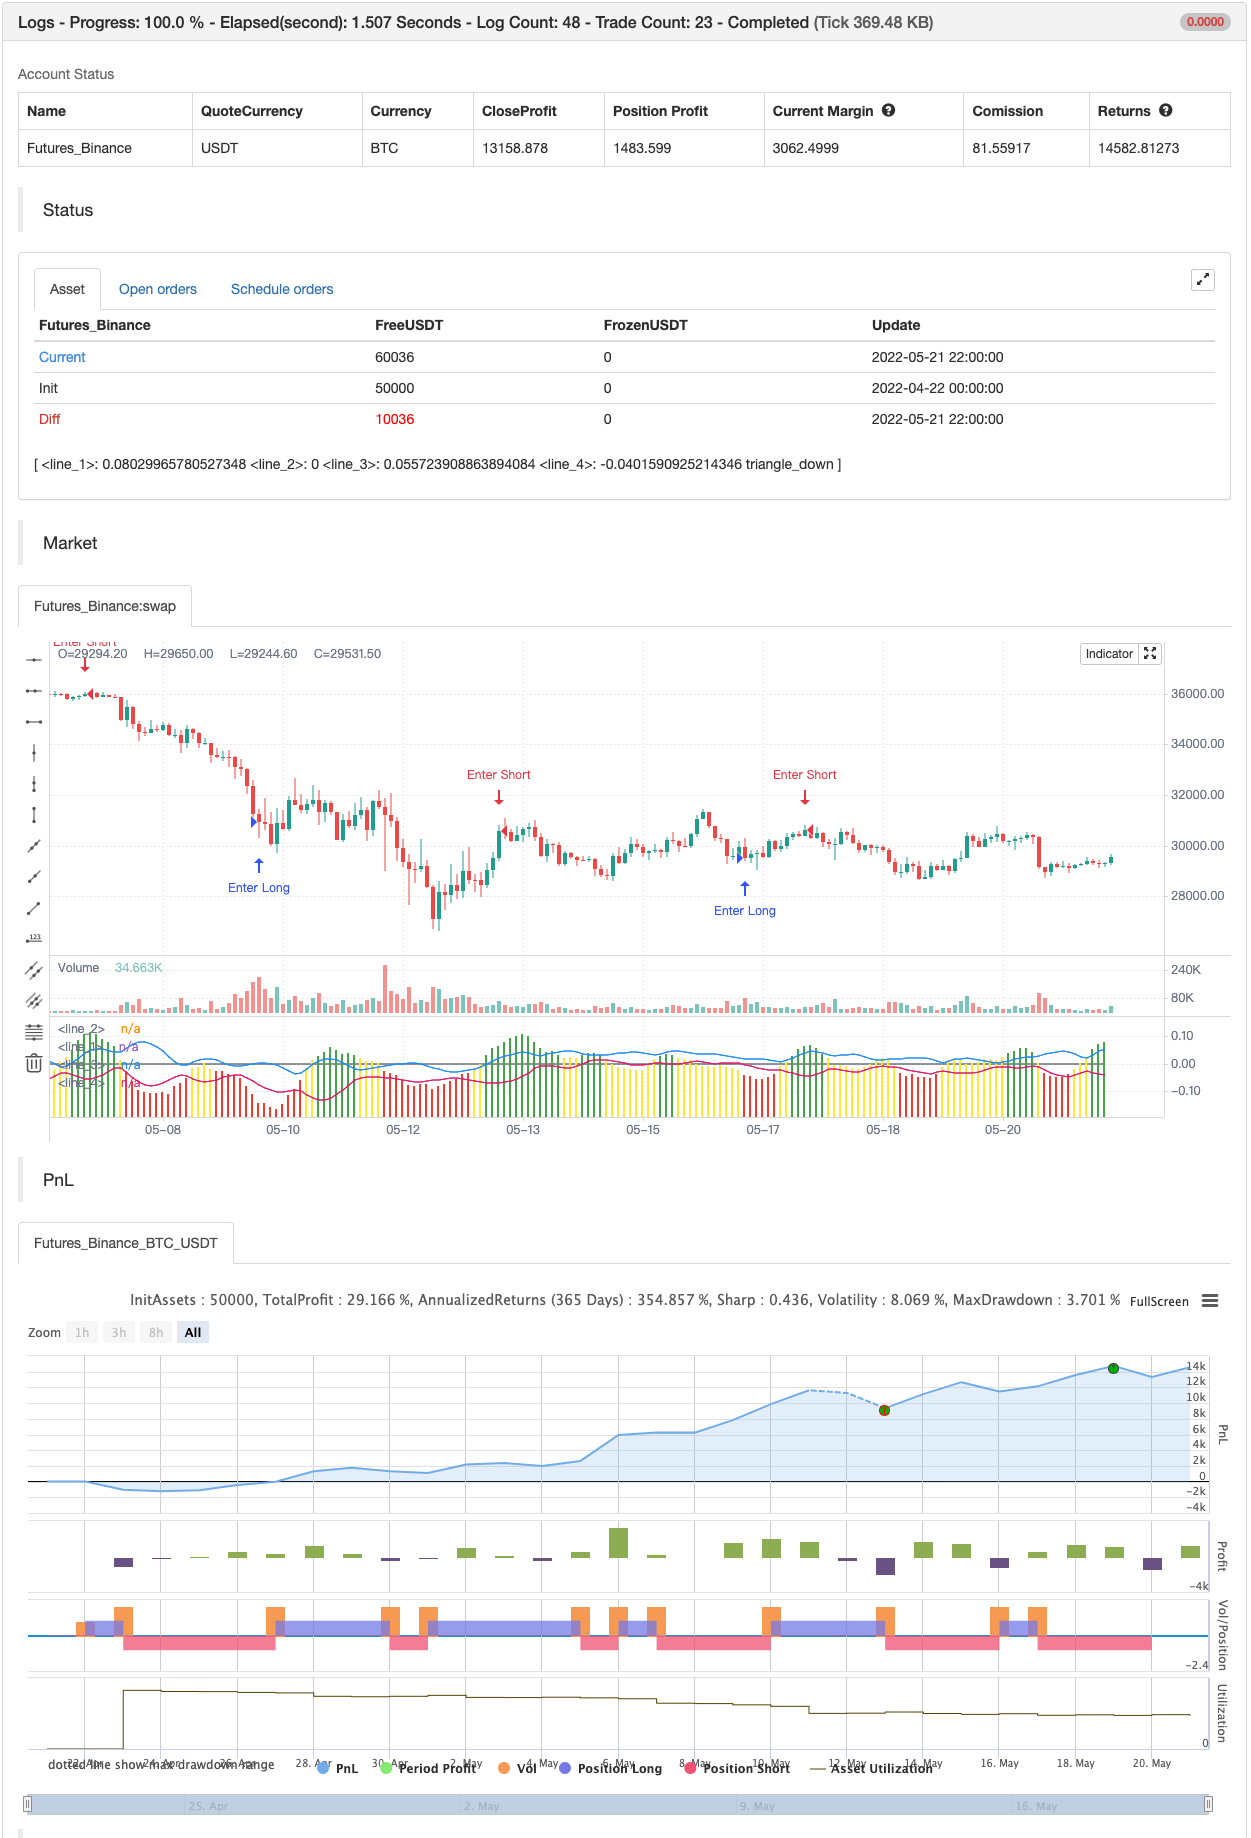
Entropía de Shannon V2
El autor:¿ Qué pasa?, Fecha: 23 de mayo de 2022 15:07:54Las etiquetas:elLa WMA
Versión 2, Entropía de Shannon Esta actualización incluye tanto una banda muerta (Plotting Opcional) como Indicador de PercentRank.
Aquí hay una forma única de ver su información de precio y volumen. Utilice el valor calculado de
H = -suma (prob) i * log_base (prob) i
He incluido la forma típica que he estado experimentando con esto, que es la diferencia entre la información de volumen y la información de precio. He incluido la opción de desactivar los datos de precio o volumen para ver el valor de la Entropía de Shannon de cualquiera de los valores. Hay un montón de scripts complejos por ahí tratando de hacer lo que este cálculo está haciendo en 3 líneas. Como con cualquier cosa, no hay almuerzos gratis, por lo que puede ver muy bien a medida que baja las longitudes aprenderá rápidamente dónde están sus frecuencias nyquist, querrá trabajar en aproximadamente el doble del valor ruidoso como mínimo.
El uso de este script se basa en

/*backtest
start: 2022-04-22 00:00:00
end: 2022-05-21 23:59:00
period: 2h
basePeriod: 15m
exchanges: [{"eid":"Futures_Binance","currency":"BTC_USDT"}]
*/

// This source code is subject to the terms of the Mozilla Public License 2.0 at https://mozilla.org/MPL/2.0/
// © kocurekc

//@version=4
//
// @author Kocurekc
// Rev-3, Added STDev bands and Precent Rank
// Rev-2, Shannon entropy
// Rev-1, new picture for moderators
// Rev-0, added colors, flipped delta to clean up view
//
// Live a little, publish your scripts...be a John Elhers
//

study(title="Shannon Entropy V2", shorttitle="Info-S", precision=2)
src = input(close, title="source", type=input.source)
len = input(9, title="Entropy Length", type=input.integer)
range = input(0.025, title="color level", type=input.float)
avg = input(44, title="Averaging Length", type=input.integer)
vPR = input(2, title="Percent Rank Limit", type=input.integer)
bc = input(true, title="Include Source", type=input.bool)
vc = input(true, title="Include Volume", type=input.bool)
pb = input(true, title="Print Bands", type=input.bool)

//Shannon Entropy, for source (close) or for Volume or both
cr = src/sum(src,len)
vr = log(volume)/sum(log(volume),len)
info = ((vc ? sum(vr*log10(vr)/log10(2),len) : 0) - (bc ? vc ? sum(cr*log10(cr)/log10(2),len) : sum(cr*log10(cr)/log10(2),len) : 0))

//coloring for Shannon Entropy using both source and volume
hc1 = info > range ? #4caf50 : info > range * -1 ? #ffeb3b : info <= range * -1 ? #f44336 : na

//Plotting
plot(info, style=(bc and vc ? plot.style_columns :plot.style_line ), color=hc1 )
plot((bc and vc ? 0 : na), color=color.gray)


//Top/Bottom STDev
value = wma(info,avg)
top = value+stdev(info,len)
btm = value-stdev(info,len)
plot(pb ? top:na)
plot(pb ? btm:na)

//Percent Rank and ploting
hvp = percentrank(info,avg)
plotshape(hvp>(100-vPR) ? info : na, location=location.absolute, style=shape.triangledown, color=color.red, size=size.tiny, transp=30, offset=0)
plotshape(hvp<vPR ? info : na, location=location.absolute, style=shape.triangleup, color=color.green, size=size.tiny, transp=30, offset=0)

if hvp<vPR
    strategy.entry("Enter Long", strategy.long)
else if hvp>(100-vPR)
    strategy.entry("Enter Short", strategy.short)
- Estrategia de seguimiento de tendencias de adaptación basada en el avance de Bolingbroke
- BRAHMASTRA también
- El stock fácil
- jma + dwma por multigranos
- Estrategia de escáner bajo cripto
- Williams %R - Limpiado
- Hull Moving Average Swing Trader (Tradador de movimiento de la media del casco)
- Divergencia de volumen
- SuperB
- Puntos de entrada BB-RSI-ADX
- Indice de fuerza relativa - Divergencias - Libertus
- Regresión lineal ++
- RedK Dual VADER con barras de energía
- Zonas de consolidación - en vivo
- Estimación cualitativa cuantitativa
- Alerta cruzada de promedio móvil, marco de tiempo múltiple (MTF)
- La estrategia de recarga del MACD
- Promedios móviles con tendencia superior
- Negociación de ABC
- 15 MIN BTCUSDTPERP BOT
- Supertrend ATR con el seguimiento de la parada de pérdidas
- Flujo de volumen v3
- Scalping por hora de futuros de criptomonedas con ma & rsi - ogcheckers
- ATR suavizado
- Buscador de bloques de orden
- TendenciaScalp-FractalBox-3EMA
- Señales de QQE
- Selección de amplitud de red en U
- Indicador personalizado CM MACD - Marco de tiempo múltiple - V2
- Línea de captura