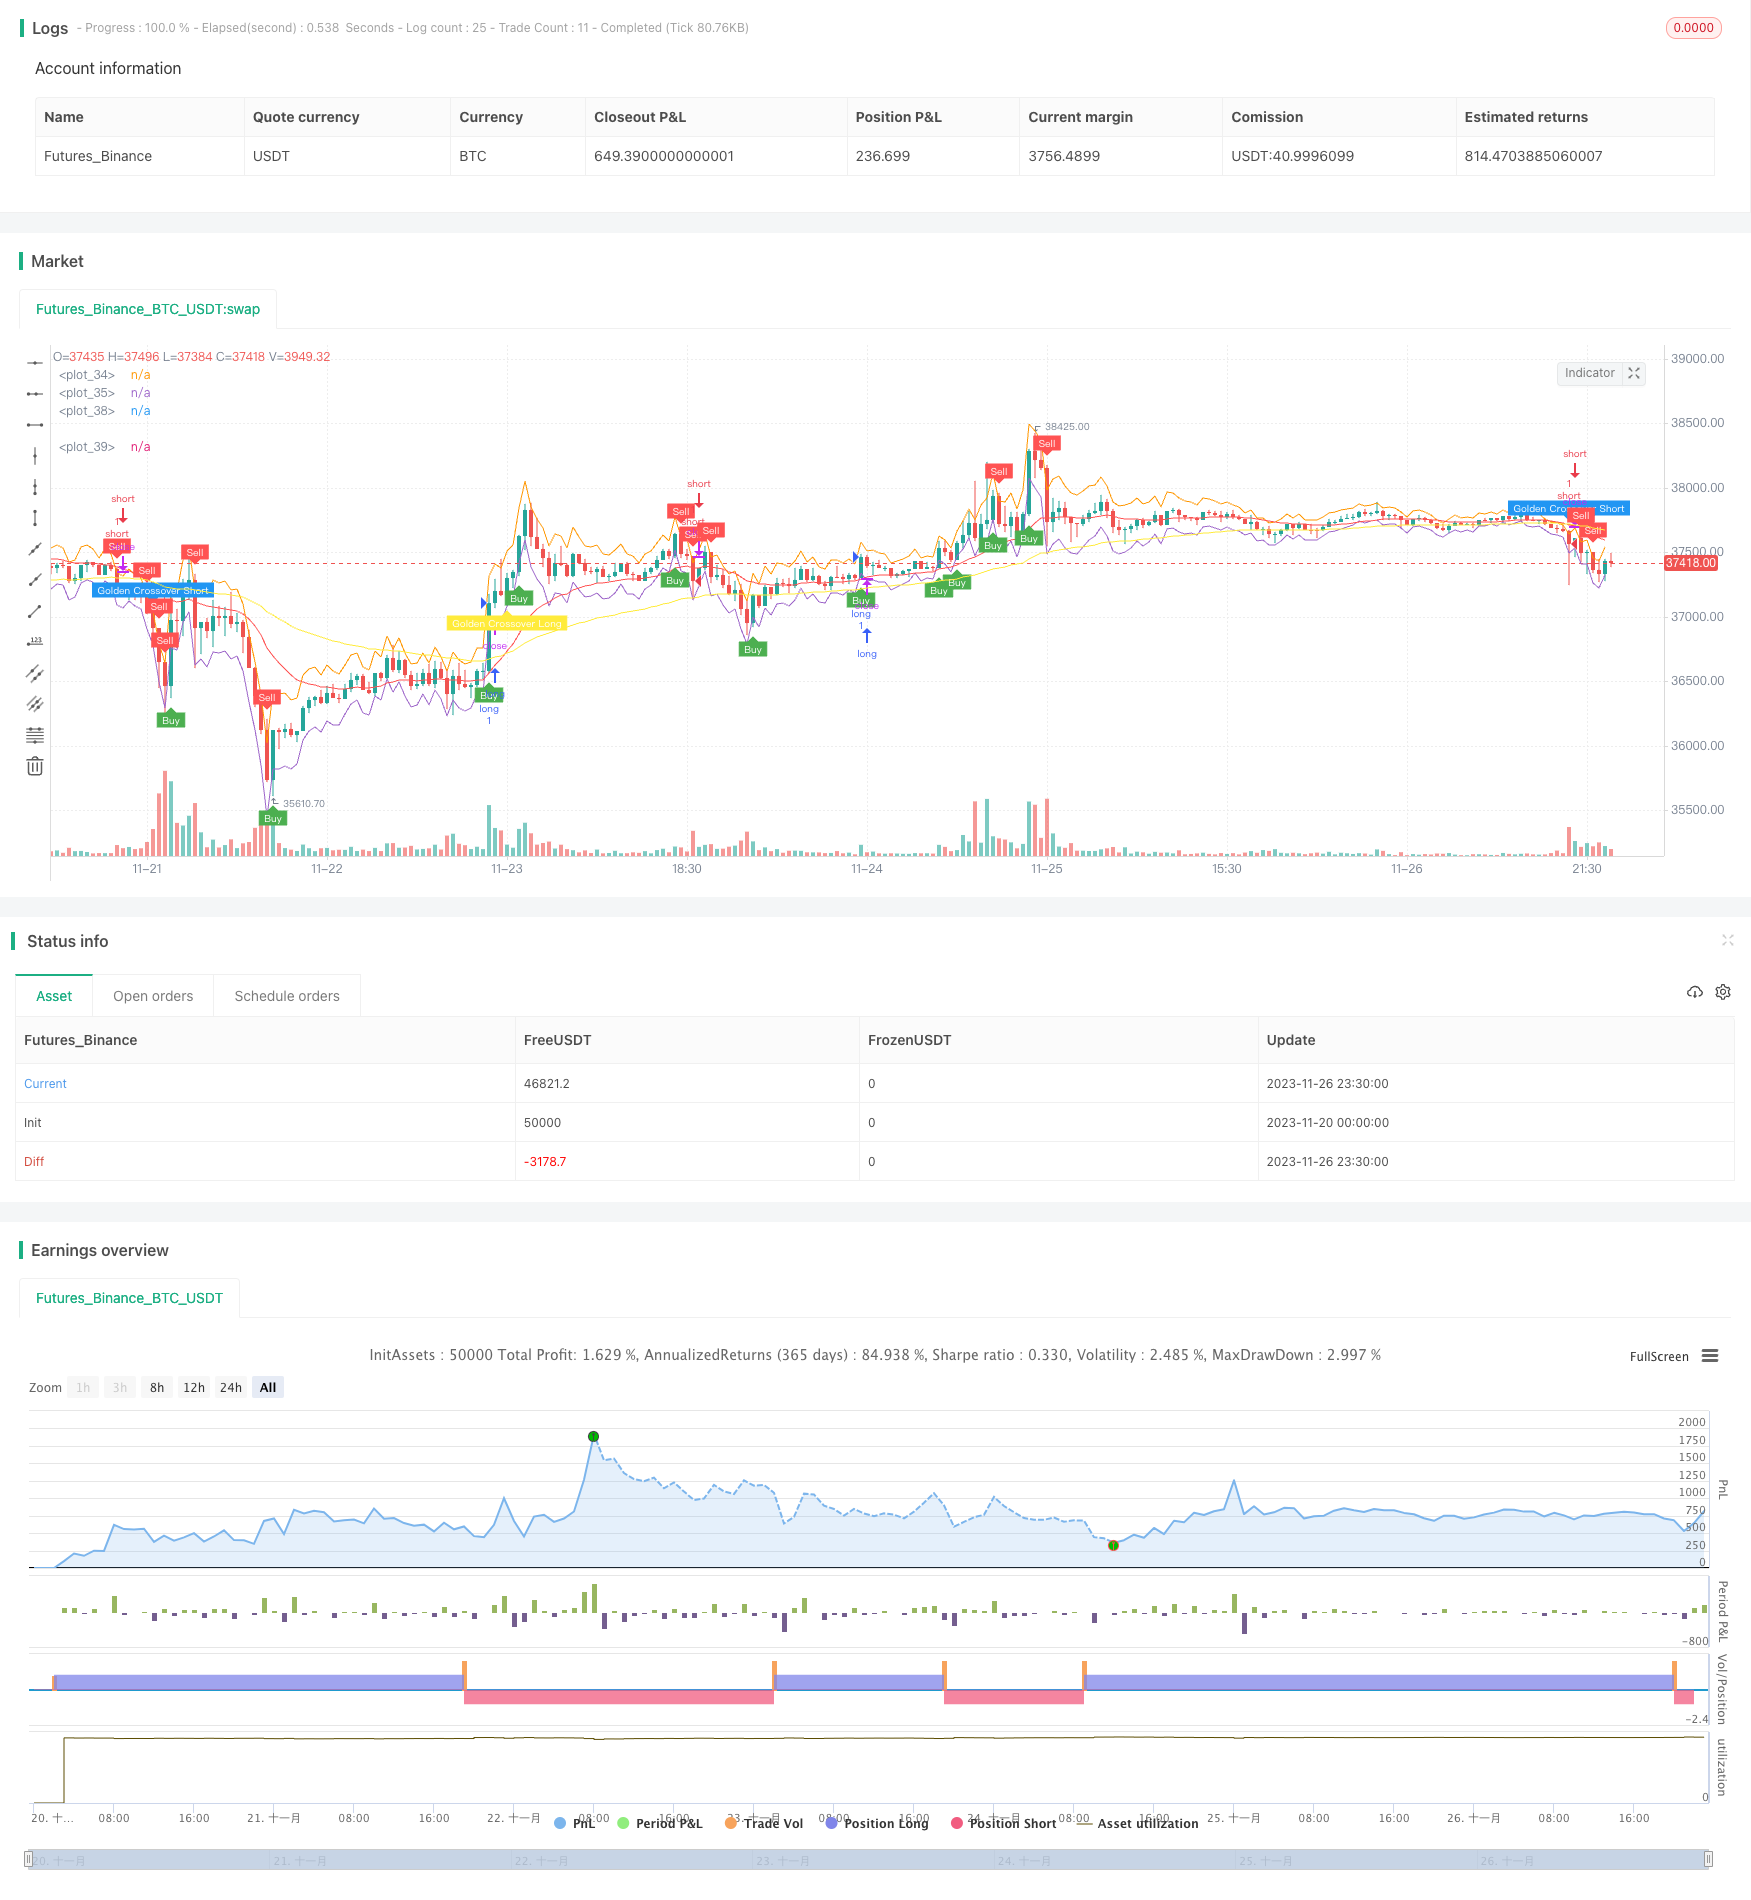
Estrategias de superscalping basadas en el canal RSI y ATR
El autor:¿ Qué pasa?, Fecha: 2023-11-28 15:15:14Las etiquetas:

Estrategia de superscalping basada en el RSI y el canal ATR
Resumen general
Esta estrategia se basa en el índice de fuerza relativa (RSI) y el canal de rango verdadero promedio (ATR), adecuado para marcos de tiempo de 5 minutos y 15 minutos, perteneciente al tipo de estrategia de super scalping.
Principio de la estrategia
- Utilice el promedio móvil exponencial (EMA) de 21 días y el EMA de 65 días para formar una cruz dorada y una cruz muerta, juzgando la dirección de la tendencia principal.
- Cuando el RSI está por debajo de 50, es bajista; cuando está por encima de 50, es alcista, enviando señales de compra y venta.
- Las bandas superior e inferior del canal ATR son: close+ATR y close-ATR. Vender cuando close rompe la banda superior de ATR y comprar cuando rompe la banda inferior.
- Establezca el stop loss en 2 veces ATR y tome ganancias en 5 veces ATR.
Análisis de ventajas
- Usando cruz dorada y cruz muerta para determinar la tendencia principal, evitando el comercio contra la tendencia.
- El RSI puede identificar un mejor momento de entrada.
- El canal ATR establece puntos de stop loss y take profit de manera efectiva, mejorando en gran medida la relación ganancia-pérdida.
- Adecuado para operaciones de scalping de alta frecuencia con ganancias rápidas.
Análisis de riesgos
- Necesita observar el mercado de cerca, de lo contrario, la falta de puntos de entrada o stop-loss puede conducir a una gran pérdida.
- En el mercado de tendencias, pueden producirse múltiples posiciones adicionales, lo que requiere un buen control del tamaño de las posiciones.
- Se requiere suficiente capital para mantener el comercio frecuente.
Dirección de optimización
- Optimizar los parámetros de ATR para obtener pérdidas de parada y ganancias más razonables.
- Añadir otros filtros de indicadores para mejorar la calidad de entrada.
- Agregue las funciones de pérdida automática y ganancia automática.
- Incluir módulos de gestión de capital y control de posiciones.
Resumen de las actividades
Esta estrategia pertenece al tipo de comercio de scalping de alta frecuencia. Establece puntos de entrada y salida a través del indicador RSI y el canal ATR para operaciones rápidas. Las ventajas son ganancias rápidas con buen control de riesgos, adecuadas para el comercio a lo largo de la tendencia. Sin embargo, se necesita una vigilancia cercana del mercado con suficiente capital para apoyar las operaciones frecuentes. En general, esta estrategia tiene un buen rendimiento para el comercio de tendencias y podría mejorarse aún más en la rentabilidad a través de la optimización.
/*backtest
start: 2023-11-20 00:00:00
end: 2023-11-27 00:00:00
period: 30m
basePeriod: 15m
exchanges: [{"eid":"Futures_Binance","currency":"BTC_USDT"}]
*/

//@version=4
strategy("Super Scalper - 5 Min 15 Min", overlay=true)

// Create Indicator's
shortSMA = ema(close, 21)
longSMA = ema(close, 65)
rsi = rsi(close, 14)
atr = atr(14)

// Specify  conditions
longCondition = open < close-atr
shortCondition = open > atr+close
GoldenLong = crossover(shortSMA,longSMA)
Goldenshort = crossover(longSMA,shortSMA)

plotshape(shortCondition, title="Sell Label", text="Sell", location=location.abovebar, style=shape.labeldown, size=size.tiny, color=color.red, textcolor=color.white, transp=0)
plotshape(longCondition, title="Buy Label", text="Buy", location=location.belowbar, style=shape.labelup, size=size.tiny, color=color.green, textcolor=color.white, transp=0)
plotshape(Goldenshort, title="Golden Sell Label", text="Golden Crossover Short", location=location.abovebar, style=shape.labeldown, size=size.tiny, color=color.blue, textcolor=color.white, transp=0)
plotshape(GoldenLong, title="Golden Buy Label", text="Golden Crossover Long", location=location.belowbar, style=shape.labelup, size=size.tiny, color=color.yellow, textcolor=color.white, transp=0)
// Execute trade if condition is True
if (longCondition)
    stopLoss = low - atr * 2
    takeProfit = high + atr * 5
    strategy.entry("long", strategy.long, 1, when = rsi > 50)


if (shortCondition)
    stopLoss = high + atr * 2
    takeProfit = low - atr * 5
    strategy.entry("short", strategy.short, 1, when = rsi < 50)


// Plot ATR bands to chart
plot(atr+close)
plot(close-atr)

// Plot Moving Averages
plot(shortSMA, color = color.red)
plot(longSMA, color = color.yellow)
- Estrategia del índice de impulso de las materias primas
- Estrategia para el avance de la doble tortuga
- Estrategia de negociación cuantitativa basada en la tendencia de la ola
- Ichimoku Kumo Twist estrategia de absorción de oro
- Detención gradual con estrategia de obtención de beneficios parciales
- Estrategia de seguimiento de la tendencia de las medias móviles de la ETI y del CCI Hull
- Ingeniería inversa de la estrategia RSI
- Estrategia cuantitativa doble de las CCI
- Estrategia de ruptura de la doble EMA cruzada
- Estrategia MACD de varios plazos
- Estrategia de tendencia de Donchian
- Estrategia de cruce de las medias móviles multi-SMA
- Estrategia de negociación de indicadores múltiples de RSI
- Estrategia de Supertrend con pérdida de parada de seguimiento
- Estrategia de reversión de la media móvil ponderada de ruptura
- Estrategia del índice de fuerza relativa de la media móvil
- Estrategia de seguimiento de tendencias inteligente de ADX
- Estrategia de agregación del impulso del RSI
- Estrategia de suspensión de pérdidas basada en las brechas de precios
- Estrategia de ruptura de la media móvil