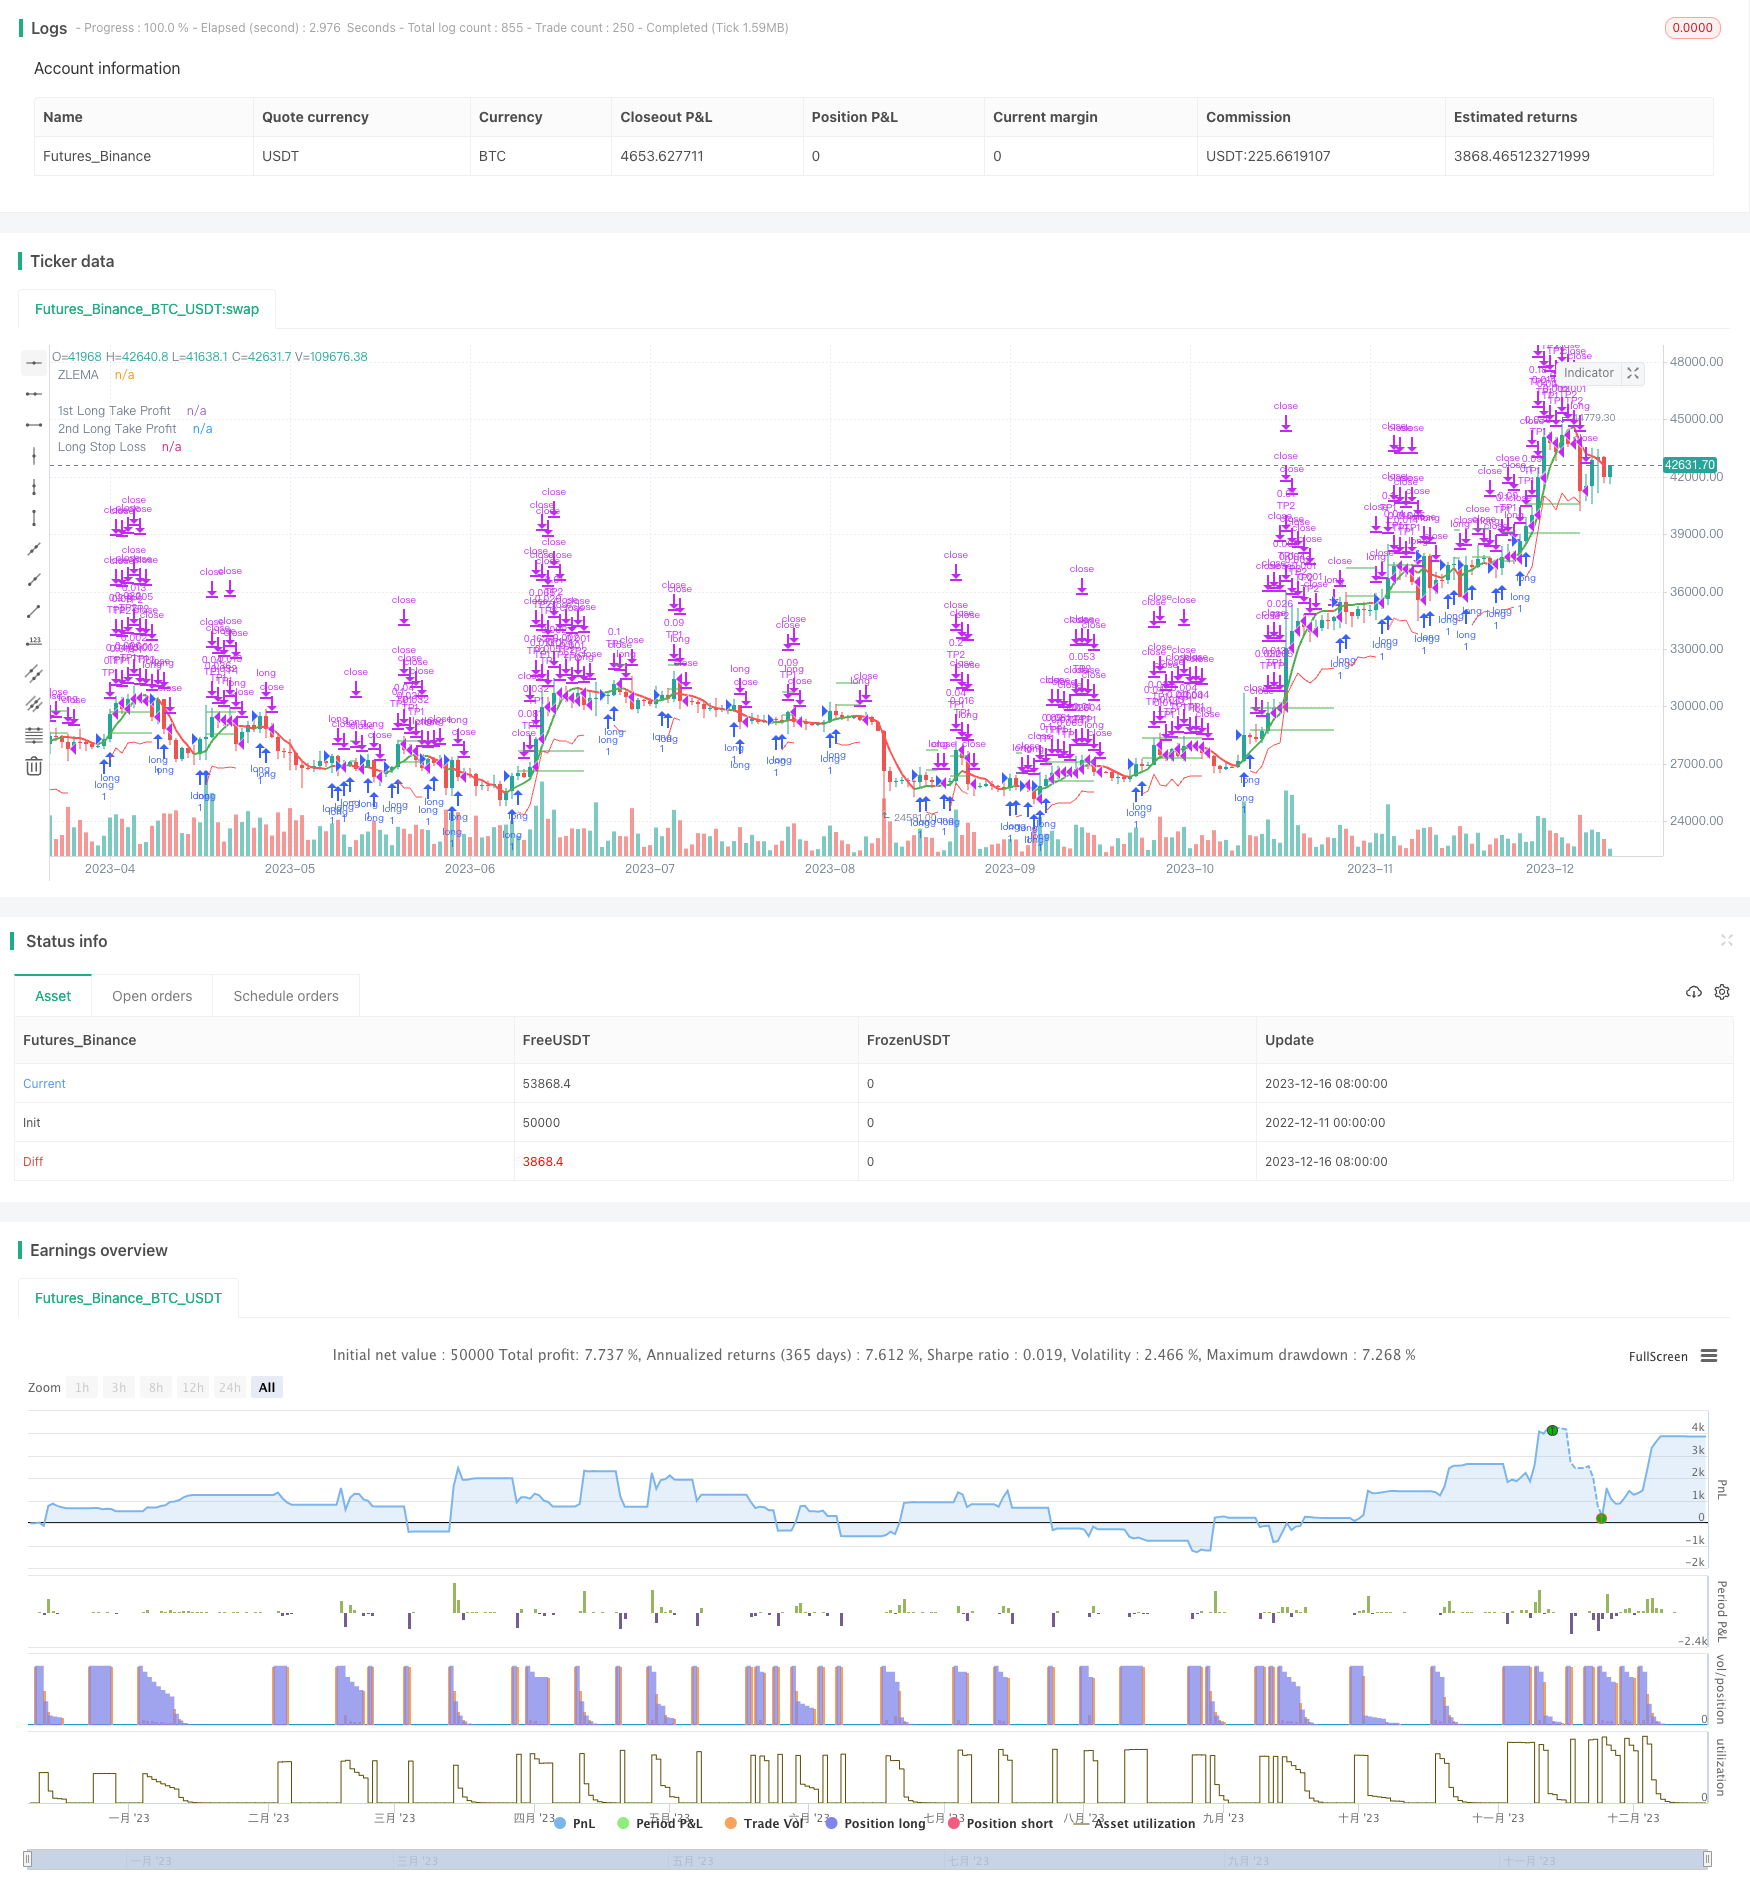
Estrategia de posición de media móvil SMA sólida y confiable

Descripción general
La estrategia es una estrategia de mantenimiento de posición simple basada en la línea media SMA. Cuando la línea SMA corta atraviesa la línea SMA larga, se abre una posición adicional; Cuando la línea SMA corta atraviesa la línea SMA larga, se cierra una posición baja.
Principio de estrategia
La estrategia utiliza dos líneas medias SMA, una corta de 20 días y una larga de 50 días. La línea corta capta más rápidamente las tendencias de los cambios en los precios, y la línea larga filtra el ruido a corto plazo.
En general, la estrategia aprovecha las características curvas de la línea media SMA para determinar la tendencia del movimiento de los precios en dos dimensiones temporales y obtener ganancias con una posición más estable.
Análisis de las ventajas
La estrategia tiene las siguientes ventajas:
- Operación sencilla, fácil de entender, y bajo umbral.
- Utilizando las ventajas de la línea media SMA, relativamente estable
- Tiempo de tenencia prolongado, no es susceptible al ruido del mercado a corto plazo
- Menos parámetros configurables, más fácil de optimizar para encontrar la mejor combinación de parámetros
Análisis de riesgos
La estrategia también tiene los siguientes riesgos:
- Cuando el mercado se tambalea a largo plazo, es probable que haya más pérdidas.
- El SMA promedio es retrasado y no capta los cambios de precios a tiempo
- No puede aprovecharse de manera eficiente de las fluctuaciones a corto plazo
- No puede controlar el tamaño de la pérdida individual
Dirección de optimización
La estrategia también puede ser optimizada en los siguientes aspectos:
- Es el momento de sumarse a los indicadores MACD para juzgar el repunte de la base y reducir las pérdidas en situaciones de crisis
- Prueba de combinaciones medias lineales de SMA de diferentes parámetros para encontrar el parámetro óptimo
- La inclusión de indicadores nacionales para determinar la desviación de la tendencia y mejorar la precisión de la apertura de posiciones
- Aumentar las estrategias de stop-loss para controlar las pérdidas individuales
Resumir
En general, la estrategia de mantenimiento de posiciones en SMA es estable, simple, fácil de usar y adecuada para el mercado real de los principiantes. A medida que la operación cuantitativa continúa evolucionando, la estrategia puede introducir más indicadores y medios técnicos para optimizar y obtener mejores resultados.
/*backtest
start: 2022-12-11 00:00:00
end: 2023-12-17 00:00:00
period: 1d
basePeriod: 1h
exchanges: [{"eid":"Futures_Binance","currency":"BTC_USDT"}]
*/

//@version=5
strategy('Zlema Strateg Long 5m', overlay=true )

// FUNCTIONS

Atr(p) =>
    atr = 0.
    Tr = math.max(high - low, math.max(math.abs(high - close[1]), math.abs(low - close[1])))
    atr := nz(atr[1] + (Tr - atr[1]) / p, Tr)
    atr

// ZLEMA
length = input(title='Length', defval=14)
highlightMovements = input(title='Highlight Movements ?', defval=true)
src = input(title='Source', defval=close)

lag = math.floor((length - 1) / 2)

zlema = ta.ema(src + src - src[lag], length)

zlemaColor = highlightMovements ? zlema > zlema[1] ? color.green : color.red : #6d1e7f
plot(zlema, title='ZLEMA', linewidth=2, color=zlemaColor, transp=0)


// TAKE PROFIT AND STOP LOSS
long_tp1_inp = input.float(1, title='Long Take Profit 1 %', step=0.1) / 100
long_tp1_qty = input.int(10, title='Long Take Profit 1 Qty', step=1)

long_tp2_inp = input.float(5, title='Long Take Profit 2%', step=0.1) / 100
long_tp2_qty = input.int(50, title='Long Take Profit 2 Qty', step=1)

long_take_level_1 = strategy.position_avg_price * (1 + long_tp1_inp)
long_take_level_2 = strategy.position_avg_price * (1 + long_tp2_inp)


// Stop Loss
multiplier = input.float(2.2, 'SL Mutiplier', minval=1, step=0.1)
ATR_period = input.int(17, 'ATR period', minval=1, step=1)

// Strategy
entry_long = zlema > zlema[1]
entry_price_long = ta.valuewhen(entry_long, close, 0)
SL_floating_long = entry_price_long - multiplier * Atr(ATR_period)
exit_long = zlema < zlema[1]

///// BACKTEST PERIOD ///////
testStartYear = input(2022, 'Backtest Start Year')
testStartMonth = input(1, 'Backtest Start Month')
testStartDay = input(1, 'Backtest Start Day')
testPeriodStart = timestamp(testStartYear, testStartMonth, testStartDay, 0, 0)

testStopYear = input(9999, 'Backtest Stop Year')
testStopMonth = input(12, 'Backtest Stop Month')
testStopDay = input(31, 'Backtest Stop Day')
testPeriodStop = timestamp(testStopYear, testStopMonth, testStopDay, 0, 0)

testPeriod() =>
    time >= testPeriodStart and time <= testPeriodStop ? true : false

if testPeriod()
    strategy.entry('long', strategy.long, comment='Long', when=entry_long)
    strategy.exit('TP1', 'long', qty_percent=long_tp1_qty, limit=long_take_level_1)  //, trail_points=entry_price_long * long_trailing / syminfo.mintick, trail_offset=entry_price_long * long_trailing / syminfo.mintick)
    strategy.exit('TP2', qty_percent=long_tp2_qty, limit=long_take_level_2)  //, trail_points=entry_price_long * long_trailing / syminfo.mintick, trail_offset=entry_price_long * long_trailing / syminfo.mintick)
    strategy.close('long', when=exit_long, comment='exit long')


// LONG POSITION
plot(strategy.position_size > 0 ? long_take_level_1 : na, style=plot.style_linebr, color=color.new(color.green, 0), linewidth=1, title='1st Long Take Profit')
plot(strategy.position_size > 0 ? long_take_level_2 : na, style=plot.style_linebr, color=color.new(color.green, 0), linewidth=1, title='2nd Long Take Profit')
plot(strategy.position_size > 0 ? SL_floating_long : na, style=plot.style_linebr, color=color.new(color.red, 0), linewidth=1, title='Long Stop Loss')


if testPeriod()
    strategy.entry('long', strategy.long, comment='Long', when=entry_long)


// LONG POSITIONplot(strategy.position_size > 0 ? SL_floating_long : na, style=plot.style_linebr, color=color.new(color.red, 0), linewidth=1, title='Long Stop Loss')