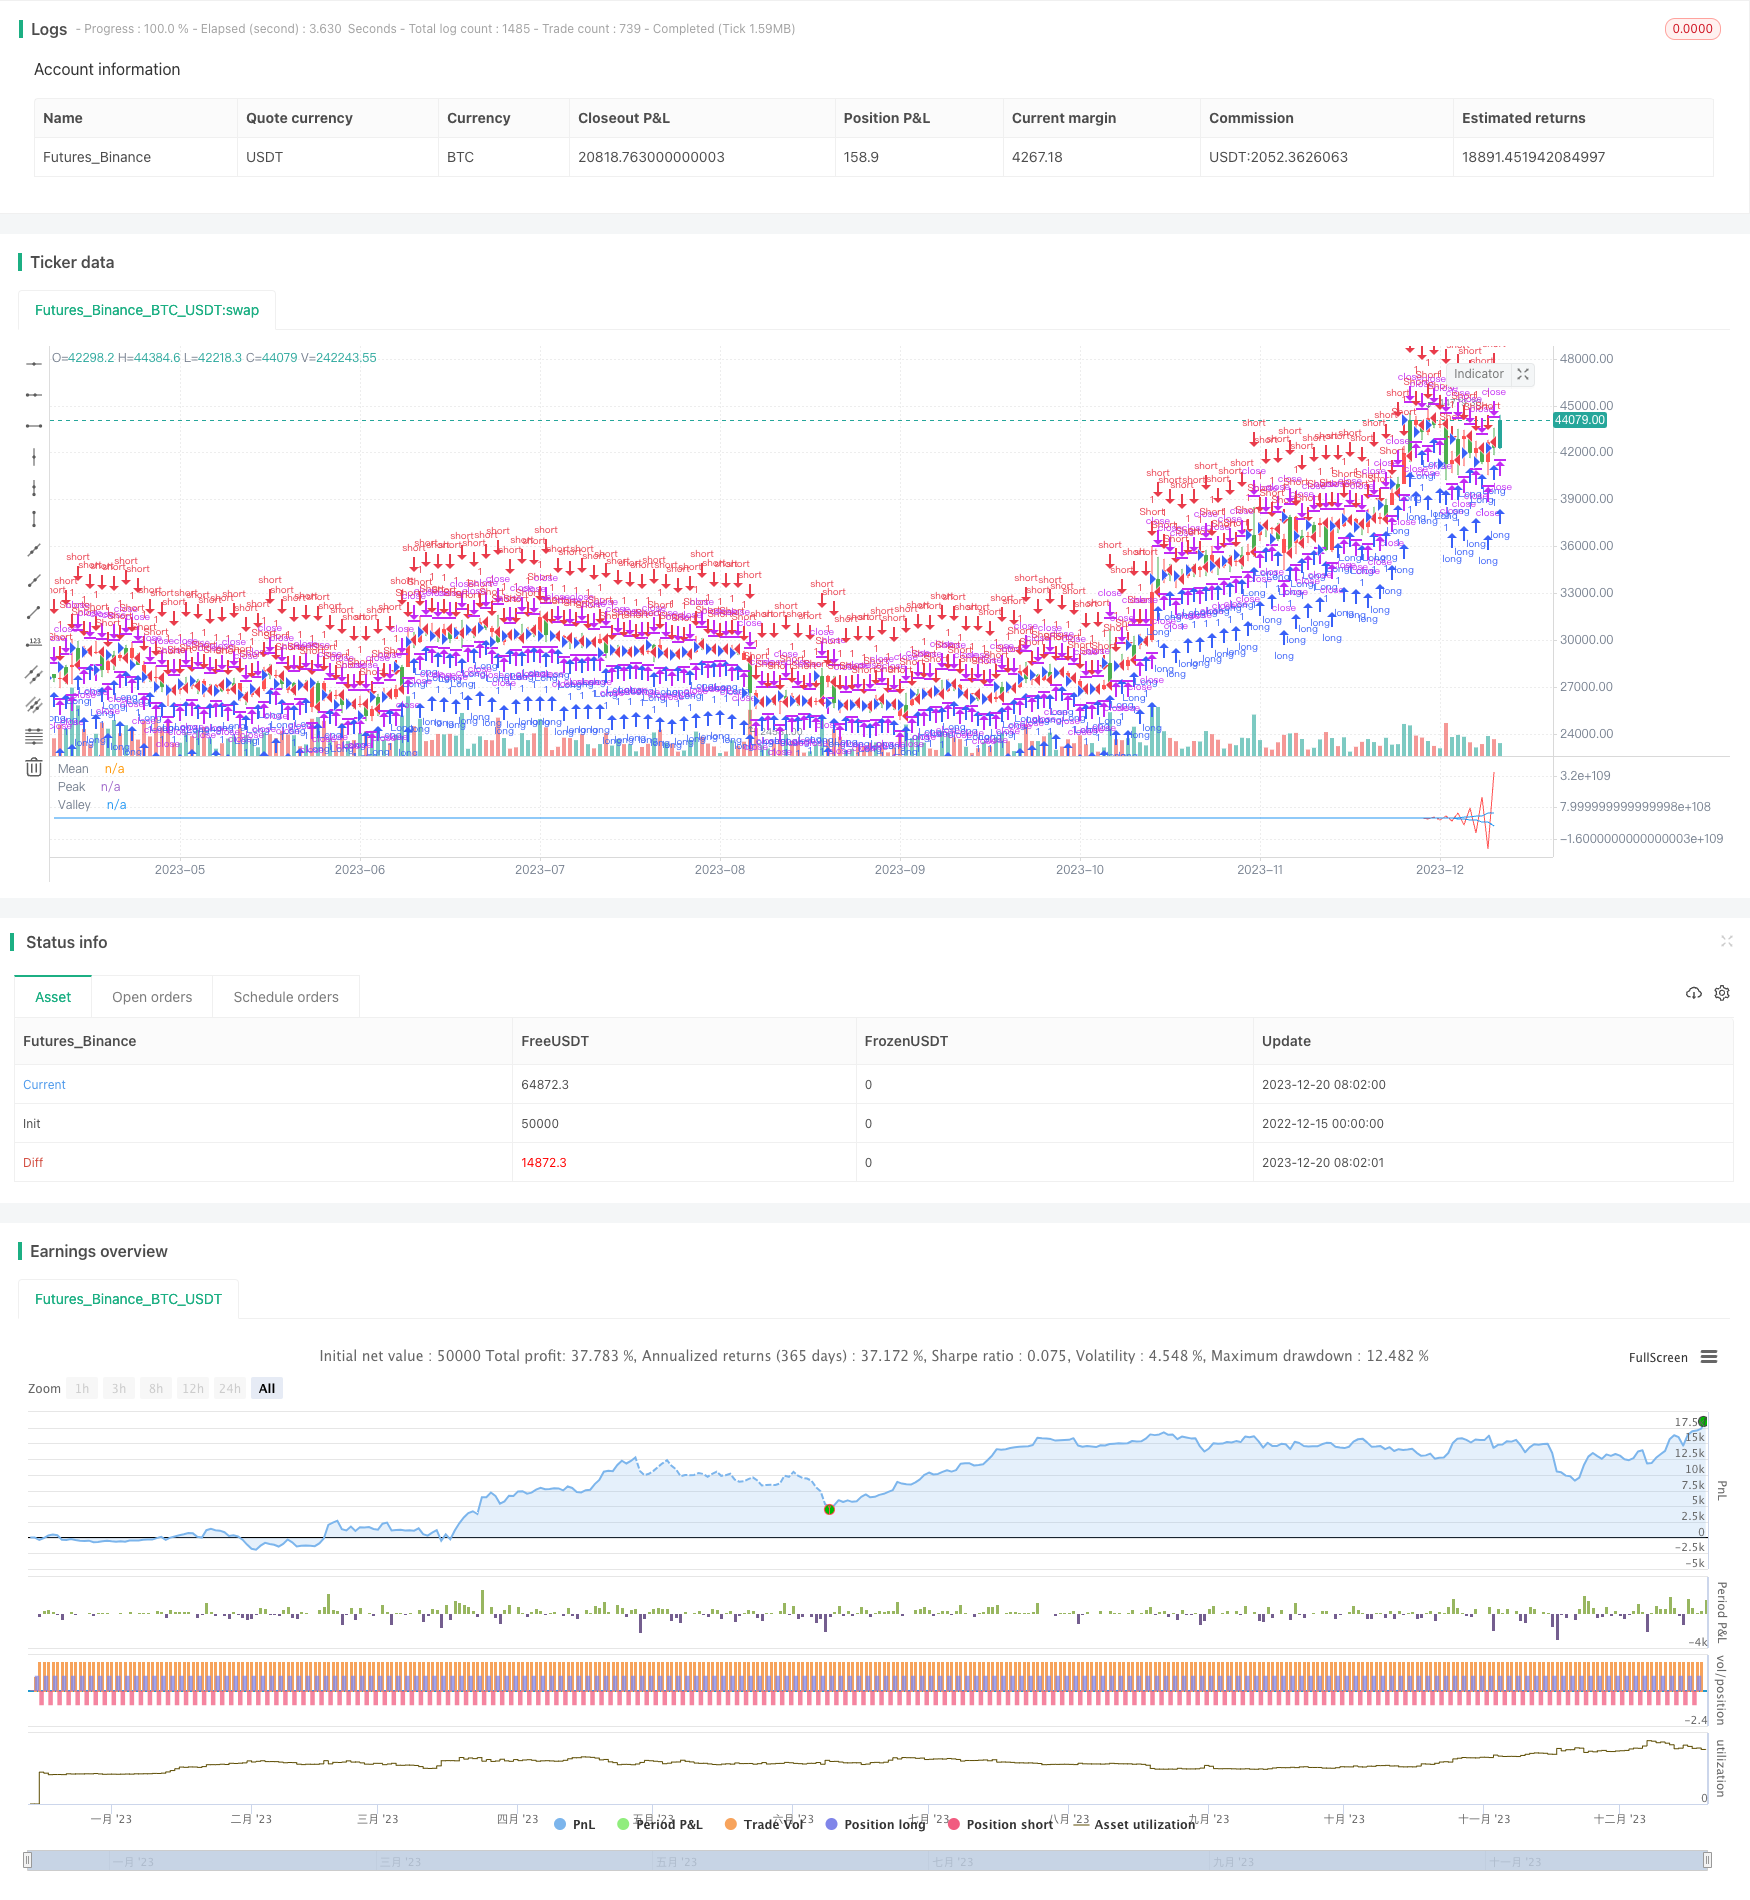
Estrategia de trading cuantitativo basada en la descomposición modal empírica

Descripción general
Esta estrategia se basa en el método de descomposición de modo empírico (EMD), que descompone la secuencia de precios, extrae las características de los diferentes bandos de onda y genera señales de negociación en combinación con el valor medio. La estrategia se aplica principalmente a las posiciones de línea media y larga.
Principio de estrategia
- El método EMD se utiliza para hacer una filtración de banda ancha de los precios y extraer características de fluctuación en los precios.
- Calcula las medias móviles de las secuencias de picos y de valles
- Genera una señal de transacción cuando la línea media supera una cierta proporción de la línea de pico y de valle
- Hacer más o menos de acuerdo a la señal de negociación
Análisis de las ventajas
- El método EMD permite desglosar la secuencia de precios para extraer características útiles.
- La estrategia de control de la línea del valle del pico solo opera cuando los precios fluctúan por encima de un cierto margen.
- Combinado con la línea media, puede eliminar efectivamente las falsas brechas
Análisis de riesgos
- La elección incorrecta de los parámetros del método EMD puede causar una sobreadaptación
- Necesita un ciclo más largo para formar señales de negociación, no puede adaptarse a las operaciones de alta frecuencia
- No puede hacer frente a las fuertes fluctuaciones de precios en el mercado
Dirección de optimización
- Optimizar los parámetros del modelo EMD para mejorar su adaptabilidad al mercado
- Combinado con otros indicadores como señal de parada de pérdidas
- Intentar diferentes series de precios como entrada de estrategia
Resumir
Esta estrategia utiliza el método de descomposición de la modalidad empírica para extraer características de la secuencia de precios y generar señales de negociación basadas en las características extraídas, logrando una estrategia de negociación de línea media y larga estable. La ventaja de esta estrategia reside en la capacidad de identificar con eficacia las características periódicas en los precios y emitir instrucciones de negociación en medio de grandes fluctuaciones.
/*backtest
start: 2022-12-15 00:00:00
end: 2023-12-21 00:00:00
period: 1d
basePeriod: 1h
exchanges: [{"eid":"Futures_Binance","currency":"BTC_USDT"}]
*/

//@version=2
////////////////////////////////////////////////////////////
//  Copyright by HPotter v1.0 12/04/2017
// The related article is copyrighted material from Stocks & Commodities Mar 2010
// You can use in the xPrice any series: Open, High, Low, Close, HL2, HLC3, OHLC4 and ect...
//
// You can change long to short in the Input Settings
// Please, use it only for learning or paper trading. Do not for real trading.
////////////////////////////////////////////////////////////
strategy(title="Empirical Mode Decomposition")
Length = input(20, minval=1)
Delta = input(0.5)
Fraction = input(0.1)
reverse = input(false, title="Trade reverse")
xPrice = hl2
beta = cos(3.1415 * (360 / Length) / 180)
gamma = 1 / cos(3.1415 * (720 * Delta / Length) / 180)
alpha = gamma - sqrt(gamma * gamma - 1)
xBandpassFilter = 0.5 * (1 - alpha) * (xPrice - xPrice[2]) + beta * (1 + alpha) * nz(xBandpassFilter[1]) - alpha * nz(xBandpassFilter[2])
xMean = sma(xBandpassFilter, 2 * Length)
xPeak =  iff (xBandpassFilter[1] > xBandpassFilter and xBandpassFilter[1] > xBandpassFilter[2], xBandpassFilter[1], nz(xPeak[1]))
xValley =  iff (xBandpassFilter[1] < xBandpassFilter and xBandpassFilter[1] < xBandpassFilter[2], xBandpassFilter[1], nz(xValley[1]))
xAvrPeak = sma(xPeak, 50)
xAvrValley = sma(xValley, 50)
nAvrPeak = Fraction * xAvrPeak
nAvrValley = Fraction * xAvrValley
pos = iff(xMean > nAvrPeak and xMean > nAvrValley, 1,
	     iff(xMean < nAvrPeak and xMean < nAvrValley, -1, nz(pos[1], 0)))
possig = iff(reverse and pos == 1, -1,
          iff(reverse and pos == -1, 1, pos))
if (possig == 1)
    strategy.entry("Long", strategy.long)
if (possig == -1)
    strategy.entry("Short", strategy.short)
barcolor(possig == -1 ? red: possig == 1 ? green : blue )
plot(xMean, color=red, title="Mean")
plot(nAvrPeak, color=blue, title="Peak")
plot(nAvrValley, color=blue, title="Valley")