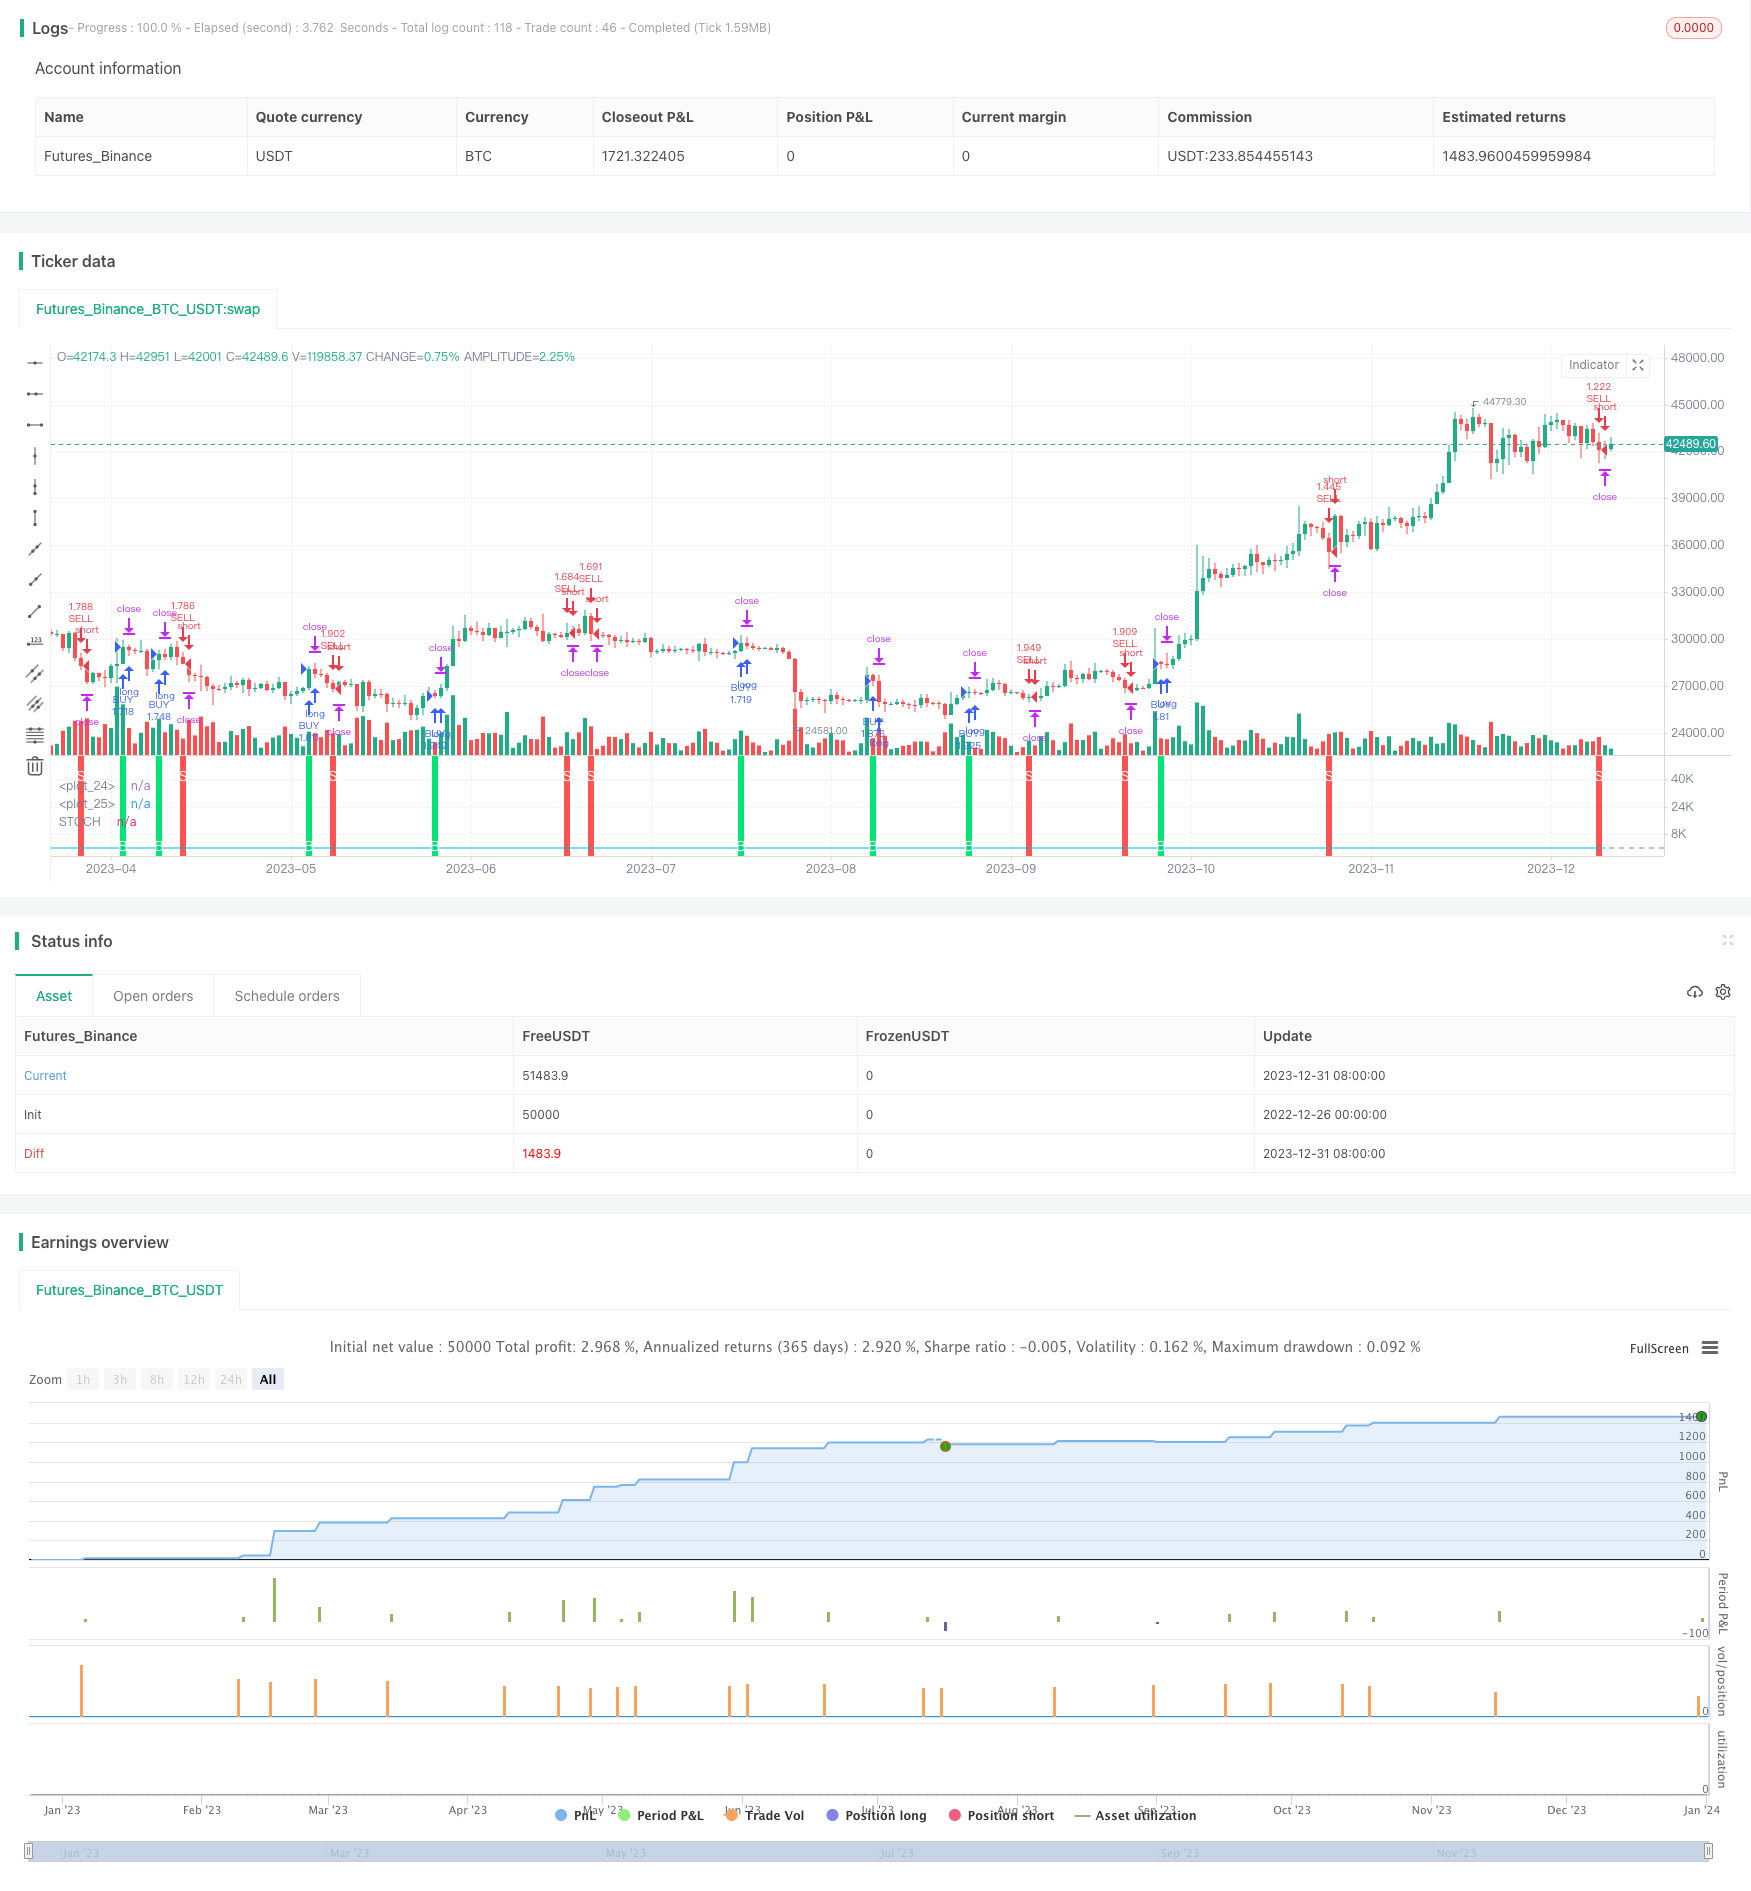
La transformación estocástica de Fisher detiene temporalmente la reversión del indicador STOCH Estrategia cuantitativa

Descripción general
La idea central de esta estrategia es tomar decisiones de compra y venta en combinación con la conversión aleatoria de Fisher y la suspensión temporal de la reversión del indicador STOCH. La estrategia es adecuada para operaciones a corto y medio plazo y puede obtener buenos rendimientos en condiciones estables.
Principio de estrategia
La estrategia calcula el índice STOCH estándar y luego realiza una conversión de Fisher para obtener INVLine. Cuando se cruza la línea de umbral de descenso dl en INVLine, se genera una señal de compra; cuando se cruza la línea de umbral de descenso ul en INVLine, se genera una señal de venta. La estrategia también establece un mecanismo de seguimiento de stop loss para bloquear ganancias y reducir las pérdidas.
En concreto, la lógica central de la estrategia es la siguiente:
- Calcular el índice de STOCH: Utiliza la fórmula estándar para calcular el valor de STOCH rápido de la acción
- Transformación de Fisher: realiza una transformación de Fisher al valor de STOCH para obtener INVLine
- Genera una señal de transacción: compra en la línea INVLine al atravesar la línea dl y vende en la línea UL
- Detener el seguimiento: activa el mecanismo de suspensión temporal del seguimiento para detener el seguimiento a tiempo
Análisis de las ventajas
Las principales ventajas de esta estrategia son:
- La transformación de Fisher mejora la sensibilidad del indicador STOCH, lo que permite detectar oportunidades de reversión de la tendencia antes
- El mecanismo de suspensión de seguimiento permite controlar el riesgo y bloquear las ganancias.
- Adecuado para operaciones a corto y medio plazo, especialmente las transacciones rápidas y cuantitativas que han sido más populares recientemente.
- En un entorno de estabilidad, el rendimiento es bueno y los ingresos estables.
Análisis de riesgos
La estrategia también tiene sus riesgos:
- Los índices STOCH son propensos a generar falsas señales que pueden conducir a transacciones innecesarias
- La transformación de Fisher también amplifica el ruido del índice STOCH, lo que trae más señales falsas
- En situaciones de crisis, es fácil detenerse y retirarse, pero no es posible obtener ganancias permanentes.
- Se requiere un período de tenencia más corto para obtener Alpha, no es adecuado para una tenencia demasiado larga
Para reducir estos riesgos, se puede considerar la optimización de los siguientes aspectos:
- Ajuste de los parámetros de STOCH para suavizar la curva y reducir el ruido
- Optimización de la posición de los umbrales para reducir la probabilidad de transacciones erróneas
- Aumentar las condiciones de filtración para evitar el comercio en situaciones de crisis
- Ajuste la duración de la posición para que coincida con el ciclo operativo
Dirección de optimización
Esta estrategia puede optimizarse principalmente en las siguientes direcciones:
- Optimización de los parámetros de la transformación de Fisher para suavizar la curva INVLine
- Optimización de la longitud del período del indicador STOCH para encontrar la mejor combinación de parámetros
- Optimización de los parámetros de la línea de pérdida para reducir la probabilidad de transacciones erróneas
- Aumentar la confirmación de la cantidad y evitar pérdidas innecesarias de seguimiento
- Aumentar el filtro de penetración diaria y reducir las falsas señales de mercado
- Combinación de indicadores de tendencia para evitar el comercio en contra
Resumir
Esta estrategia combina la aplicación de la variación aleatoria de Fisher y el indicador STOCH para lograr una estrategia de cuantificación de líneas cortas sencilla y práctica. Su ventaja es que tiene una alta frecuencia de operación, adecuada para las operaciones de cuantificación de alta frecuencia que se han popularizado recientemente. Al mismo tiempo, la estrategia también presenta algunos riesgos generales de la estrategia de indicadores técnicos, que requieren optimización de los parámetros y las condiciones de filtración para reducir el riesgo y mejorar la estabilidad.
/*backtest
start: 2022-12-26 00:00:00
end: 2024-01-01 00:00:00
period: 1d
basePeriod: 1h
exchanges: [{"eid":"Futures_Binance","currency":"BTC_USDT"}]
*/

//@version=3
strategy("IFT Stochastic + Trailing Stop", overlay=false, pyramiding = 0, calc_on_order_fills = false, commission_type =  strategy.commission.percent, commission_value = 0.0454, default_qty_type = strategy.percent_of_equity, default_qty_value = 100)

//INPUTS
stochlength=input(19, "STOCH Length")
wmalength=input(4, title="Smooth")
ul = input(0.64,step=0.01, title="UP line")
dl = input(-0.62,step=0.01, title="DOWN line")
uts = input(true, title="Use trailing stop")
tsi = input(title="trailing stop actiation pips",defval=245)
tso = input(title="trailing stop offset pips",defval=20)

//CALCULATIONS
v1=0.1*(stoch(close, high, low, stochlength)-50)
v2=wma(v1, wmalength)
INVLine=(exp(2*v2)-1)/(exp(2*v2)+1)

//CONDITIONS
sell = crossunder(INVLine,ul)? 1 : 0
buy = crossover(INVLine,dl)? 1 : 0

//PLOTS
plot(INVLine, color=aqua, linewidth=1, title="STOCH")
hline(ul, color=red)
hline(dl, color=green)
bgcolor(sell==1? red : na, transp=30, title = "sell signal")
bgcolor(buy==1? lime : na, transp=30, title = "buy signal")
plotchar(buy==1, title="Buy Signal", char='B', location=location.bottom, color=white, transp=0, offset=0)
plotchar(sell==1, title="Sell Signal", char='S', location=location.top, color=white, transp=0, offset=0)

//STRATEGY
strategy.entry("BUY", strategy.long, when = buy==1)
strategy.entry("SELL", strategy.short, when = sell==1)

if  (uts)
    strategy.entry("BUY", strategy.long, when = buy)
    strategy.entry("SELL", strategy.short, when = sell)
    strategy.exit("Close BUY with TS","BUY", trail_points = tsi, trail_offset = tso)
    strategy.exit("Close SELL with TS","SELL", trail_points = tsi, trail_offset = tso)