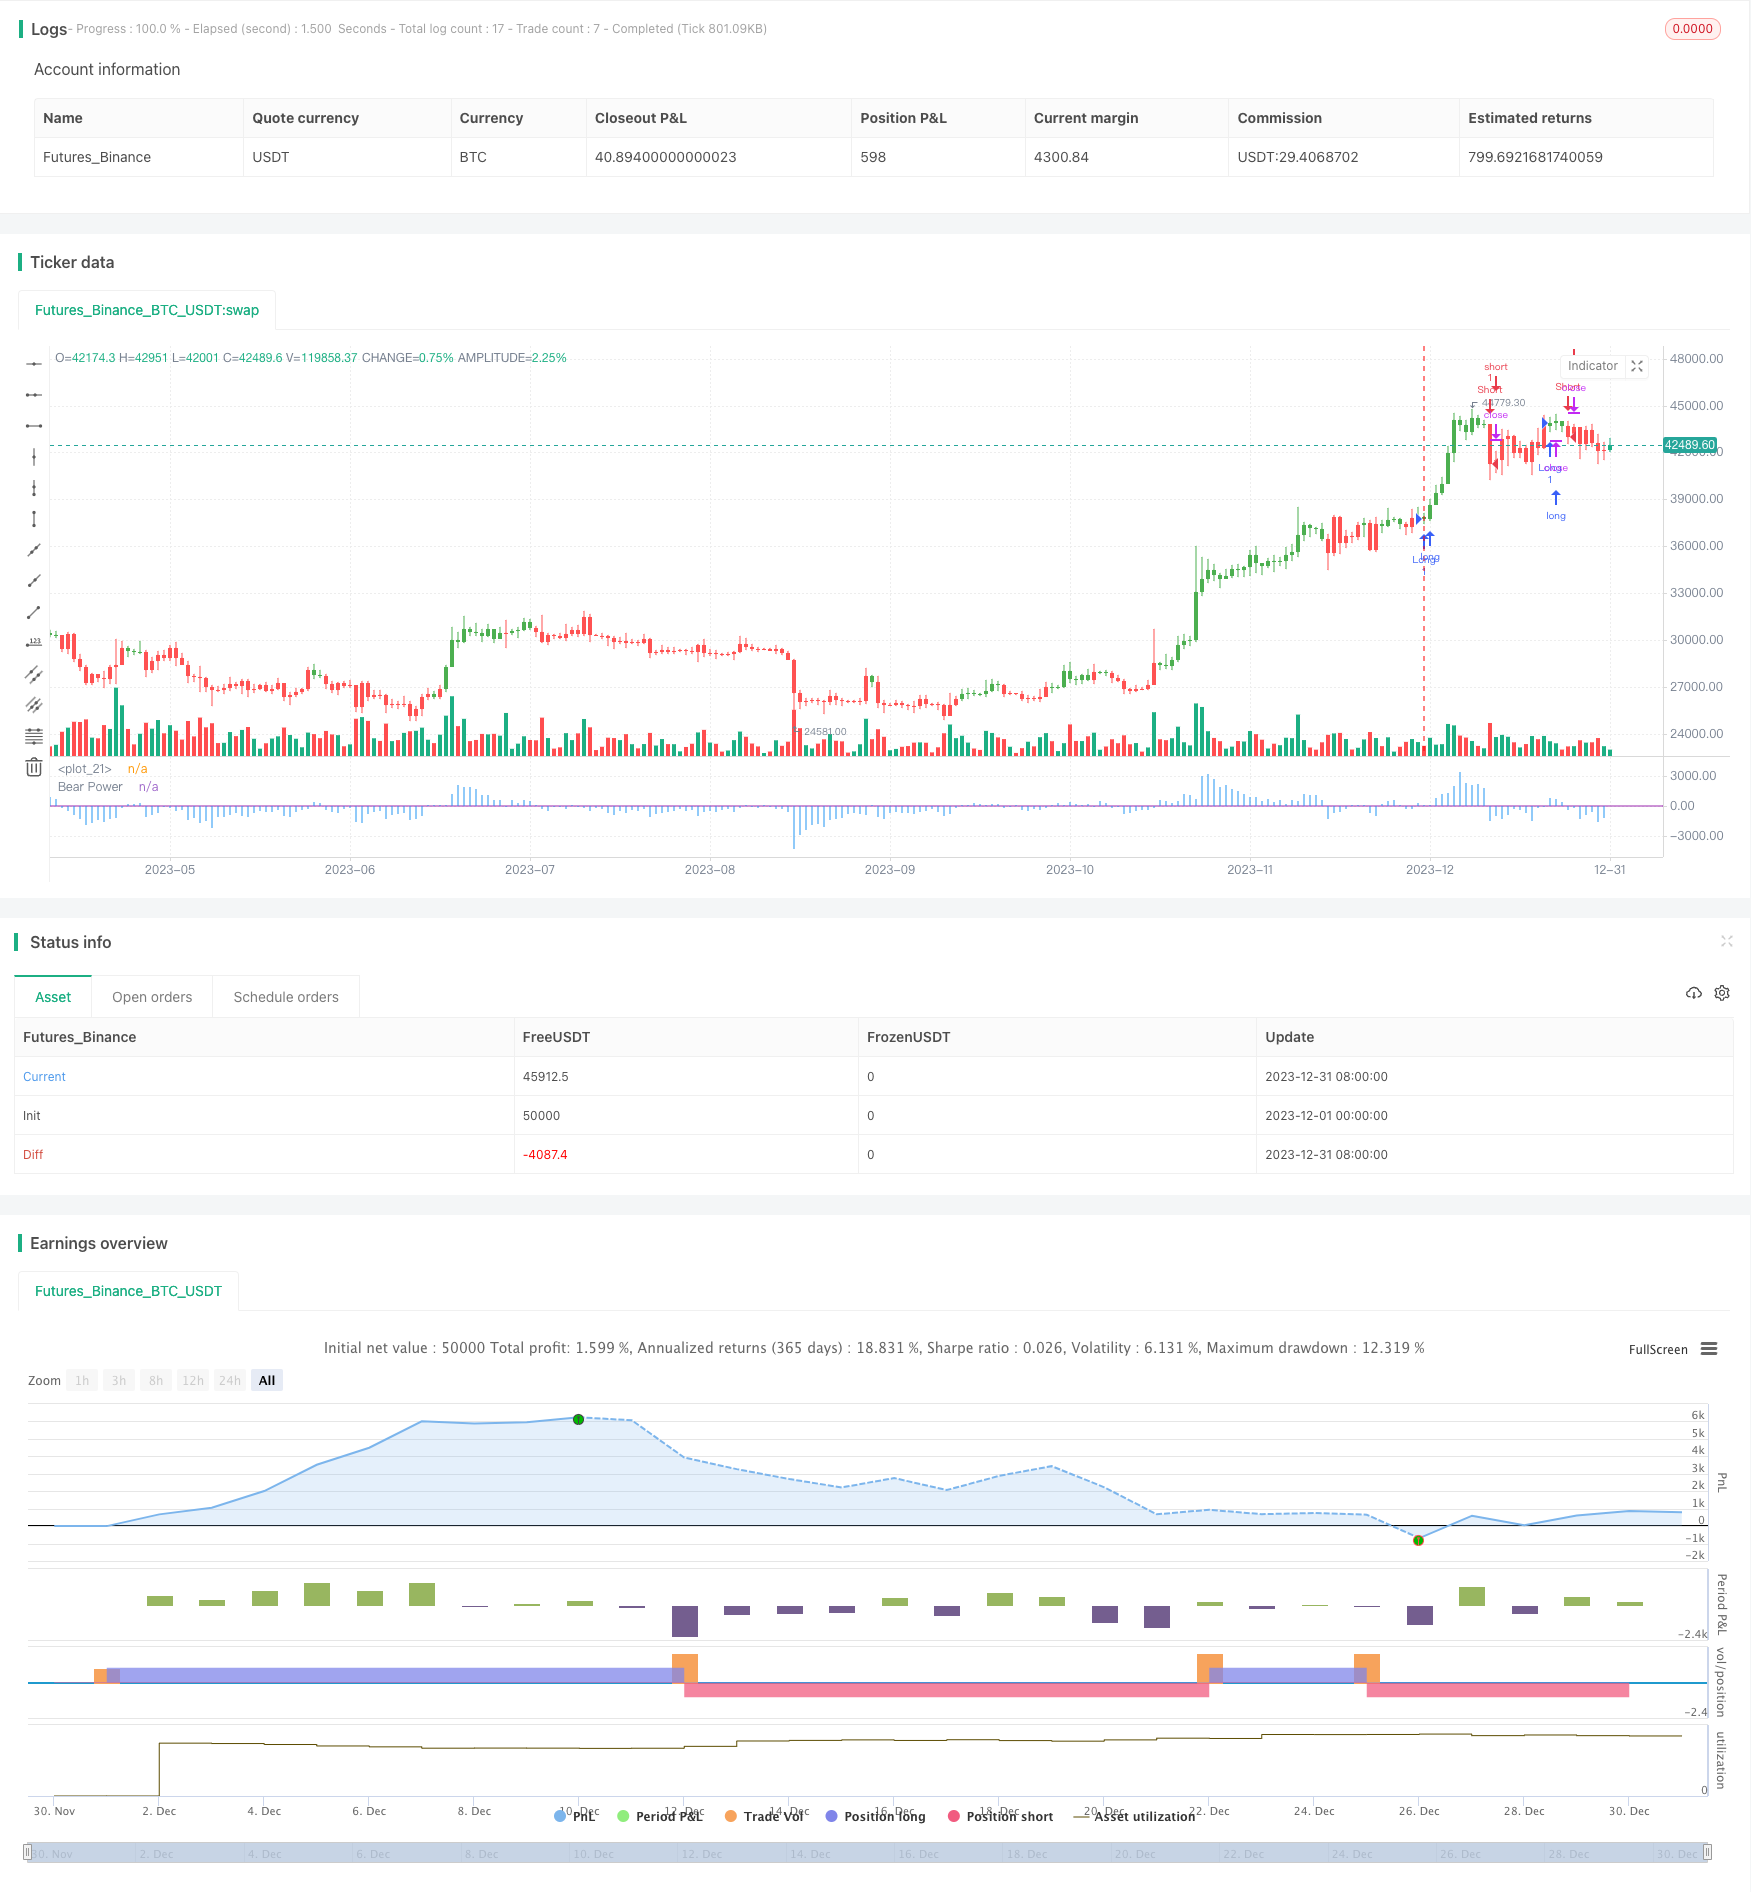
Estrategia de seguimiento de indicadores de estrés

Descripción general
La estrategia de seguimiento de los indicadores de resistencia se basa en el indicador de Elder Ray del Dr. Alexander Elder, para medir la presión de compra y venta en el mercado. La estrategia utiliza un promedio móvil de 13 días para representar el consenso sobre el valor del mercado, y usa el indicador de resistencia para medir la capacidad del vendedor de bajar el precio al valor del consenso.
Principio de estrategia
El indicador central de la estrategia es el indicador de resistencia, que se calcula a partir del precio mínimo del día menos el promedio móvil del índice de 13 días. Cuando el indicador de resistencia está sobre el umbral especificado, se hace más y cuando está bajo se hace menos. Refleja la capacidad del vendedor de presionar el precio por debajo del valor consensuado promedio.
Además, la dirección multivariable también se puede cambiar mediante el intercambio de parámetros de inversión de parámetros. Si el parámetro es de tipo Bull, es Falso por defecto. Cuando es de tipo True, se realiza una operación inversa al emitir la señal.
La estrategia es sencilla, práctica, y fácil de implementar a través de un indicador para juzgar la dirección de la pluralidad de espacios.
Análisis de las ventajas
La estrategia tiene las siguientes ventajas:
- El uso de un solo indicador para lograr una simplicidad, fácil comprensión y aplicación
- Parámetros de ajuste flexible para diferentes entornos de mercado
- Opciones de inversión y tipos de estrategias enriquecidas
Análisis de riesgos
La estrategia también tiene sus riesgos:
- Un solo indicador puede generar falsas señales
- No se consideró el cierre de pérdidas, lo que podría causar grandes pérdidas
- Los parámetros incorrectos pueden causar transacciones demasiado frecuentes
Se puede optimizar aún más mediante la confirmación de múltiples indicadores, la configuración de stop loss, el ajuste de parámetros, etc.
Dirección de optimización
La estrategia puede ser optimizada en varias direcciones:
- Añadir otros indicadores de filtración de señales, como MACD, KDJ, etc., para evitar falsas brechas
- Adición de stop móvil para limitar las pérdidas
- Optimización de los parámetros del indicador para ajustar los puntos de entrada y salida
- Se puede considerar combinar el fundamento de las acciones con la opción de compra de acciones
- Se puede utilizar en combinación con otras estrategias
Resumir
El concepto de la estrategia de seguimiento de indicadores bajo presión es simple, es fácil de operar y se puede determinar la entrada y la salida mediante la comparación de un solo indicador y el umbral especificado. Sin embargo, como estrategia basada en indicadores, el espacio para la optimización es grande, se puede optimizar de manera integral desde indicadores, stop loss, selección de acciones, etc., lo que hace que la estrategia sea más estable y confiable.
/*backtest
start: 2023-12-01 00:00:00
end: 2023-12-31 23:59:59
period: 1d
basePeriod: 1h
exchanges: [{"eid":"Futures_Binance","currency":"BTC_USDT"}]
*/

//@version = 2
////////////////////////////////////////////////////////////
//  Copyright by HPotter v1.0 07/12/2016
// Developed by Dr Alexander Elder, the Elder-ray indicator measures buying
// and selling pressure in the market. The Elder-ray is often used as part
// of the Triple Screen trading system but may also be used on its own.
// Dr Elder uses a 13-day exponential moving average (EMA) to indicate the
// market consensus of value. Bear Power measures the ability of sellers to
// drive prices below the consensus of value. Bear Power reflects the ability
// of sellers to drive prices below the average consensus of value.
// Bull Power is calculated by subtracting the 13-day EMA from the day's High.
// Bear power subtracts the 13-day EMA from the day's Low.
// You can use in the xPrice any series: Open, High, Low, Close, HL2, HLC3, OHLC4 and ect...
// You can change long to short in the Input Settings
// Please, use it only for learning or paper trading. Do not for real trading.
////////////////////////////////////////////////////////////
strategy(title="Elder Ray (Bear Power) Strategy Backtest")
Length = input(13, minval=1)
Trigger = input(0)
reverse = input(false, title="Trade reverse")
hline(0, color=purple, linestyle=line)
xPrice = close
xMA = ema(xPrice,Length)
DayLow = iff(dayofmonth != dayofmonth[1], low, min(low, nz(DayLow[1])))
nRes = DayLow - xMA
pos = iff(nRes > Trigger, 1,
	   iff(nRes < Trigger, -1, nz(pos[1], 0)))
possig = iff(reverse and pos == 1, -1,
         iff(reverse and pos == -1, 1, pos))
if (possig == 1)
    strategy.entry("Long", strategy.long)
if (possig == -1)
    strategy.entry("Short", strategy.short)
barcolor(possig == -1 ? red: possig == 1 ? green : blue )
plot(nRes, color=blue, title="Bear Power", style = histogram)