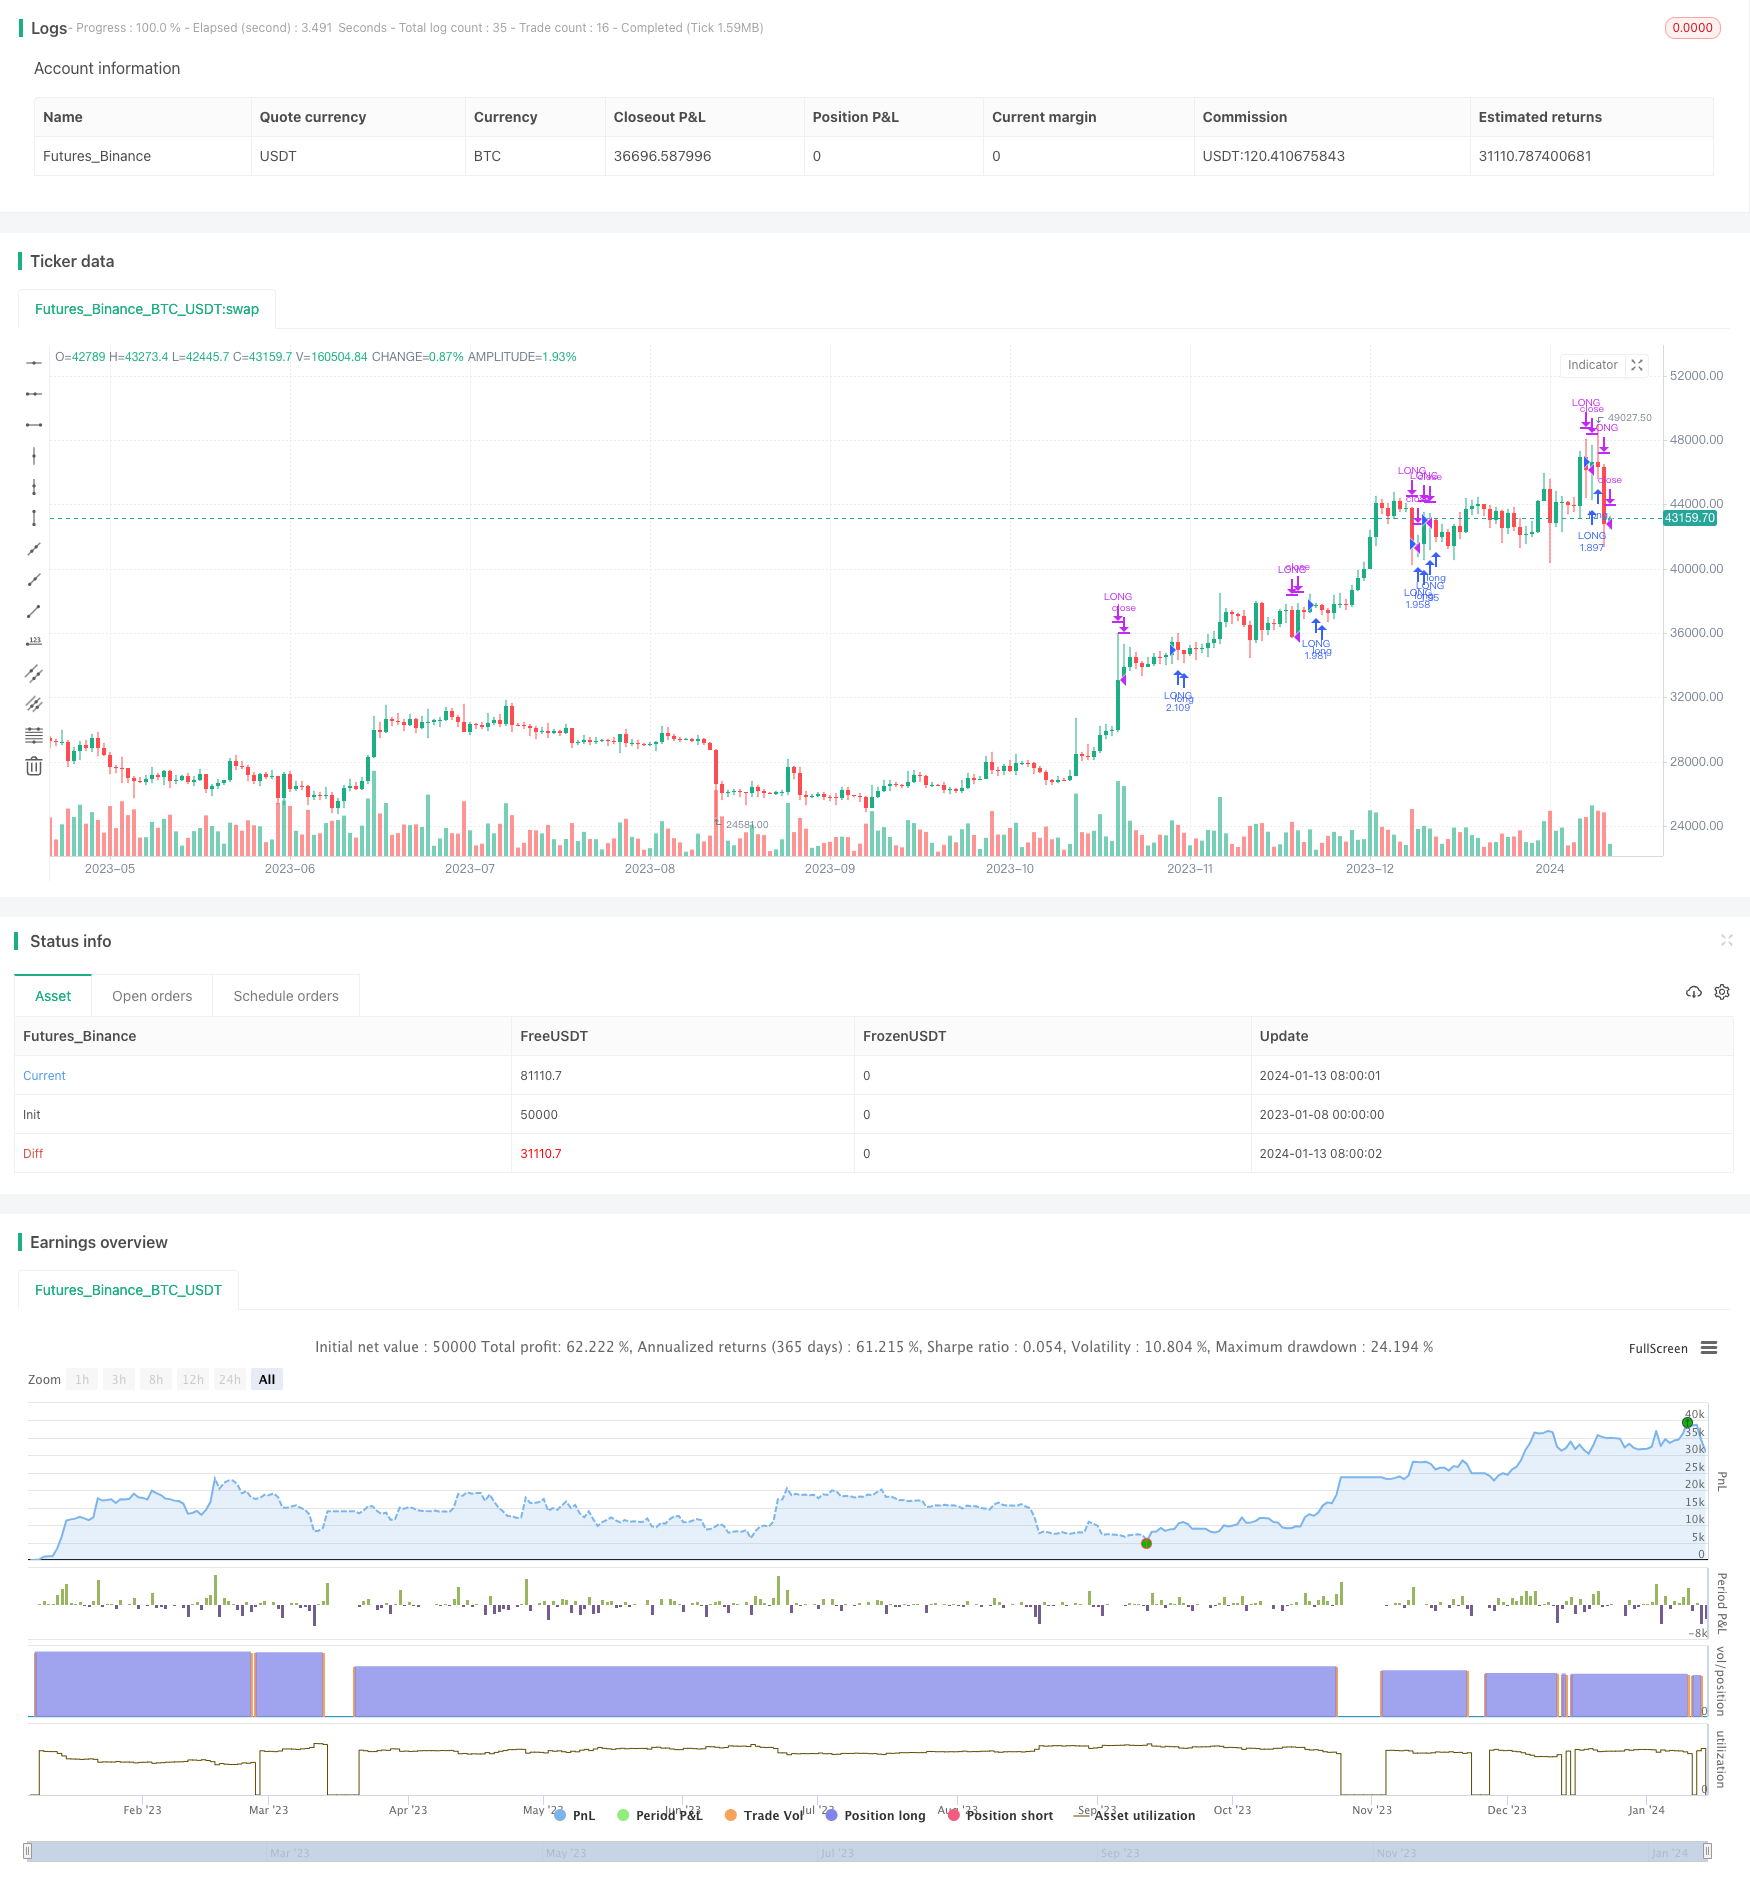
Estrategia de tiempo de mercado filtrada por volatilidad
El autor:¿ Qué pasa?, Fecha: 15 de enero de 2024 12: 27:47Las etiquetas:

Resumen general
Esta estrategia implementa una estrategia mejorada de compra y retención mediante la adición de un filtro basado en la volatilidad histórica.
Estrategia lógica
- Calcular la volatilidad histórica de SPY durante los últimos 100 días
- Si la volatilidad actual es superior al percentil 95 de la volatilidad de los últimos 100 días, filtrar ese día de negociación, cerrar la posición larga
- Si la volatilidad está por debajo del 95o percentil, introducir una posición larga
Análisis de ventajas
En comparación con la simple compra y retención sin filtro, esta estrategia mejoró los rendimientos anualizados durante el período de prueba posterior de 28 años (7,95% frente a 9,92%) y redujo significativamente el desembolso máximo (50,79% frente a 31,57%).
Análisis de riesgos
Los principales riesgos provienen de la precisión de la metodología de cálculo de volatilidad y el ajuste de parámetros del filtro. Si el cálculo de volatilidad es inexacto, el filtro fallará. Si los parámetros del filtro están mal ajustados (demasiado conservadores o agresivos), puede afectar negativamente los retornos de la estrategia. Además, el rendimiento pasado no garantiza resultados futuros.
Direcciones de optimización
Considere agregar otros indicadores de confirmación como filtros adicionales, como promedio móvil a largo plazo, índice ADX, etc. El ajuste de parámetros también es crítico, como probar diferentes períodos de retroceso, filtrar umbrales, etc. También se pueden usar técnicas de aprendizaje automático y análisis de series de tiempo para construir y optimizar el modelo de predicción de volatilidad.
Resumen de las actividades
Esta estrategia mejoró en gran medida los rendimientos y redujo la extracción máxima de una estrategia de compra y retención de SPY a través de un sencillo filtro de volatilidad. Muestra la importancia de la identificación del régimen de mercado y la asignación de activos. Podemos refinarlo aún más optimizando el modelo de volatilidad y agregando señales de confirmación.
/*backtest
start: 2023-01-08 00:00:00
end: 2024-01-14 00:00:00
period: 1d
basePeriod: 1h
exchanges: [{"eid":"Futures_Binance","currency":"BTC_USDT"}]
*/

// This source code is subject to the terms of the Mozilla Public License 2.0 at https://mozilla.org/MPL/2.0/
//
// @author Sunil Halai
//
// This script has been created to demonstrate the effectiveness of using market regime filters in your trading strategy, and how they can improve your returns and lower your drawdowns
//
// This strategy adds a simple filter (The historical volatility filter, which can be found on my trading profile) to a traditional buy and hold strategy of the index SPY. There are other filters
// that could also be added included a long term moving average / percentile rank filter / ADX filter etc, to improve the returns further.
//
// The filter added closes our long position during periods of volatility that exceed the 95th percentile (or in the top 5% of volatile days)
//
// Have included the back test results since 1993 which is 28 years of data at the time of writing,  Comparing  buy and hold of the SPY (S&P 500), to improved by and hold offered here.
//
// Traditional buy and hold:
//
// Return per year:     7.95   % (ex Dividends)
// Total return :       851.1  %
// Max drawdown:        50.79  %
//
// 'Modified' buy and hold (this script):
//
// Return per year:     9.92    % (ex Dividends)
// Total return:        1412.16 %
// Max drawdown:        31.57   %
//
// Feel free to use some of the market filters in my trading profile to improve and refine your strategies further, or make a copy and play around with the code yourself. This is just
// a simple example for demo purposes.
//

//@version=4
strategy(title = "Simple way to beat the market [STRATEGY]", shorttitle = "Beat The Market [STRATEGY]", overlay=true, initial_capital=100000, default_qty_type=strategy.percent_of_equity, currency="USD", default_qty_value=100)


upperExtreme = input(title = "Upper percentile filter (Do not trade above this number)", type = input.integer, defval = 95)
lookbackPeriod = input(title = "Lookback period", type = input.integer, defval = 100)

annual = 365
per = timeframe.isintraday or timeframe.isdaily and timeframe.multiplier == 1 ? 1 : 7
hv = lookbackPeriod * stdev(log(close / close[1]), 10) * sqrt(annual / per)

filtered = hv >= percentile_nearest_rank(hv, 100, upperExtreme)

if(not(filtered))
    strategy.entry("LONG", strategy.long)
else
    strategy.close("LONG")
- Tendencia de adaptación tras la estrategia
- Estrategia de los indicadores de rentabilidad de múltiples plazos
- Las bandas de Bollinger y la estrategia combinada de la línea K
- Estrategia de negociación de acciones basada en el oscilador de Aroon
- EintSimple estrategia de retroceso
- Estrategia de negociación de eficiencia fractal polarizada (PFE)
- Unos once promedios móviles estrategia cruzada
- Estrategia de negociación de inversión de media móvil doble
- RSI de la estrategia de inversión del MACD
- Estrategia de negociación de Bitcoin basada en la fase lunar
- Tendencia siguiendo la estrategia de ruptura del canal con media móvil y parada de seguimiento
- Estrategia de doble indicador de negociación cuantitativa
- Estrategia de negociación de media móvil bidireccional de reversión
- RSI Estrategia de negociación de la divergencia alcista y bajista
- Estrategia de la bala de plata basada en el escape de la caja
- Seguimiento de la estrategia de tendencia basada en indicadores de doble EMA y CA
- Estrategia de tendencia de la EMA para la ruptura de la volatilidad con retraso cero
- Estrategia sólida de seguimiento de tendencias
- Estrategia de promedio móvil de ruptura en espiral
- Estrategia de negociación cuantitativa basada en el indicador de supertendencia y la negociación de curvas de renta variable