概述
本策略的核心思路是结合超趋势指标与净值曲线交易,当超趋势指标发出买入或卖出信号时,我们并不直接执行交易,而是判断当前的净值曲线是否低于其移动平均线。只有当净值曲线高于移动平均线时,我们才会打开仓位。当净值曲线低于移动平均线时,我们会暂停当前策略的交易。这样可以有效防止亏损的扩大。
策略原理
本策略主要由两部分组成:
- 超趋势指标
- 净值曲线交易
超趋势指标的计算公式如下:
上轨 = 源价 - ATR乘数 * ATR 下轨 = 源价 + ATR乘数 * ATR
其中,ATR表示平均真实波幅。超趋势指标利用ATR来设置上下轨,当价格突破上轨时为卖出信号,当价格突破下轨时为买入信号。
净值曲线交易的思想是,我们对策略净值曲线进行移动平均,当净值曲线低于移动平均线时,暂停当前策略的交易,等待净值曲线回升超过移动平均线后再次开启交易。
本策略将两者结合,超趋势指标产生交易信号后,我们不直接交易,而是判断当前净值曲线是否高于移动平均线。只有两者同时符合条件,我们才会打开仓位。这样可以有效规避超趋势指标本身的风险,防止亏损过大。
优势分析
本策略的主要优势有:
可以有效防止超趋势指标的风险。超趋势指标本身无法有效规避亏损,净值曲线交易可以弥补这一缺点。
当交易不利时,可以暂停策略的交易,避免亏损过大。等到市场转好可以再次开启。
可以自动管理仓位,不需要人工干预。当净值曲线低于移动平均线时自动暂停,高于时自动开启。
风险分析
本策略也存在一定的风险:
参数设置错误可能导致无法有效发挥净值曲线交易的效果。需要选择合适的移动平均线周期。
当行情趋势变化时,可能无法及时调整仓位。这会导致一定的亏损。
由于需要等待净值曲线回升,可能会错过较好的入场时机。
对策:
优化参数,选择最佳的移动平均线周期。
结合其他指标判断趋势,及时调整仓位。
适当缩短暂停交易的时间,降低错过入场的概率。
优化方向
本策略可以从以下几个方面进行优化:
测试不同的参数组合,找到最佳的ATR周期和ATR乘数。
尝试其他类型的移动平均线,如指数移动平均线、 Hull移动平均线等。
添加其他指标判断行情趋势,在趋势变化时及时调整仓位。
优化移动平均线周期,找到最佳平衡点。周期过长会错过机会,过短会频繁暂停。
优化暂停交易的条件,如设置止损线,只有亏损达到一定程度后才暂停。
总结
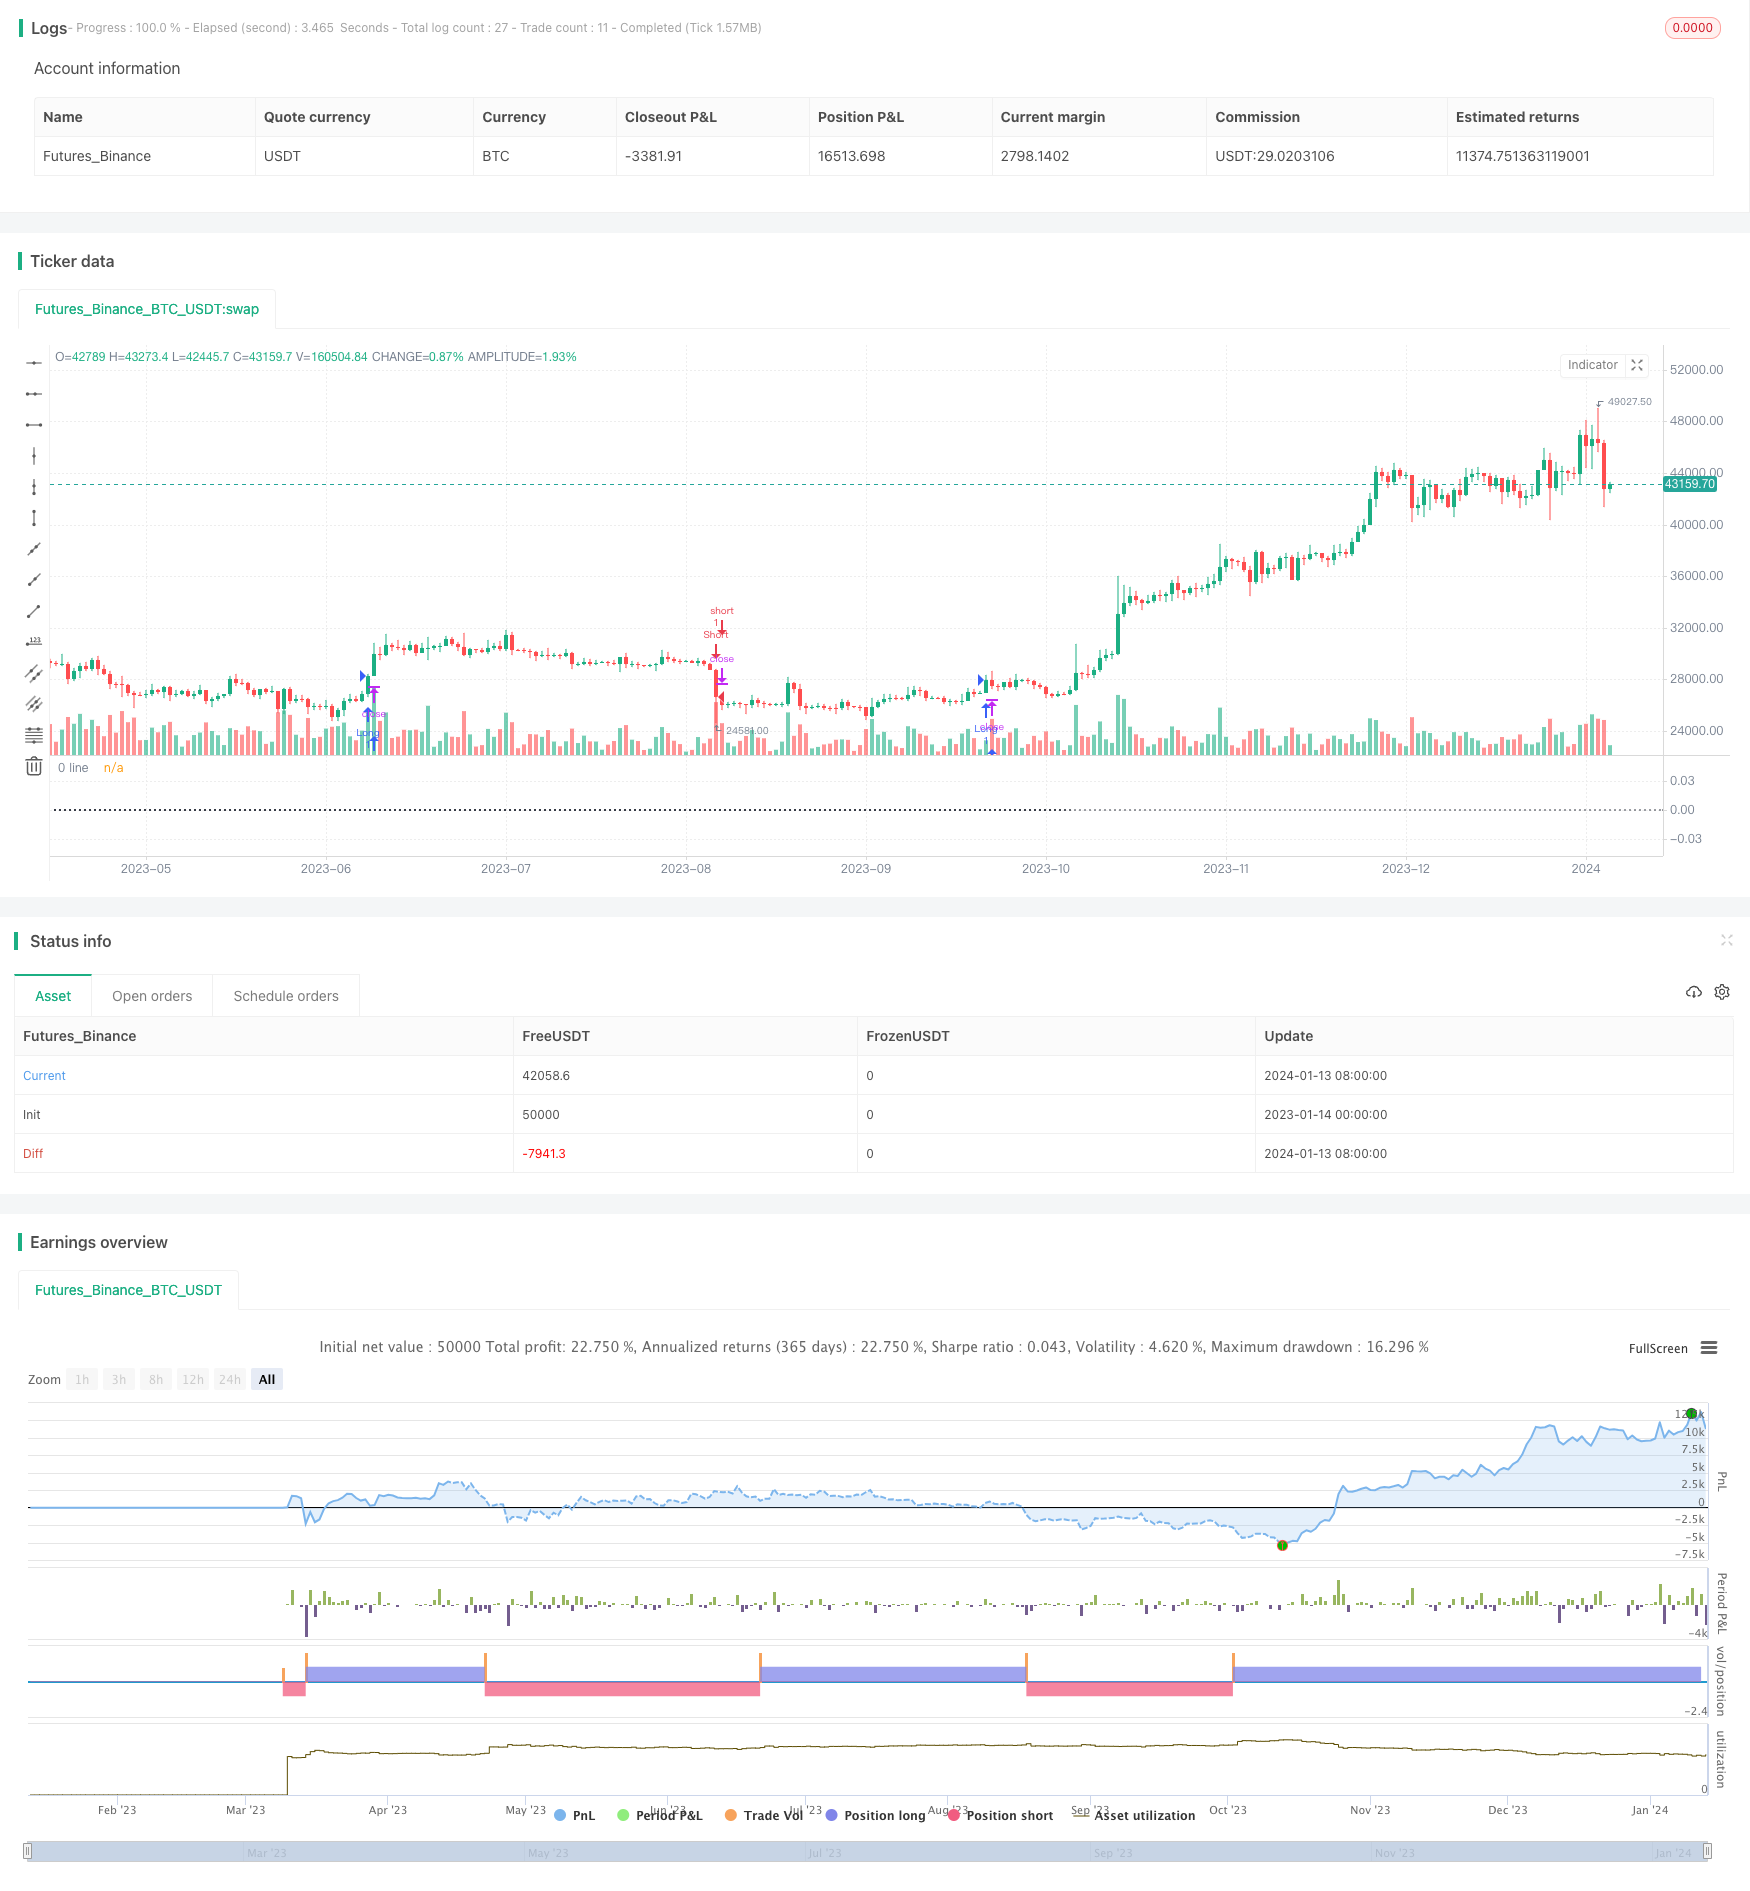
本策略巧妙地结合了超趋势指标和净值曲线交易。既保留了超趋势指标判断趋势的优点,又通过净值曲线交易有效控制了风险。测试结果表明,在大多数情况下,应用净值曲线交易都会降低盈利水平。所以本策略更适合防守型的交易者。通过参数优化和规则优化,本策略可以成为一个非常实用的量化交易策略。
/*backtest
start: 2023-01-14 00:00:00
end: 2024-01-14 00:00:00
period: 1d
basePeriod: 1h
exchanges: [{"eid":"Futures_Binance","currency":"BTC_USDT"}]
*/

//@version=5
strategy('Supertrend & Equity curve with EMA', overlay=false, format=format.price, precision=2, initial_capital=100000)

eqlen = input.int(25, "EQ EMA len", group = "New Equity Curve Settings")
shEQandMA = input.bool(true, "Show Original Equity Curve and MA")
shEQfilt = input.bool(true, "Show Filtered Equity Curve by MA")

Periods = input(title='ATR Period', defval=10, group = "SuperTrend Settings")
src = input(hl2, title='Source', group = "SuperTrend Settings")
Multiplier = input.float(title='ATR Multiplier', step=0.1, defval=3.0, group = "SuperTrend Settings")
changeATR = input(title='Change ATR Calculation Method ?', defval=true, group = "SuperTrend Settings")

//SuperTrend Code
atr2 = ta.sma(ta.tr, Periods)
atr = changeATR ? ta.atr(Periods) : atr2
up = src - Multiplier * atr
up1 = nz(up[1], up)
up := close[1] > up1 ? math.max(up, up1) : up
dn = src + Multiplier * atr
dn1 = nz(dn[1], dn)
dn := close[1] < dn1 ? math.min(dn, dn1) : dn
trend = 1
trend := nz(trend[1], trend)
trend := trend == -1 and close > dn1 ? 1 : trend == 1 and close < up1 ? -1 : trend

// Strategy main code
buySignal = trend == 1 and trend[1] == -1
sellSignal = trend == -1 and trend[1] == 1
if buySignal
    strategy.entry('Long', strategy.long)
if sellSignal
    strategy.entry('Short', strategy.short)


//Equity Curve calcs
eq = strategy.netprofit
ch = ta.change(eq)
neq = ch != 0 ? eq : na
mova = ta.ema(neq,eqlen)

// New Equity Curve
var float neweq = 0
var int ttrades = 0
var int wintrades = 0
var int losetrades = 0

switch
    strategy.netprofit == strategy.netprofit[1]  => na
    strategy.netprofit < mova and strategy.netprofit[1] > mova  => neweq := neweq + ch
    strategy.netprofit < mova and strategy.netprofit[1] < mova => na
    strategy.netprofit > mova and strategy.netprofit[1] > mova => neweq := neweq + ch

newch = ta.change(neweq)
switch
    newch == 0 => na
    newch > 0 =>
        wintrades := wintrades +1
        ttrades := ttrades +1
    newch < 0 =>
        losetrades := losetrades +1
        ttrades := ttrades +1

//plot(eq, linewidth = 2)
//plot(mova, color=color.red)
//plot(neweq, color= color.green, linewidth = 3)


//Table
var testTable = table.new(position = position.top_right, columns = 5, rows = 10, bgcolor = color.green, border_width = 1)
table.cell(table_id = testTable, column = 0, row = 0, text = "Strategy: ", bgcolor=color.white)
table.cell(table_id = testTable, column = 1, row = 0, text = "Original: ", bgcolor=color.white)
table.cell(table_id = testTable, column = 2, row = 0, text = "Equity Curve EMA: ", bgcolor=color.white)

table.cell(table_id = testTable, column = 0, row = 1, text = "Total Trades: ", bgcolor=color.white)
table.cell(table_id = testTable, column = 0, row = 2, text = "Win Trades: ", bgcolor=color.white)
table.cell(table_id = testTable, column = 0, row = 3, text = "Lose Trades: ", bgcolor=color.white)
table.cell(table_id = testTable, column = 0, row = 4, text = "Win Rate: ", bgcolor=color.white)
table.cell(table_id = testTable, column = 0, row = 5, text = "Net Profit: ", bgcolor=color.white)

//Equity Curve EMA stat
table.cell(table_id = testTable, column = 2, row = 1, text = str.tostring(ttrades), bgcolor=color.white)
table.cell(table_id = testTable, column = 2, row = 2, text = str.tostring(wintrades), bgcolor=color.white)
table.cell(table_id = testTable, column = 2, row = 3, text = str.tostring(losetrades), bgcolor=color.white)
table.cell(table_id = testTable, column = 2, row = 4, text = str.tostring(math.round(100*wintrades/ttrades,2)), bgcolor=color.white)
table.cell(table_id = testTable, column = 2, row = 5, text = str.tostring(math.round(neweq)), bgcolor=color.white)

//Original Strategy stat
// table.cell(table_id = testTable, column = 1, row = 1, text = str.tostring(strategy.closedtrades), bgcolor=color.white)
// table.cell(table_id = testTable, column = 1, row = 2, text = str.tostring(strategy.wintrades), bgcolor=color.white)
// table.cell(table_id = testTable, column = 1, row = 3, text = str.tostring(strategy.losstrades), bgcolor=color.white)
// table.cell(table_id = testTable, column = 1, row = 4, text = str.tostring(math.round(100*strategy.wintrades/strategy.closedtrades,2)), bgcolor=color.white)
// table.cell(table_id = testTable, column = 1, row = 5, text = str.tostring(math.round(strategy.netprofit)), bgcolor=color.white)


//New Equity curve
var newcurve = array.new_float(0)
var int ida = 0
var bool printEQ = false
if newch !=0
    array.push(newcurve, neweq)
if bar_index > last_bar_index - array.size(newcurve) - 1 - 20  and array.size(newcurve) > 20
    printEQ := true
else
    printEQ := false

plot(printEQ and ida < strategy.closedtrades and shEQfilt ? array.get(newcurve, ida) : na, color=color.green, linewidth = 2)

if printEQ
    ida := ida + 1
if ida >= array.size(newcurve) and printEQ
    ida := array.size(newcurve) -1


//Original Equity curve
var newcurve2 = array.new_float(0)
var int ida2 = 0
var bool printEQ2 = false
if ch !=0
    array.push(newcurve2, eq)
if bar_index > last_bar_index - array.size(newcurve2) - 1 - 20  and array.size(newcurve2) > 20
    printEQ2 := true
else
    printEQ2 := false

plot(printEQ2 and ida2 < strategy.closedtrades and shEQandMA  ? array.get(newcurve2, ida2) : na, color=color.blue, linewidth = 2)

if printEQ2
    ida2 := ida2 + 1
if ida2 >= array.size(newcurve2) and printEQ2
    ida2 := array.size(newcurve2) -1


//Moving Average Array
var marray = array.new_float(0)
if ch
    array.push(marray, mova)

plot(printEQ2 and  array.size(marray) > 40 and shEQandMA ? array.get(marray, ida2-1) : na, color=color.red, linewidth = 1)

hline(0,"0 line", color=color.black, linestyle = hline.style_dotted)


if (last_bar_index-1) and array.size(newcurve2) > 20 and array.size(newcurve) > 20
    l = label.new(bar_index+2, array.get(newcurve2, array.size(newcurve2)-1), "Original Equity Curve", color=color.rgb(33, 149, 243, 85), textcolor = color.black, style = label.style_label_left)
    label.delete(l[1])
    f = label.new(bar_index+2, array.get(newcurve, array.size(newcurve)-1), "Filtered Equity Curve", color=color.rgb(69, 238, 97, 85), textcolor = color.black, style = label.style_label_left)
    label.delete(f[1])