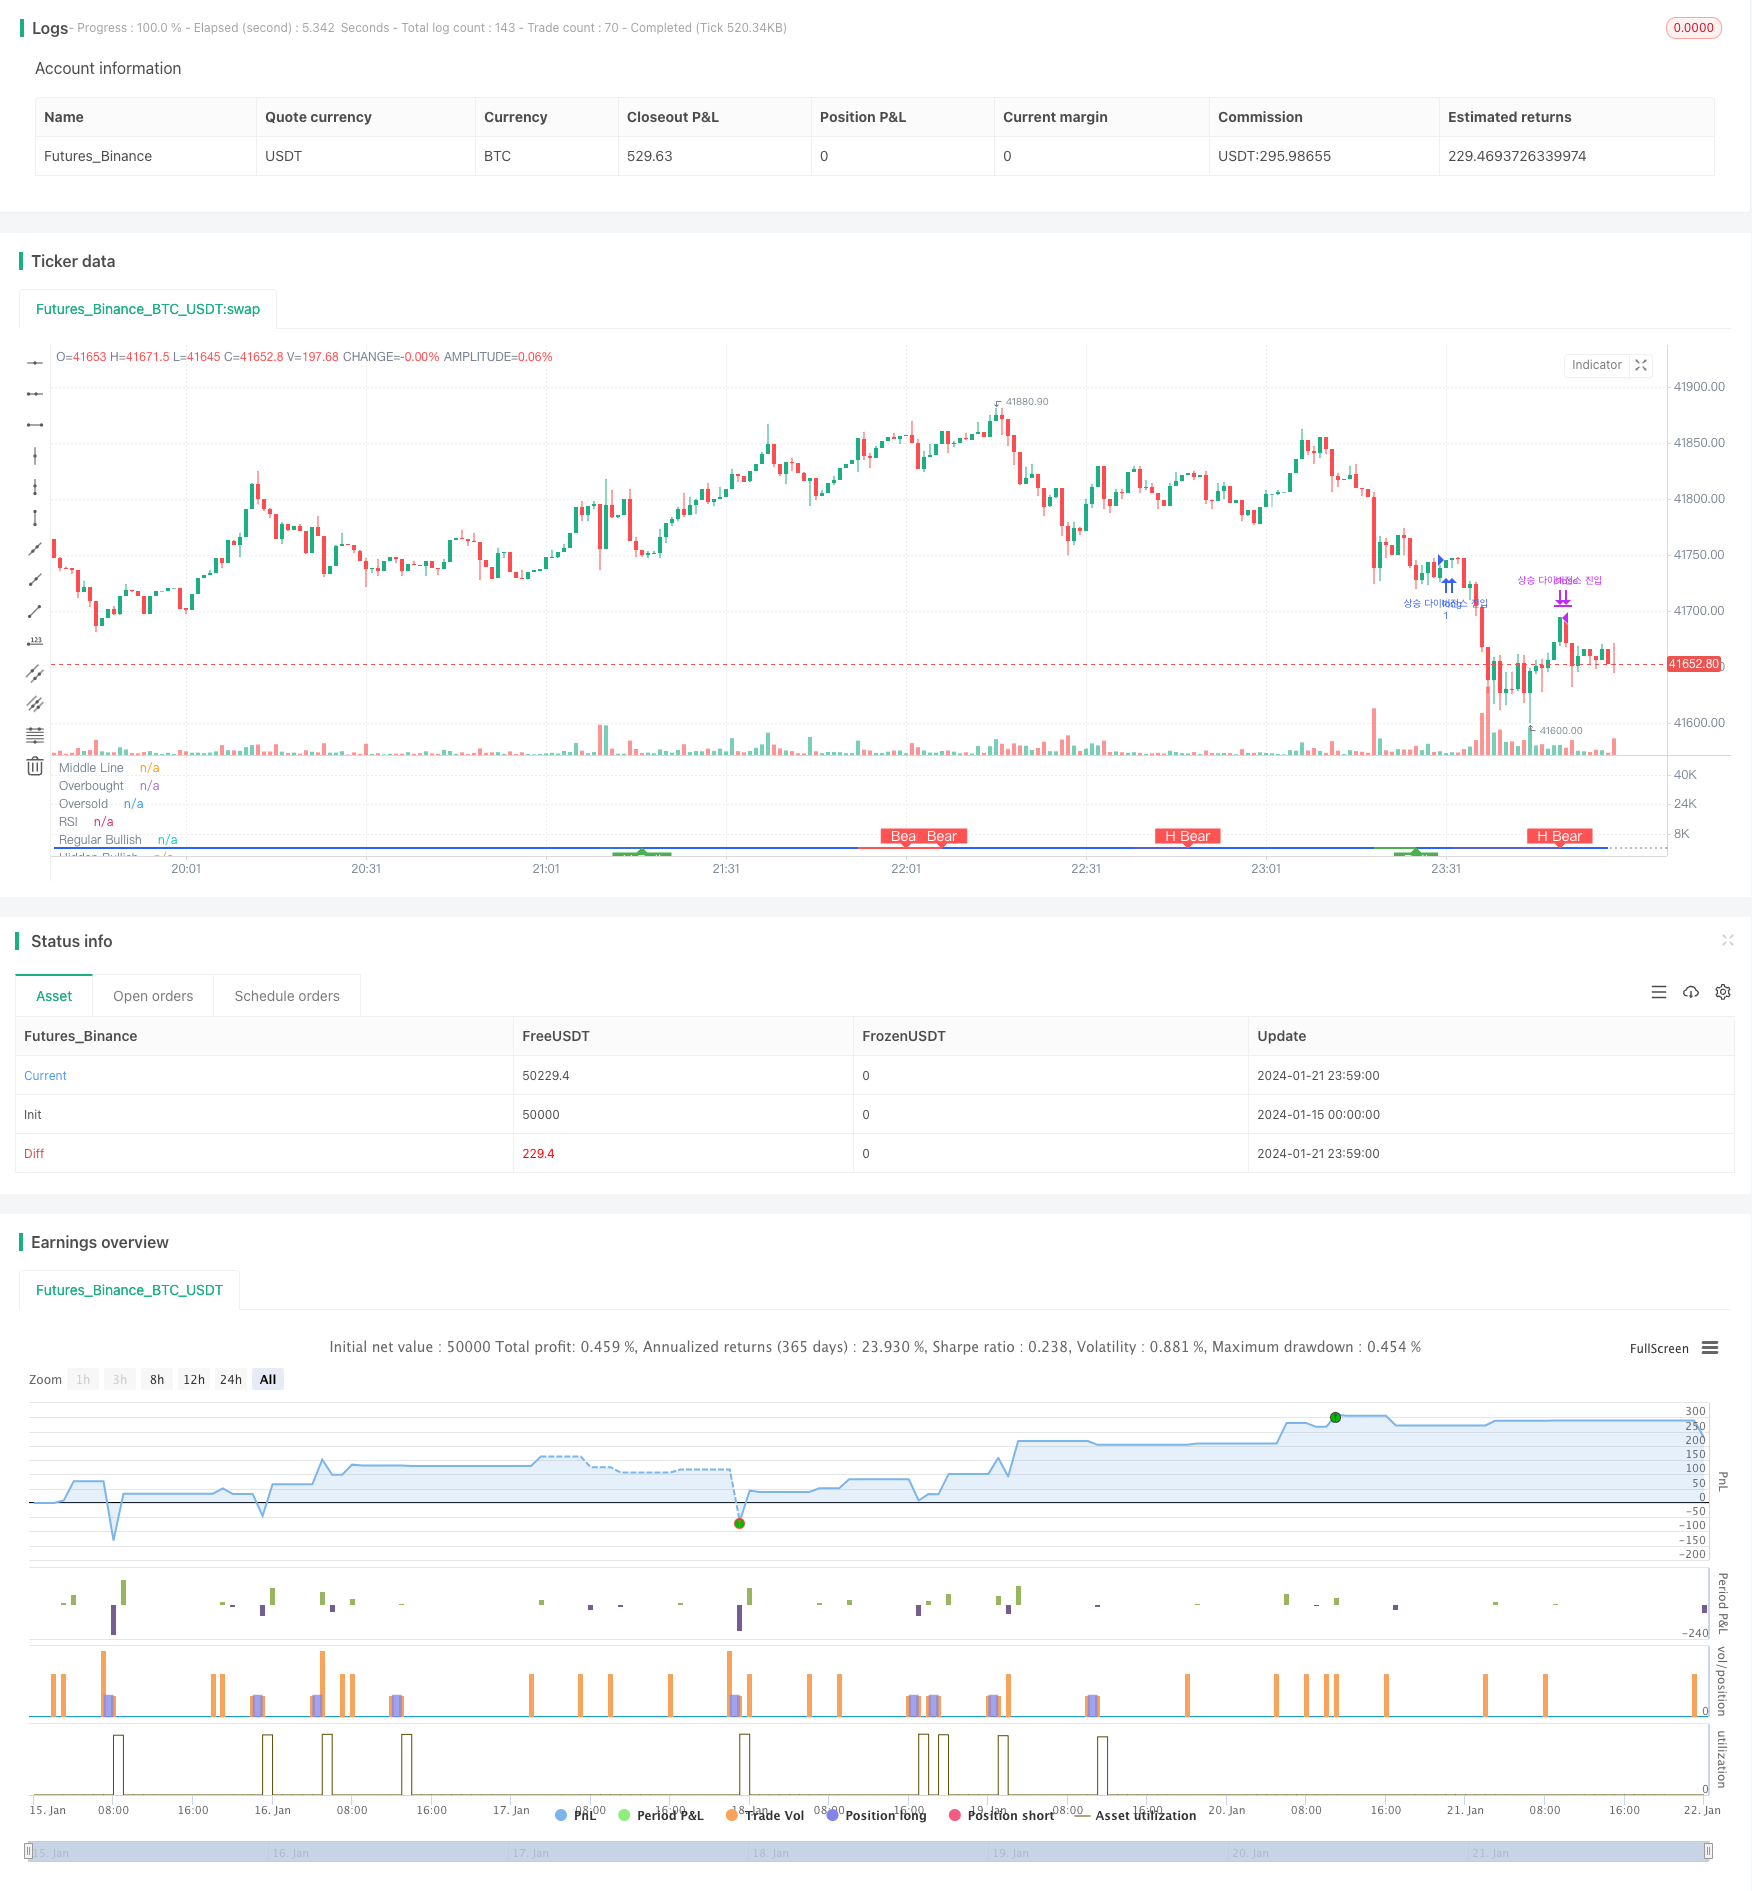
Estrategia de trading con divergencia RSI

Descripción general
La estrategia de negociación de la divergencia del indicador RSI consiste en analizar la divergencia del indicador RSI con el precio y descubrir oportunidades de divergencia de valor, haciendo más shorting cuando se produce la divergencia.
Principio de estrategia
La estrategia se basa en la diferencia de valor entre el indicador RSI y el precio cuando se produce una desviación. El indicador RSI refleja una fuerte debilidad y el precio refleja una relación de oferta y demanda. Cuando las dos se producen, indica que el mercado tiene un precio erróneo y se puede comprar a la baja o vender más para obtener ganancias.
Concretamente, la divergencia habitual de múltiples vertientes es que el RSI forma más altos y bajos, mientras que los precios forman más bajos y bajos. Esto significa que el mercado, aunque sea superficialmente bajista, en realidad ya tiene signos de rebote acumulativo.
La divergencia de cabeza vacía habitual es el contrario, el RSI forma un punto alto más bajo y el precio forma un punto alto más alto. Esto indica que el mercado es superficialmente optimista, pero en realidad ya muestra signos de debilidad interna. Cuando el RSI se desvía del precio y rompe la línea divisoria de 50 hacia abajo, se puede obtener una ganancia por descubierto.
Además, también hay discrepancias ocultas de múltiples cabezas y discrepancias de cabezas vacías. En este caso, la relación entre el RSI y el precio es lo opuesto a la discrepancia convencional, pero el principio es el mismo y también se puede obtener ganancias.
Ventajas estratégicas
- Capturando las diferencias de valor y descubriendo los errores de precio en el mercado
- La combinación de indicadores y desviación de precios mejora las probabilidades de ganar
- Distinguir las diferencias y cubrir más oportunidades
Análisis de riesgos
- Las diferencias de opinión también pueden surgir en situaciones especiales de mercado y necesitan ser identificadas.
- La brecha de la línea divisoria de 50 no es muy alta y se puede optimizar adecuadamente.
- El error en la elección de la dirección de un espacio múltiple puede causar grandes pérdidas.
Dirección de optimización
- Optimización de los parámetros del RSI para mejorar la precisión de la predicción del indicador
- En combinación con otros indicadores, las señales de juicio se alejan de la discordia.
- Evaluación de la relación entre el riesgo y la ganancia de hacer más deuda pública y controlar las pérdidas y ganancias individuales
Resumir
La estrategia de discrepancia del indicador RSI es una estrategia de arbitraje estadístico típica, que analiza el alejamiento entre el valor y el precio y descubre el precio de error del mercado. La ventaja de esta estrategia reside en la detección oportuna de oportunidades de inversión de tendencia, el riesgo reside en la precisión de la identificación de la discrepancia.
/*backtest
start: 2024-01-15 00:00:00
end: 2024-01-22 00:00:00
period: 1m
basePeriod: 1m
exchanges: [{"eid":"Futures_Binance","currency":"BTC_USDT"}]
*/

//@version=5
strategy(title="Divergence Indicator")
len = input.int(title="RSI Period", minval=1, defval=14)
src = input(title="RSI Source", defval=close)
lbR = input(title="Pivot Lookback Right", defval=5)
lbL = input(title="Pivot Lookback Left", defval=5)
rangeUpper = input(title="Max of Lookback Range", defval=60)
rangeLower = input(title="Min of Lookback Range", defval=5)
plotBull = input(title="Plot Bullish", defval=true)
plotHiddenBull = input(title="Plot Hidden Bullish", defval=true)
plotBear = input(title="Plot Bearish", defval=true)
plotHiddenBear = input(title="Plot Hidden Bearish", defval=true)
bearColor = color.red
bullColor = color.green
hiddenBullColor = color.new(color.green, 80)
hiddenBearColor = color.new(color.red, 80)
textColor = color.white
noneColor = color.new(color.white, 100)
osc = ta.rsi(src, len)

plot(osc, title="RSI", linewidth=2, color=#2962FF)
hline(50, title="Middle Line", color=#787B86, linestyle=hline.style_dotted)
obLevel = hline(70, title="Overbought", color=#787B86, linestyle=hline.style_dotted)
osLevel = hline(30, title="Oversold", color=#787B86, linestyle=hline.style_dotted)
fill(obLevel, osLevel, title="Background", color=color.rgb(33, 150, 243, 90))

plFound = na(ta.pivotlow(osc, lbL, lbR)) ? false : true
phFound = na(ta.pivothigh(osc, lbL, lbR)) ? false : true
_inRange(cond) =>
	bars = ta.barssince(cond == true)
	rangeLower <= bars and bars <= rangeUpper

//------------------------------------------------------------------------------
// Regular Bullish
// Osc: Higher Low

oscHL = osc[lbR] > ta.valuewhen(plFound, osc[lbR], 1) and _inRange(plFound[1])

// Price: Lower Low

priceLL = low[lbR] < ta.valuewhen(plFound, low[lbR], 1)
// bull : 상승 Condition : 조건
bullCond = plotBull and priceLL and oscHL and plFound // 상승다이버전스?
strategy.entry("상승 다이버전스 진입", strategy.long, when = bullCond)
strategy.close("상승 다이버전스 진입", when = ta.crossover(osc, 50))
plot(
     plFound ? osc[lbR] : na,
     offset=-lbR,
     title="Regular Bullish",
     linewidth=2,
     color=(bullCond ? bullColor : noneColor)
     )

plotshape(
	 bullCond ? osc[lbR] : na,
	 offset=-lbR,
	 title="Regular Bullish Label",
	 text=" Bull ",
	 style=shape.labelup,
	 location=location.absolute,
	 color=bullColor,
	 textcolor=textColor
	 )

//------------------------------------------------------------------------------
// Hidden Bullish
// Osc: Lower Low

oscLL = osc[lbR] < ta.valuewhen(plFound, osc[lbR], 1) and _inRange(plFound[1])

// Price: Higher Low

priceHL = low[lbR] > ta.valuewhen(plFound, low[lbR], 1)
hiddenBullCond = plotHiddenBull and priceHL and oscLL and plFound
// strategy.entry("히든 상승 다이버전스 진입", strategy.long, when = hiddenBullCond)
// strategy.close("히든 상승 다이버전스 진입", when = ta.crossover(osc, 50))
plot(
	 plFound ? osc[lbR] : na,
	 offset=-lbR,
	 title="Hidden Bullish",
	 linewidth=2,
	 color=(hiddenBullCond ? hiddenBullColor : noneColor)
	 )

plotshape(
	 hiddenBullCond ? osc[lbR] : na,
	 offset=-lbR,
	 title="Hidden Bullish Label",
	 text=" H Bull ",
	 style=shape.labelup,
	 location=location.absolute,
	 color=bullColor,
	 textcolor=textColor
	 )

//------------------------------------------------------------------------------
// Regular Bearish
// Osc: Lower High

oscLH = osc[lbR] < ta.valuewhen(phFound, osc[lbR], 1) and _inRange(phFound[1])

// Price: Higher High

priceHH = high[lbR] > ta.valuewhen(phFound, high[lbR], 1)
// bear : 하락
bearCond = plotBear and priceHH and oscLH and phFound
// strategy.entry("하락 다이버전스 진입", strategy.short, when = bearCond)
// strategy.close("하락 다이버전스 진입", when = ta.crossunder(osc, 50))
plot(
	 phFound ? osc[lbR] : na,
	 offset=-lbR,
	 title="Regular Bearish",
	 linewidth=2,
	 color=(bearCond ? bearColor : noneColor)
	 )

plotshape(
	 bearCond ? osc[lbR] : na,
	 offset=-lbR,
	 title="Regular Bearish Label",
	 text=" Bear ",
	 style=shape.labeldown,
	 location=location.absolute,
	 color=bearColor,
	 textcolor=textColor
	 )

//------------------------------------------------------------------------------
// Hidden Bearish
// Osc: Higher High

oscHH = osc[lbR] > ta.valuewhen(phFound, osc[lbR], 1) and _inRange(phFound[1])

// Price: Lower High

priceLH = high[lbR] < ta.valuewhen(phFound, high[lbR], 1)

hiddenBearCond = plotHiddenBear and priceLH and oscHH and phFound
// strategy.entry("히든 하락 다이버전스 진입", strategy.short, when = hiddenBearCond)
// strategy.close("히든 하락 다이버전스 진입", when = ta.crossunder(osc, 50))
plot(
	 phFound ? osc[lbR] : na,
	 offset=-lbR,
	 title="Hidden Bearish",
	 linewidth=2,
	 color=(hiddenBearCond ? hiddenBearColor : noneColor)
	 )

plotshape(
	 hiddenBearCond ? osc[lbR] : na,
	 offset=-lbR,
	 title="Hidden Bearish Label",
	 text=" H Bear ",
	 style=shape.labeldown,
	 location=location.absolute,
	 color=bearColor,
	 textcolor=textColor
	 )