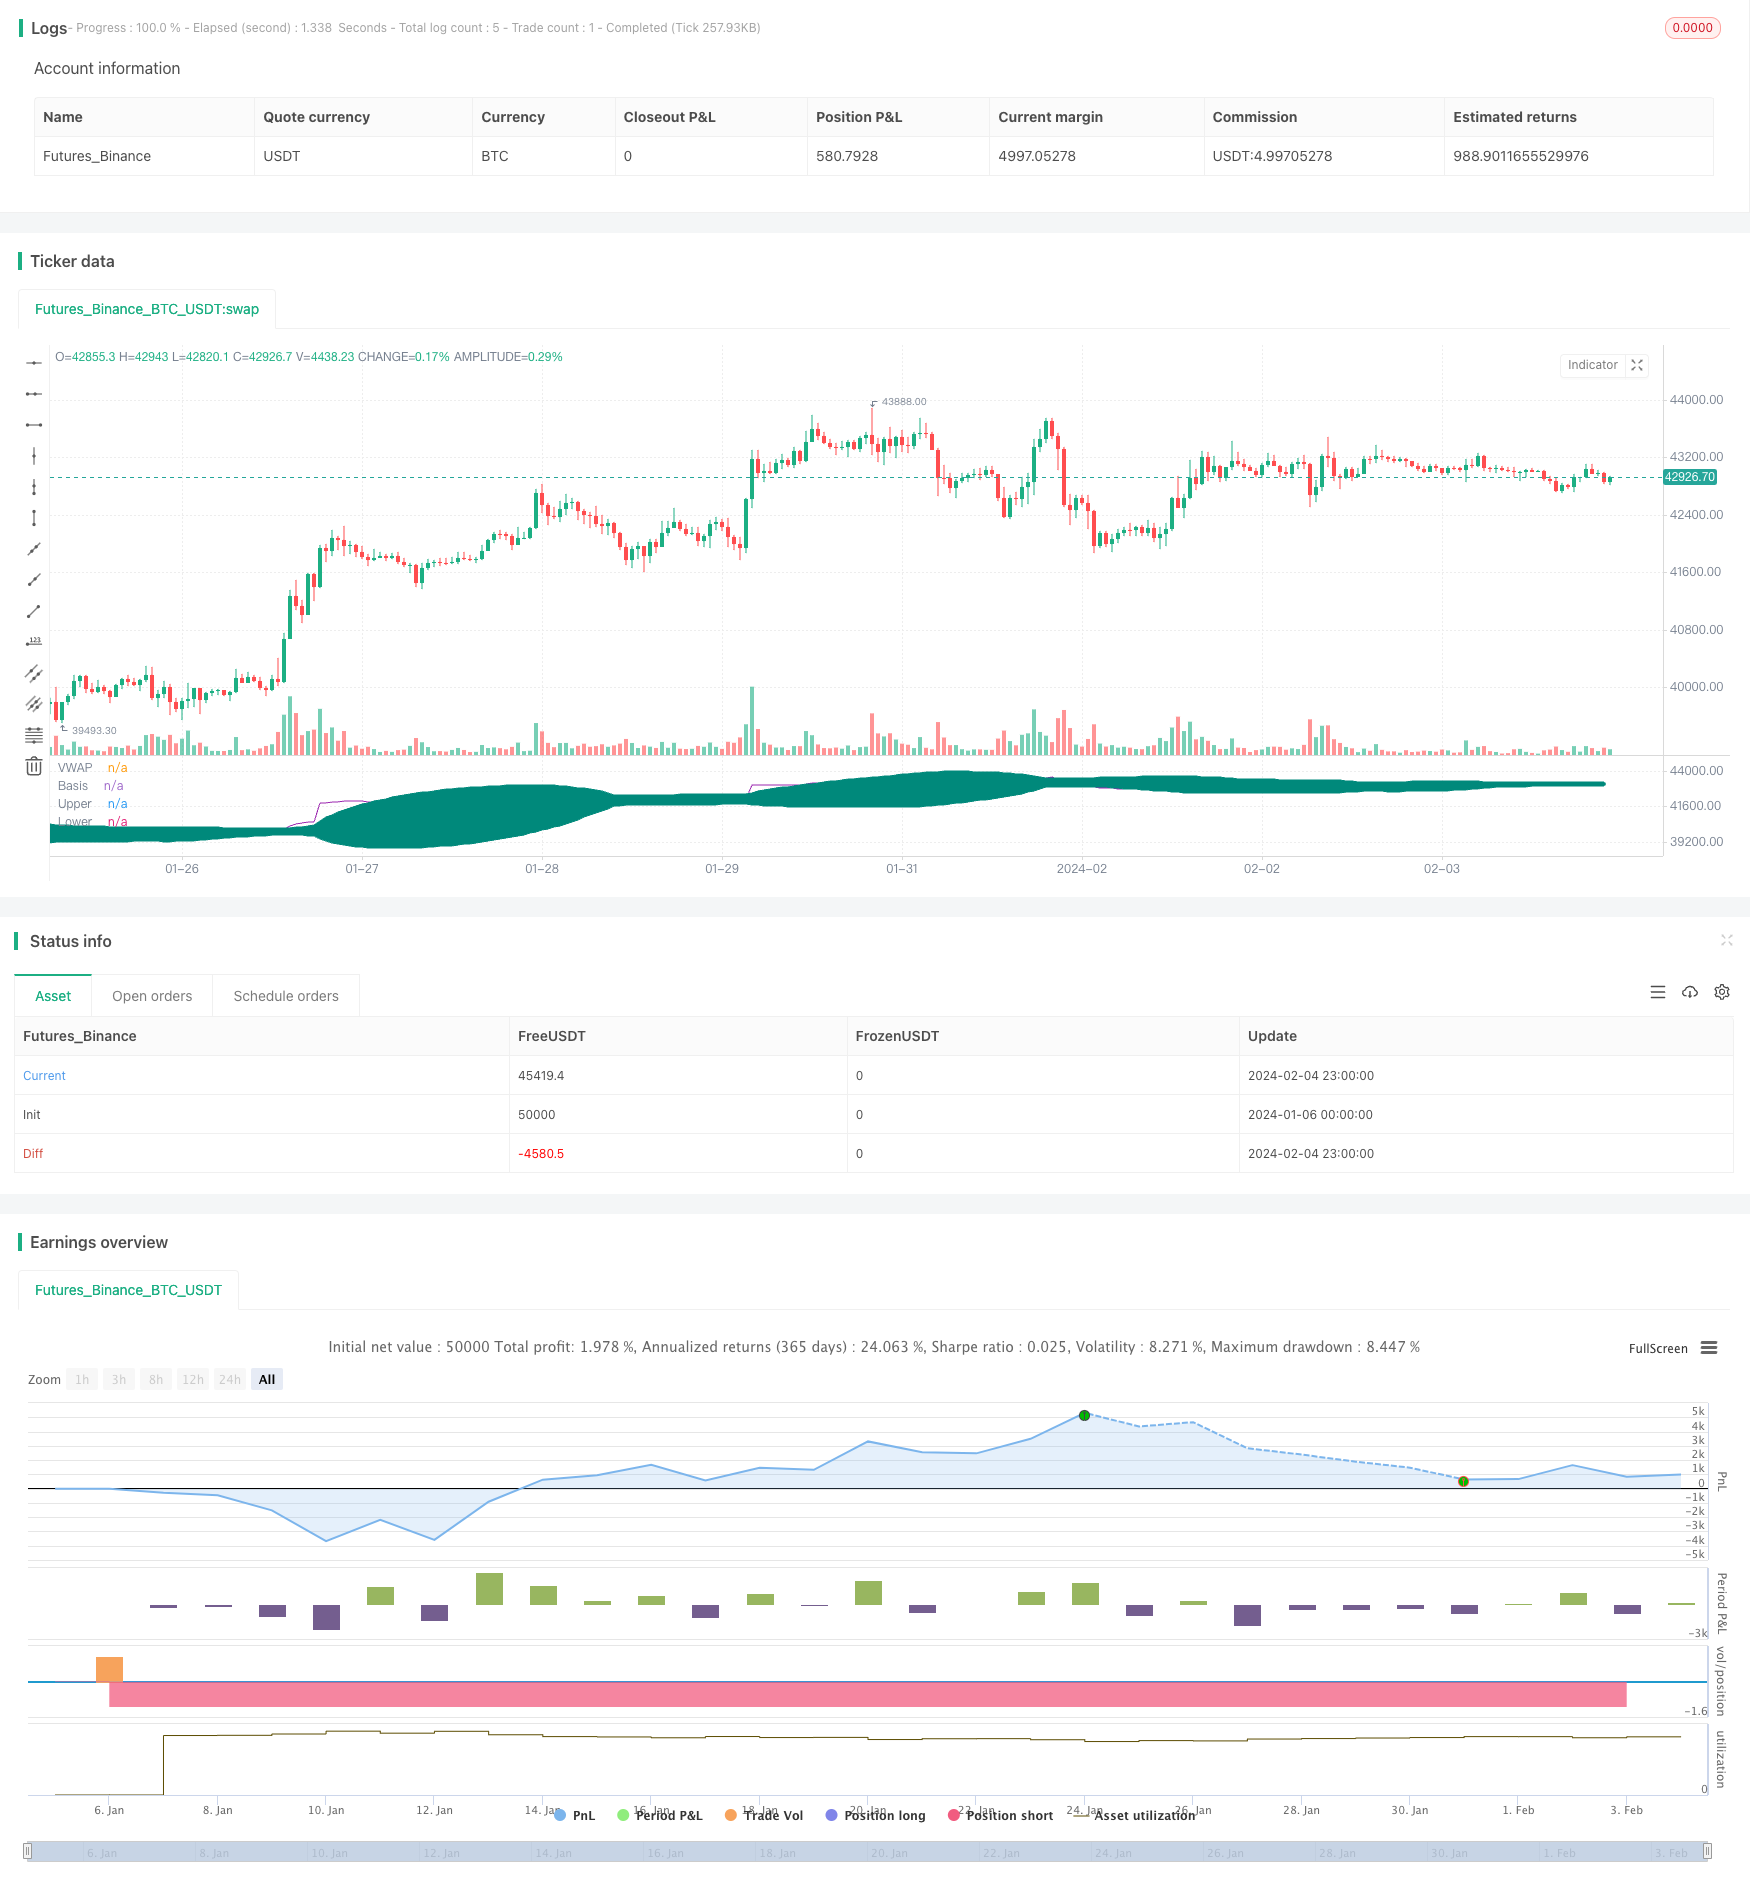
Estrategia de ruptura alcista basada en las bandas de Bollinger y VWAP

Descripción general
Esta estrategia utiliza el indicador de la banda de Brin para rastrear el VWAP, y toma una estrategia de múltiples cabezas cuando el VWAP supera el centro de la banda de Brin hacia arriba, lo que se considera una ruptura múltiple; y cuando el VWAP cae por debajo de la banda de Brin, lo que se considera una confirmación en blanco y una salida de posición plana. Al mismo tiempo, la estrategia también introduce el Pivot Point de la posición de soporte principal como un criterio auxiliar de la señal de entrada, para filtrar algunas falsas rupturas.
Principio de estrategia
- Calcular el valor del VWAP.
- Calcula el VWAP de las bandas de Brin, que incluyen la vía superior, la vía media y la vía inferior
- Si es así y el precio está por encima del Pivot Point de su principal soporte, utilice una estrategia de entrada de múltiples cabezas.
- El Stop Loss se fija en el 5%.
- Si el VWAP desciende por debajo de la banda de baja de Brin, se considera que la cabeza vacía está confirmada y la posición se despega; si el stop loss se activa, también se despega.
Análisis de las ventajas
- VWAP tiene una gran capacidad de seguimiento de tendencias, combinado con la capacidad de Brinband para determinar con precisión las tendencias.
- La adición de Pivot Point como condición auxiliar puede filtrar muchas brechas falsas y evitar pérdidas innecesarias.
- El uso de estrategias de salida parcial puede bloquear una parte de las ganancias y controlar el riesgo.
- Los resultados de la retrospectiva muestran que la estrategia ha tenido un excelente desempeño en un mercado alcista, con una mayor estabilidad.
Análisis de riesgos
- En situaciones de crisis, las falsas rupturas pueden provocar pérdidas.
- El Pivot Point no puede evitar completamente la falsa ruptura, por lo que es necesario combinar más indicadores para filtrar la señal.
- La ausencia de algunos de ellos ha aumentado la frecuencia de las operaciones y el costo de las transacciones.
- En un mercado bajista, el resultado no es lo ideal y se requiere un control de riesgos.
Dirección de optimización
- Se puede combinar con otros indicadores como MACD, KDJ y otros para ayudar a filtrar las señales de entrada y salida.
- Se puede buscar la combinación óptima de parámetros optimizando la longitud y la diferencia estándar de la banda de Bryn.
- Se pueden introducir algoritmos de aprendizaje automático para optimizar dinámicamente los parámetros de la banda de Bryn.
- Se pueden probar diferentes niveles de pérdida para encontrar el punto de pérdida óptimo.
- Se puede incorporar un mecanismo de adaptación de salida de la cancha para ajustar los objetivos de ganancias según la volatilidad del mercado.
Resumir
Esta estrategia en general es un sistema de ruptura estable. Su forma de operación estandarizada, el espacio de optimización de parámetros es grande, adecuado para la transacción cuantitativa. Al mismo tiempo, se debe tener en cuenta el control de riesgos y la prevención de pérdidas causadas por situaciones anormales. En general, es una estrategia de tipo ruptura que merece un estudio profundo y una optimización continua.
/*backtest
start: 2024-01-06 00:00:00
end: 2024-02-05 00:00:00
period: 1h
basePeriod: 15m
exchanges: [{"eid":"Futures_Binance","currency":"BTC_USDT"}]
*/

// This source code is subject to the terms of the Mozilla Public License 2.0 at https://mozilla.org/MPL/2.0/
// © ediks123

//@version=4
strategy("BBofVWAP with entry at Pivot Point", overlay=false, pyramiding=1,   default_qty_type=strategy.percent_of_equity,  default_qty_value=20, initial_capital=10000, currency=currency.USD)  //default_qty_value=10, default_qty_type=strategy.fixed,

// Function outputs 1 when it's the first bar of the D/W/M/Y
is_newbar(res) =>
    ch = 0
    if(res == 'Y')
        t  = year(time('D'))
        ch := change(t) != 0 ? 1 : 0
    else
        t = time(res)
        ch := change(t) != 0 ? 1 : 0
    ch


//variables BEGIN
//smaLength=input(200,title="Slow MA Length")

bbLength=input(50,title="BB Length")
//bbsrc = input(close, title="BB Source")
mult = input(2.0, minval=0.001, maxval=50, title="StdDev")
offset = input(0, "Offset", type = input.integer, minval = -500, maxval = 500)

pp_period = input(title = "Pivot Period", type=input.string, defval="Week", options = ['Day', 'Week'])

pp_res = pp_period == 'Day' ? 'D' : pp_period == 'Week' ? 'W' : pp_period == 'Month' ? 'M' : 'Y'

riskCapital = input(title="Risk % of capital", defval=10, minval=1)
stopLoss=input(5,title="Stop Loss",minval=1)


//sma200=sma(close,smaLength)
//plot(sma200, title="SMA 200", color=color.orange)

myVwap=vwap(hlc3)

//bollinger calculation
basis = sma(myVwap, bbLength)
dev = mult * stdev(myVwap, bbLength)
upperBand = basis + dev
lowerBand = basis - dev

//plot bb
plot(basis, "Basis", color=color.teal, style=plot.style_circles , offset = offset)
p1 = plot(upperBand, "Upper", color=color.teal, offset = offset)
p2 = plot(lowerBand, "Lower", color=color.teal, offset = offset)
fill(p1, p2, title = "Background", color=color.teal, transp=95)

plot(myVwap, title="VWAP", color=color.purple)


//pivot points


// Calc High
high_cur = 0.0
high_cur := is_newbar(pp_res) ? high : max(high_cur[1], high)

phigh = 0.0
phigh := is_newbar(pp_res) ? high_cur[1] : phigh[1]

// Calc Low
low_cur = 0.0
low_cur := is_newbar(pp_res) ? low : min(low_cur[1], low)

plow = 0.0
plow := is_newbar(pp_res) ? low_cur[1] : plow[1]

// Calc Close
pclose = 0.0
pclose := is_newbar(pp_res) ? close[1] : pclose[1]


vPP = (phigh + plow + pclose) / 3

//pivot points


//Entry--
//Echeck how many units can be purchased based on risk manage ment and stop loss
qty1 = (strategy.equity  * riskCapital / 100 ) /  (close*stopLoss/100)

//check if cash is sufficient  to buy qty1  , if capital not available use the available capital only
qty1:= (qty1 * close >= strategy.equity ) ? (strategy.equity / close) : qty1


strategy.entry(id="BB_VWAP_PP",long=true, qty=qty1, when=   crossover(myVwap,basis)  and close>=vPP  )

bgcolor(strategy.position_size>=1?color.blue:na, transp=75)
barcolor(strategy.position_size>=1?color.green:na)

stopLossVal=  strategy.position_size>=1 ?  close * (1 - (stopLoss*0.01) ) : 0.00

//partial exit
//strategy.close(id="BBofVwap", qty=strategy.position_size/3, when=crossunder(myVwap,upperBand) and strategy.position_size>=1 )  //and close>strategy.position_avg_price)


//exit on lowerband or stoploss
strategy.close(id="BB_VWAP_PP", comment="P" , qty=strategy.position_size/3, when= crossunder(myVwap,upperBand) and strategy.position_size>=1 and close>strategy.position_avg_price)  //
strategy.close(id="BB_VWAP_PP", comment="Exit All", when=crossunder(myVwap,lowerBand) and strategy.position_size>=1 )
//strategy.close(id="BBofVwapWithFibPivot", comment="Exit All", when=crossunder(close,vPP) and strategy.position_size>=1 )

strategy.close(id="BB_VWAP_PP", comment="Stop Loss Exit", when=crossunder(close,stopLossVal) and strategy.position_size>=1 )