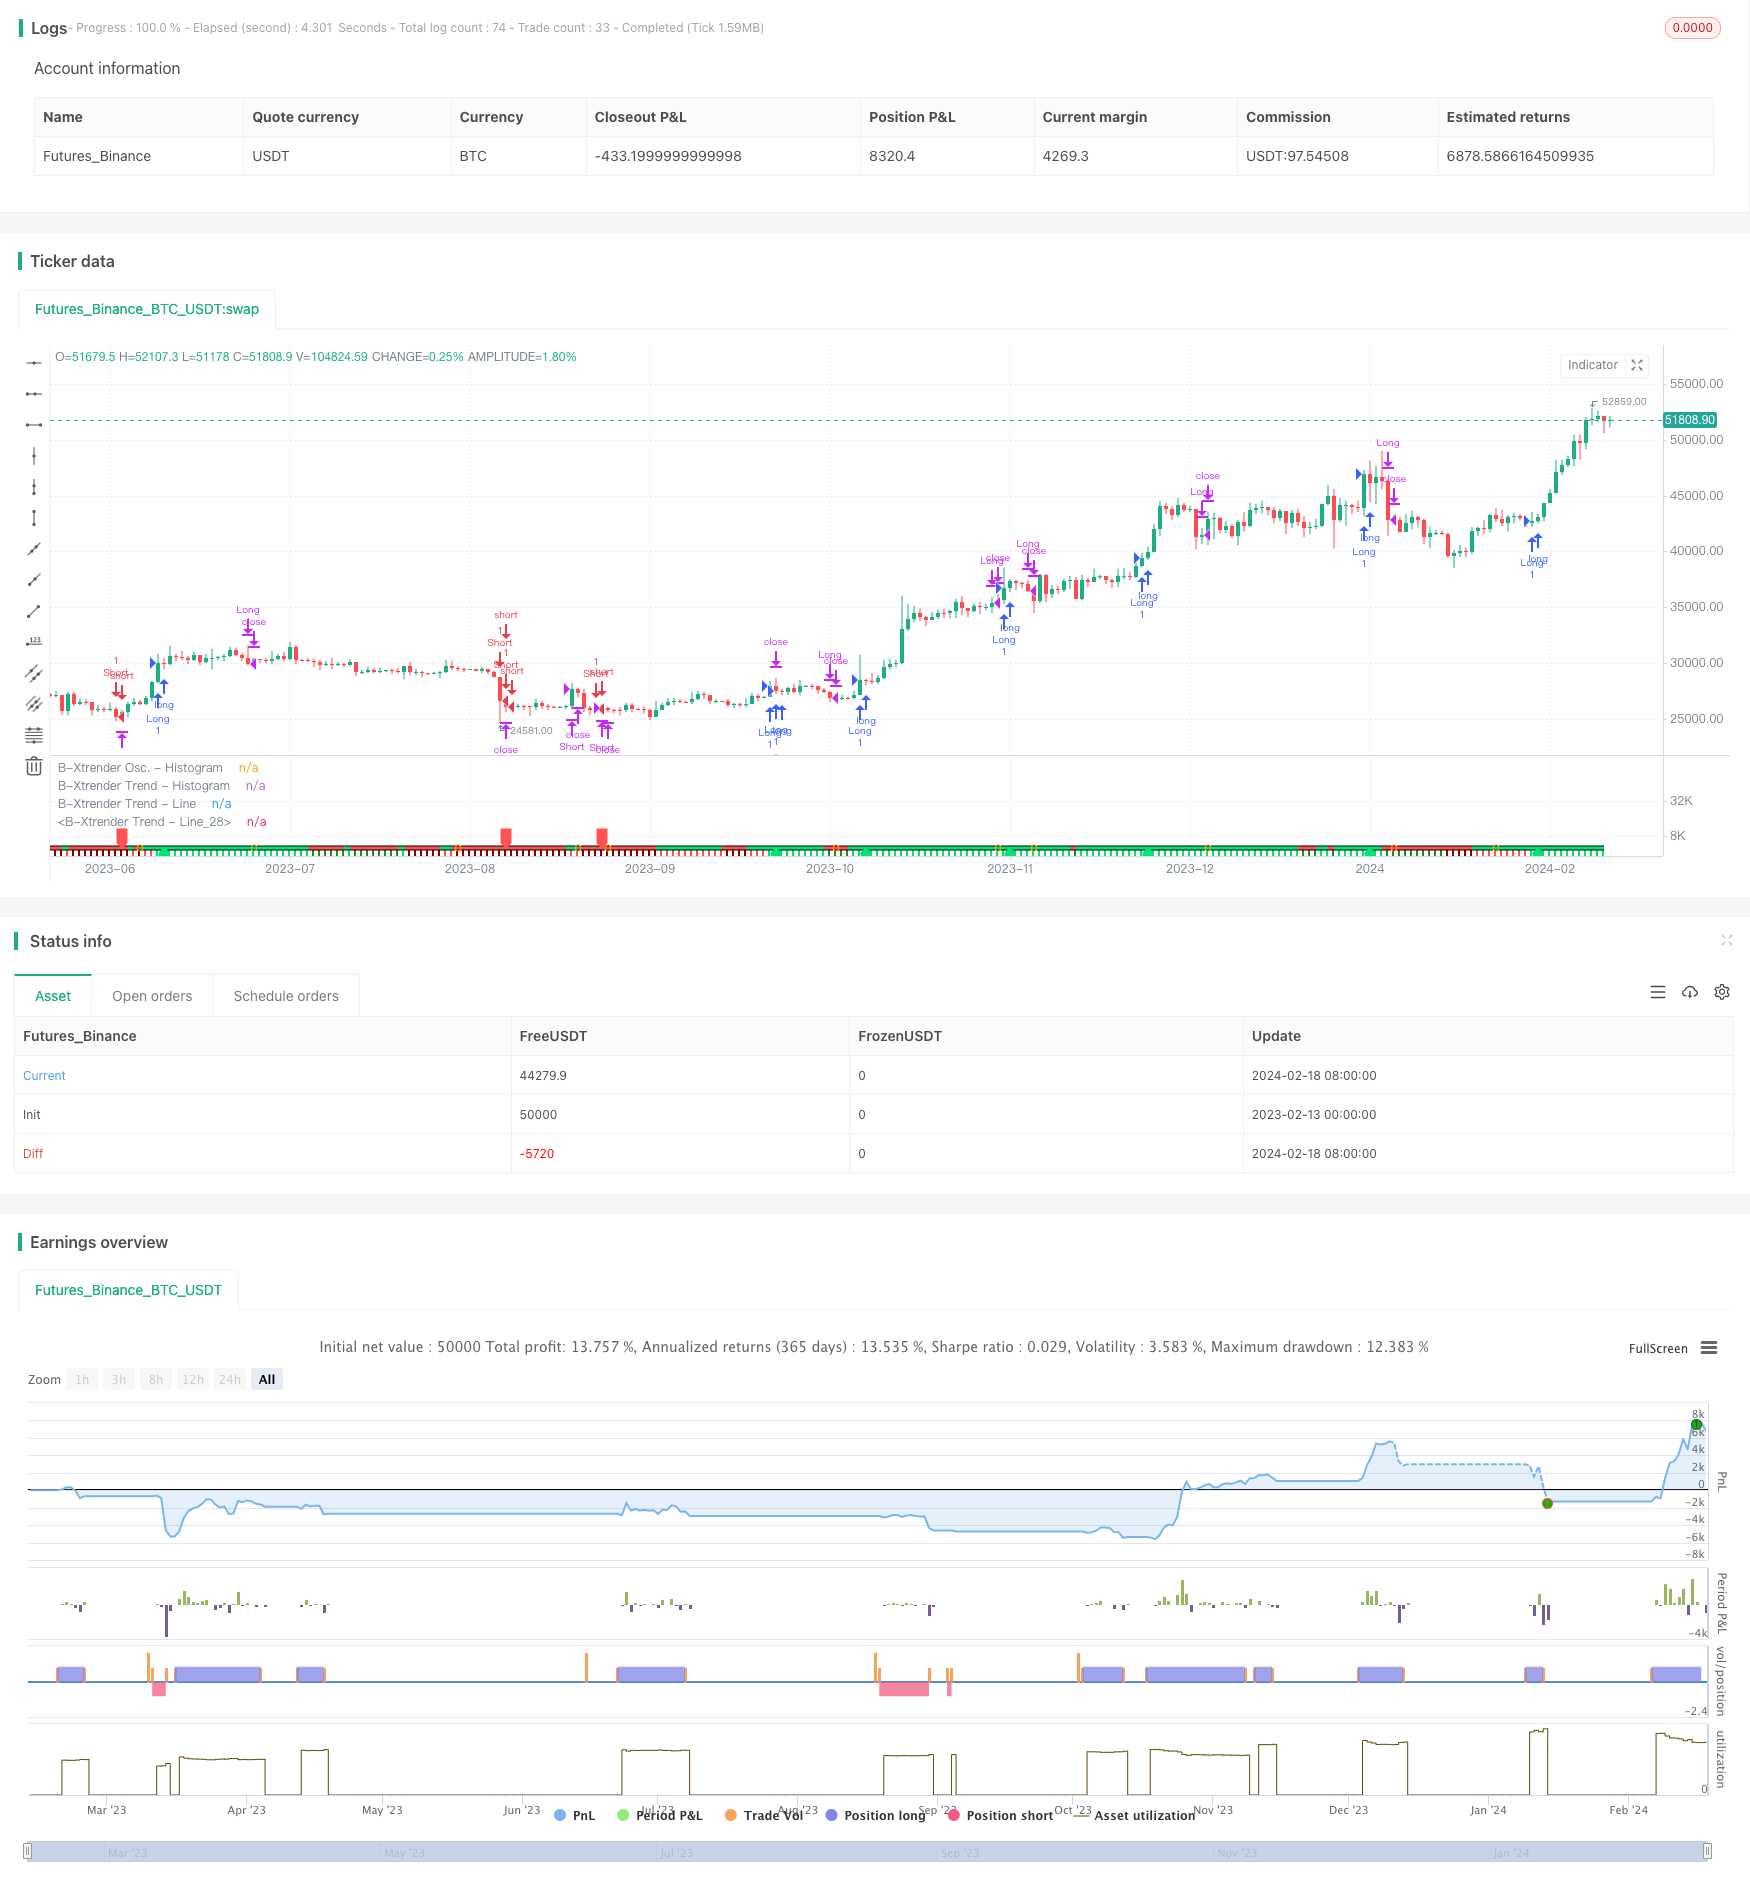
Estrategia B-Xtrender de cruce de medias móviles exponenciales
Fecha de creación:
2024-02-20 14:45:17
Última modificación:
2024-02-20 14:45:17
Copiar:
0
Número de Visitas:
1697
1
Seguir
1629
Seguidores

Descripción general
La estrategia es una estrategia de negociación basada en el principio de cruce de la línea media del índice. Al mismo tiempo, combina el indicador RSI y el filtro de la línea media para formar un sistema de negociación de seguimiento de tendencias y reversión más completo.
Principio de estrategia
- Las señales de intercambio se forman mediante el cruce rápido y lento de las medias móviles del índice. El cruce de la línea rápida es el cruce de la línea de 5 y 20 días de la EMA, y el cruce de la línea lenta es el cruce de la línea de 20 y 15 días de la EMA.
- Haga más cuando atraviesa la línea lenta en la línea rápida, y deje en blanco cuando atraviesa la línea lenta en la línea rápida. Utilice el indicador RSI para una segunda verificación, y solo confirme la validez de la señal de negociación cuando el RSI también se cruza.
- La inclusión de la media móvil de 200 días como filtro permite emitir señales de negociación solo cuando el precio supera esa línea media, evitando así múltiples cruces falsos en situaciones de crisis.
Ventajas estratégicas
- El doble cruce de EMA en combinación con el RSI mejora considerablemente la fiabilidad de la señal y reduce la tasa de falsedad.
- La combinación de los parámetros de EMA rápido y lento tiene en cuenta la sensibilidad de la señal de negociación y asegura la estabilidad de la señal.
- La adición de un filtro uniforme, puede filtrar eficazmente el ruido en caso de vibración, evitando transacciones innecesarias.
Riesgo estratégico
- El EMA es un indicador de retraso que se manifiesta cuando los precios cambian drásticamente. Esto puede aumentar las pérdidas o el riesgo de que se pierda la señal.
- La configuración incorrecta de los parámetros RSI también puede causar un retraso en la señal.
- El filtro de la línea media, aunque evita la oscilación del mercado, también puede filtrar las oportunidades de entrada temprana en la fase inicial de la tendencia.
Dirección de optimización de la estrategia
- Ajuste dinámico de los parámetros de EMA para seleccionar la combinación óptima de parámetros en diferentes períodos.
- Intenta combinar otros indicadores como el MACD con el RSI.
- Optimización de los parámetros del filtro uniforme para encontrar un equilibrio entre el desanicio y la oportunidad de captación.
Resumir
La estrategia en general es un sistema de comercio de medias móviles de índices más completo. Basado en la obtención de señales de comercio, la introducción adicional del indicador RSI realiza una verificación múltiple. Sin duda, esto puede mejorar considerablemente la calidad de la señal y es una estrategia que vale la pena aprender y optimizar.
Código Fuente de la Estrategia
/*backtest
start: 2023-02-13 00:00:00
end: 2024-02-19 00:00:00
period: 1d
basePeriod: 1h
exchanges: [{"eid":"Futures_Binance","currency":"BTC_USDT"}]
*/

// This source code is subject to the terms of the Mozilla Public License 2.0 at https://mozilla.org/MPL/2.0/
// © QuantTherapy
//@version=4
strategy("B-Xtrender [Backtest Edition] @QuantTherapy")

i_short_l1  = input(5 , title="[Short] L1")
i_short_l2  = input(20, title="[Short] L2")
i_short_l3  = input(15, title="[Short] L3")

i_long_l1   = input(20, title="[Long] L1")
i_long_l2   = input(15, title="[Long] L2")

i_ma_use    = input(true , title="[MA Filter] Yes/No" )
i_ma_len    = input(200  , title="[MA Filter] length" )
i_ma_type   = input("EMA", title="[MA Filter] type", options = ["SMA", "EMA"])

shortTermXtrender = rsi( ema(close, i_short_l1) - ema(close, i_short_l2), i_short_l3 ) - 50
longTermXtrender  = rsi( ema(close, i_long_l1), i_long_l2 ) - 50

shortXtrenderCol = shortTermXtrender > 0 ? shortTermXtrender > shortTermXtrender[1] ? color.lime : #228B22 : shortTermXtrender > shortTermXtrender[1] ? color.red : #8B0000
plot(shortTermXtrender, color=shortXtrenderCol, style=plot.style_columns, linewidth=1, title="B-Xtrender Osc. - Histogram", transp = 40)

longXtrenderCol   = longTermXtrender> 0 ? longTermXtrender > longTermXtrender[1] ? color.lime : #228B22 : longTermXtrender > longTermXtrender[1] ? color.red : #8B0000
macollongXtrenderCol =  longTermXtrender > longTermXtrender[1] ? color.lime : color.red
plot(longTermXtrender , color=longXtrenderCol, style=plot.style_columns, linewidth=2, title="B-Xtrender Trend - Histogram", transp = 90)

plot(longTermXtrender , color=#000000             , style=plot.style_line, linewidth=5, title="B-Xtrender Trend - Line", transp = 100)
plot(longTermXtrender , color=macollongXtrenderCol, style=plot.style_line, linewidth=3, title="B-Xtrender Trend - Line", transp = 100)

// --- Initialize MA Filter
ma = i_ma_type == "EMA" ? ema(close, i_ma_len) : sma(close, i_ma_len)
maFilterLong = true
maFilterShort = true
if i_ma_use
    maFilterLong  := close > ma ? true : false
    maFilterShort := close < ma ? true : false

long  = shortTermXtrender > 0 and longTermXtrender > 0 and maFilterLong
closeLong = shortTermXtrender < 0 or longTermXtrender < 0
short = shortTermXtrender < 0 and longTermXtrender < 0 and maFilterShort
closeShort = shortTermXtrender > 0 or longTermXtrender > 0

plotshape(long[1]==true  and long[2]==false  ? 0 : na , location=location.absolute, style=shape.labelup  , color=color.lime, size=size.small, transp=10)
plotshape(short[1]==true and short[2]==false ? 0 : na, location=location.absolute, style=shape.labeldown, color=color.red , size=size.small, transp=10)
plotshape(closeLong[1]==true and closeLong[2]==false
 or closeShort[1]==true and closeShort[2]==false ? 0 : na, location=location.absolute, style=shape.circle, color=color.orange , size=size.small)

i_perc     = input(defval = 20.0, title = "[TSL-%] Percent"  , minval = 0.1 )
i_src = close // constant for calculation
sl_val = i_src * i_perc / 100

strategy.entry("Long", strategy.long, when = long )
strategy.close("Long", when = closeLong)

strategy.entry("Short", strategy.short, when = short)
strategy.close("Short", when = closeShort)

// Calculate SL
longStopPrice = 0.0, shortStopPrice = 0.0
longStopPrice := if (strategy.position_size > 0)
    stopValue = close - sl_val
    max(stopValue, longStopPrice[1])
else
    0

shortStopPrice := if (strategy.position_size < 0)
    stopValue = close + sl_val
    min(stopValue, shortStopPrice[1])
else
    syminfo.mintick*1000000

// For TSL Visualisation on Chart
// plot(series=(strategy.position_size > 0) ? longStopPrice : na,
//      color=color.fuchsia, style = plot.style_circles,
//      linewidth=1, title="Long Trail Stop")

// plot(series=(strategy.position_size < 0) ? shortStopPrice : na,
//      color=color.fuchsia, style = plot.style_circles,
//      linewidth=1, title="Short Trail Stop")

if (strategy.position_size > 0)
    strategy.exit(id="TSL Long", stop=longStopPrice)

if (strategy.position_size < 0)
    strategy.exit(id="TSL Short", stop=shortStopPrice)