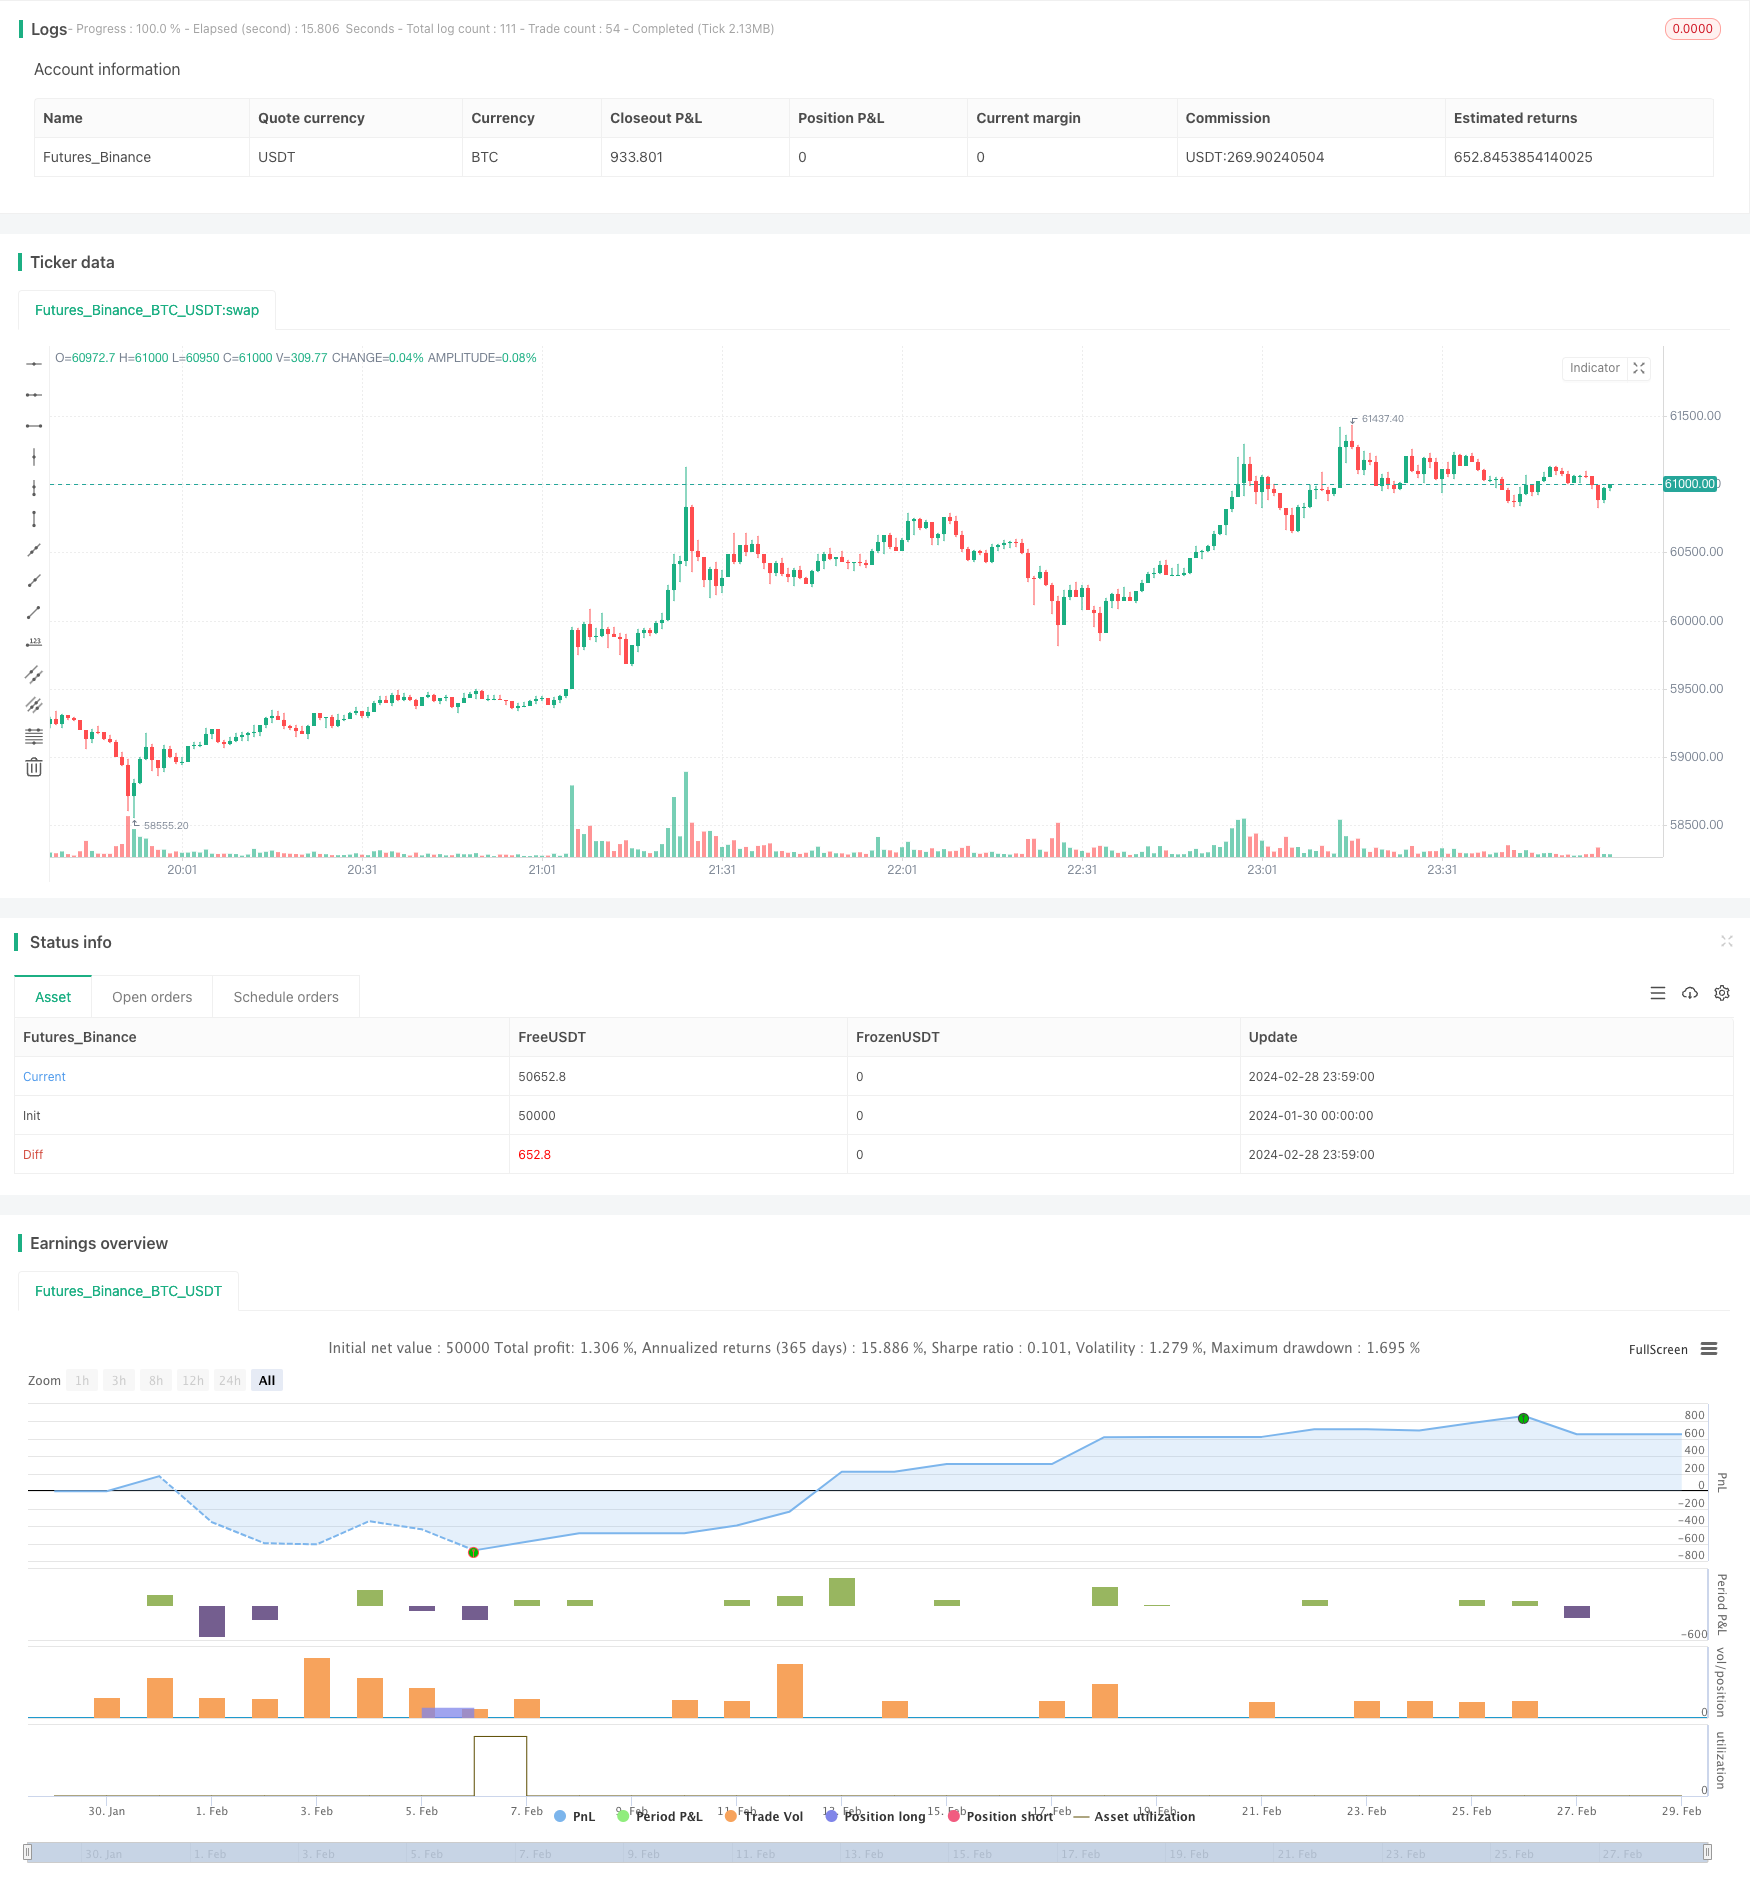
Patrón alcista de estrategia RSI y RSI suavizado

Descripción general
La estrategia busca oportunidades de compra en los puntos bajos de los precios mediante la combinación del indicador RSI con el indicador RSI suave. Cuando el indicador RSI es innovador y el precio no es innovador, se considera una señal de diversificación múltiple. La combinación de un juicio de tendencia con el indicador RSI suave puede mejorar la eficacia de la estrategia.
Principio de estrategia
- Calcula el indicador RSI con el parámetro de la línea de 14 días.
- Calcula el RSI para lograr el efecto de la suavización a través de la media doble WMA.
- Si el RSI está por debajo de 30, está sobrevendido.
- El RSI de la desviación es inferior a 35 y tiene una fuerte orientación.
- Para determinar si el RSI está por debajo de 25.
- Calcular el tipo de RSI, es decir, buscar el RSI de baja innovación y el precio no de baja innovación.
- Para calcular el ciclo de descenso del RSI suave, se necesitan 3 días.
- Cuando se cumplen las condiciones anteriores, se genera una señal de compra.
- Establezca las condiciones de detener y detener los daños.
La estrategia se basa principalmente en la naturaleza inversa del indicador RSI, combinada con la tendencia de juicio del RSI para suavizar, comprando cuando el RSI está sobresaliendo y el precio está bajo presión.
Análisis de las ventajas estratégicas
- La combinación de dos indicadores RSI mejora la efectividad de la estrategia.
- El indicador RSI tiene una ventaja de probabilidad, debido a su carácter inverso.
- El RSI suave puede ayudar a evitar falsas reversiones.
- La lógica de bloqueo de pérdidas completas puede limitar el riesgo.
Análisis de riesgos
- La probabilidad de que el RSI se invierta en un fracaso no puede evitarse por completo.
- El indicador RSI se desplomó y podría haber perdido el mejor momento para comprar.
- El punto de parada está demasiado relajado y el riesgo de pérdidas se expande.
Se puede ajustar el parámetro RSI para optimizar el momento de compra. Se puede reducir adecuadamente el intervalo de parada y acelerar la velocidad de parada. En combinación con otros indicadores para determinar el riesgo de tendencia y reducir la probabilidad de falsa reversión.
Dirección de optimización
- Se puede probar la eficacia del indicador RSI bajo diferentes parámetros.
- Optimizar el método de cálculo del RSI para mejorar la calidad de la suavización.
- Ajuste el punto de parada para encontrar la mejor relación de riesgo/beneficio.
- Aumentar la capacidad de discernimiento, como los indicadores de capacidad, para evitar la falta de capacidad.
El ajuste de parámetros y la combinación de más indicadores pueden mejorar aún más la eficacia de la estrategia de negociación.
Resumir
El conjunto de la estrategia es una idea de estrategia que aprovecha las características de la inversión del RSI. La combinación de dos indicadores RSI aprovecha al máximo el efecto de la inversión del RSI, pero también aumenta la incertidumbre causada por la discrepancia de los indicadores. El conjunto es una idea de estrategia de indicadores típica.
/*backtest
start: 2024-01-30 00:00:00
end: 2024-02-29 00:00:00
period: 1m
basePeriod: 1m
exchanges: [{"eid":"Futures_Binance","currency":"BTC_USDT"}]
*/

// This source code is subject to the terms of the Mozilla Public License 2.0 at https://mozilla.org/MPL/2.0/
// © BigBitsIO

//@version=4
strategy(title="RSI and Smoothed RSI Bull Div Strategy [BigBitsIO]", shorttitle="RSI and Smoothed RSI Bull Div Strategy [BigBitsIO]", overlay=true, pyramiding=1, default_qty_type=strategy.percent_of_equity, default_qty_value=100, commission_type=strategy.commission.percent, commission_value=.1, slippage=0)


TakeProfitPercent = input(3, title="Take Profit %", type=input.float, step=.25)
StopLossPercent = input(1.75, title="Stop Loss %", type=input.float, step=.25)

RSICurve = input(14, title="RSI Lookback Period", type=input.integer, step=1)
BuyBelowTargetPercent = input(0, title="Buy Below Lowest Low In RSI Divergence Lookback Target %", type=input.float, step=.05)
BuyBelowTargetSource = input(close, title="Source of Buy Below Target Price", type=input.source)
SRSICurve = input(10, title="Smoothed RSI Lookback Period", type=input.integer, step=1)
RSICurrentlyBelow = input(30, title="RSI Currently Below", type=input.integer, step=1)
RSIDivergenceLookback = input(25, title="RSI Divergence Lookback Period", type=input.integer, step=1)
RSILowestInDivergenceLookbackCurrentlyBelow  = input(25, title="RSI Lowest In Divergence Lookback Currently Below", type=input.integer, step=1)
RSISellAbove = input(65, title="RSI Sell Above", type=input.integer, step=1)
MinimumSRSIDownTrend = input(3, title="Minimum SRSI Downtrend Length", type=input.integer, step=1)
SRSICurrentlyBelow = input(35, title="Smoothed RSI Currently Below", type=input.integer, step=1)

PlotTarget = input(false, title="Plot Target")


RSI = rsi(close, RSICurve)
SRSI = wma(2*wma(RSI, SRSICurve/2)-wma(RSI, SRSICurve), round(sqrt(SRSICurve))) // Hull moving average

SRSITrendDownLength = 0
if (SRSI < SRSI[1])
    SRSITrendDownLength := SRSITrendDownLength[1] + 1

// Strategy Specific
ProfitTarget = (close * (TakeProfitPercent / 100)) / syminfo.mintick
LossTarget = (close * (StopLossPercent / 100)) / syminfo.mintick
BuyBelowTarget = BuyBelowTargetSource[(lowestbars(RSI, RSIDivergenceLookback)*-1)] - (BuyBelowTargetSource[(lowestbars(RSI, RSIDivergenceLookback)*-1)] * (BuyBelowTargetPercent / 100))

plot(PlotTarget ? BuyBelowTarget : na)


bool IsABuy = RSI < RSICurrentlyBelow and SRSI < SRSICurrentlyBelow and lowest(SRSI, RSIDivergenceLookback) < RSILowestInDivergenceLookbackCurrentlyBelow and BuyBelowTargetSource < BuyBelowTarget and SRSITrendDownLength >= MinimumSRSIDownTrend and RSI > lowest(RSI, RSIDivergenceLookback)
bool IsASell = RSI > RSISellAbove

if IsABuy
    strategy.entry("Positive Trend", true) // buy by market
    strategy.exit("Take Profit or Stop Loss", "Positive Trend", profit = ProfitTarget, loss = LossTarget)
if IsASell
    strategy.close("Positive Trend")