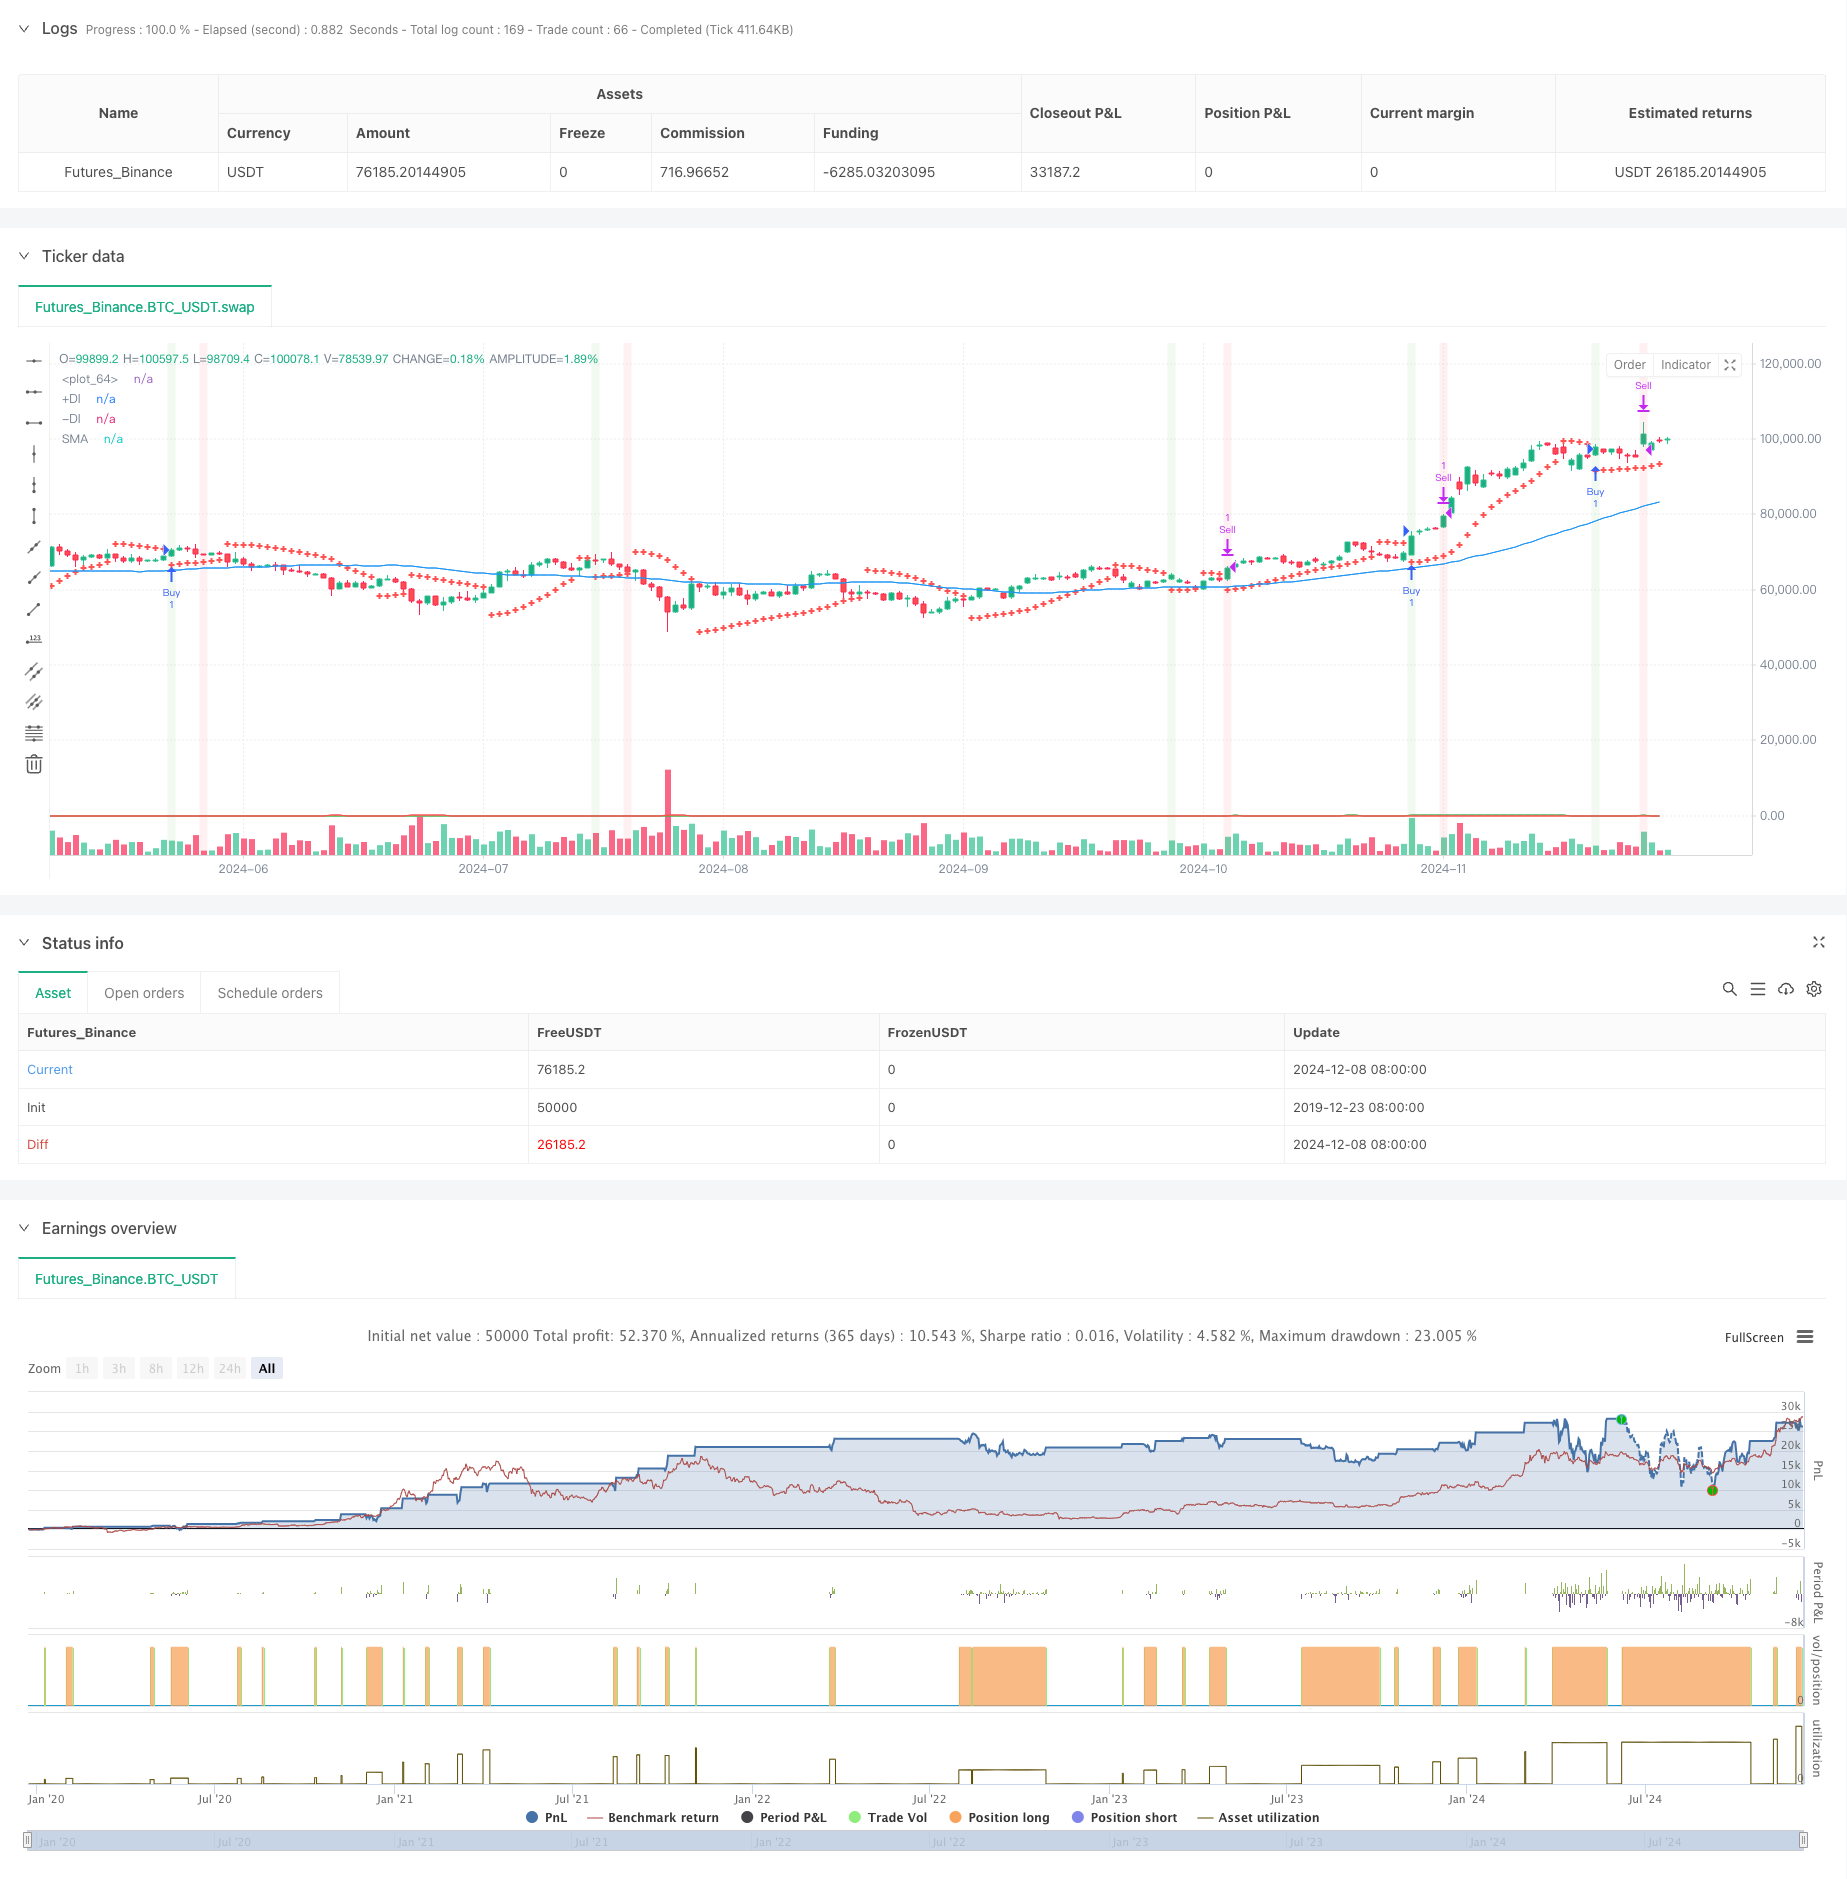
Descripción general
La estrategia es un sistema de comercio de seguimiento de tendencias que combina varios indicadores técnicos. Utiliza principalmente el indicador de giro de la línea paralela (SAR), el promedio móvil (SMA) y el indicador de dinámica direccional (DMI) para determinar la tendencia del mercado y el momento de entrada, y optimiza la salida mediante el porcentaje de parada y el retroceso MACD. La idea central del diseño de la estrategia es ingresar después de una tendencia fuerte y salir a tiempo cuando se alcanza el objetivo de ganancias predeterminado o se producen señales de cambio de tendencia.
Principio de estrategia
La estrategia utiliza un mecanismo de filtración de varias capas para confirmar las señales de transacción:
- Captura de la señal de negociación inicial mediante el cruce de los indicadores SAR
- Utiliza el SMA de 50 ciclos para determinar la dirección de la tendencia general
- El uso del indicador DMI para confirmar la fuerza y la dirección de la tendencia
- Los requisitos de entrada deben cumplirse al mismo tiempo: el precio debe estar por encima del SAR, el precio debe estar por encima del SMA y el DMI debe mostrar una tendencia múltiple
- El doble mecanismo de salida: el objetivo de ganancias del 3% o la aparición de la señal de tenedor muerto MACD
- Indicador ATR utilizado para referirse a la volatilidad del mercado
Ventajas estratégicas
- Verificación cruzada de múltiples indicadores tecnológicos para reducir las señales falsas
- Mejorar la tasa de éxito de las transacciones combinando el seguimiento de tendencias y los indicadores de dinámica
- Las estrategias de cierre de porcentaje fijo garantizan una ganancia estable
- El MACD se aleja del mecanismo de salida para evitar la reversión de la tendencia
- Los parámetros de la estrategia se pueden ajustar de manera flexible según las características de los diferentes mercados
- ATR para la vigilancia de la volatilidad y la referencia al estado del mercado
Riesgo estratégico
- Múltiples indicadores pueden causar retraso en la señal
- El paréntesis fijo podría salirse antes de tiempo en una tendencia fuerte
- La ausencia de un mecanismo de suspensión de pérdidas aumenta la brecha de riesgo
- En el mercado horizontal puede haber demasiadas señales falsas
- El indicador DMI podría generar señales engañosas en mercados convulsionados
Dirección de optimización de la estrategia
- Introducción de mecanismos de detención de pérdidas adaptativos, como el deterioro dinámico basado en ATR
- Desarrollo de filtros de fluctuación para ajustar el tamaño de las posiciones durante períodos de alta volatilidad
- Optimización de los parámetros MACD para mejorar la precisión de los juicios de giro de tendencia
- Añadir mecanismo de confirmación de volumen para mejorar la confiabilidad de la señal
- Desarrollar un mecanismo de suspensión dinámica para ajustar los objetivos de ganancias en función de las fluctuaciones del mercado
Resumir
La estrategia, a través de la colaboración sinérgica de múltiples indicadores técnicos, construye un sistema de comercio de seguimiento de tendencias relativamente completo. Su ventaja reside en la fiabilidad de la confirmación de señales y la flexibilidad de controlar el riesgo. Aunque existe un cierto riesgo de atraso, el rendimiento general de la estrategia aún tiene un buen valor de aplicación mediante la optimización de los parámetros y la incorporación de un mecanismo de gestión dinámico.
/*backtest
start: 2019-12-23 08:00:00
end: 2024-12-09 08:00:00
period: 1d
basePeriod: 1d
exchanges: [{"eid":"Futures_Binance","currency":"BTC_USDT"}]
*/

//@version=5
strategy("Swing Trading Strategy with DMI", overlay=true)

// Define parameters
sarStart = input.float(0.02, title="SAR Start")
sarIncrement = input.float(0.02, title="SAR Increment")
sarMax = input.float(0.2, title="SAR Max")
atrLength = input.int(10, title="ATR Length")
macdShort = input.int(12, title="MACD Short Length")
macdLong = input.int(26, title="MACD Long Length")
macdSignal = input.int(9, title="MACD Signal Length")
smaLength = input.int(50, title="SMA Length")
dmiLength = input.int(14, title="DMI Length")
adxSmoothing = input.int(14, title="ADX Smoothing") // Smoothing period for ADX
targetProfitPercentage = input.float(3.0, title="Target Profit Percentage")

// Calculate SAR
sar = ta.sar(sarStart, sarIncrement, sarMax)

// Calculate ATR
atr = ta.atr(atrLength)

// Calculate MACD
[macdLine, macdSignalLine, _] = ta.macd(close, macdShort, macdLong, macdSignal)

// Calculate SMA
sma = ta.sma(close, smaLength)
bullishTrend = close > sma

// Calculate DMI
[plusDI, minusDI, adx] = ta.dmi(dmiLength, adxSmoothing) // Specify ADX smoothing period

// Determine if DMI is bullish
dmiBullish = plusDI > minusDI

// Define buy signal
buySignal = ta.crossover(close, sar) and bullishTrend and dmiBullish

// Track buy price and position state
var float buyPrice = na
var bool inPosition = false

// Enter position
if (buySignal and not inPosition)
    buyPrice := close
    inPosition := true
    strategy.entry("Buy", strategy.long)

// Define target price (3% above the buy price)
targetPrice = na(buyPrice) ? na : buyPrice * (1 + targetProfitPercentage / 100)

// Define MACD sell signal
macdSellSignal = ta.crossunder(macdLine, macdSignalLine)

// Define sell signal
sellSignal = inPosition and (close >= targetPrice or macdSellSignal)

// Exit position
if (sellSignal)
    inPosition := false
    strategy.exit("Sell", "Buy", limit=targetPrice)

// Plot SAR on the chart
plot(sar, color=color.red, style=plot.style_cross, linewidth=2)

// Plot SMA (optional, for visualizing the trend)
plot(sma, color=color.blue, title="SMA")

// Plot DMI +DI and -DI
plot(plusDI, color=color.green, title="+DI")
plot(minusDI, color=color.red, title="-DI")

// Plot buy signal on the chart
//plotshape(series=buySignal, location=location.belowbar, color=color.green, style=shape.labelup, text="BUY")

// Plot sell signal on the chart
//plotshape(series=sellSignal, location=location.abovebar, color=color.red, style=shape.labeldown, text="SELL")

// Optional: Plot background color for buy and sell signals
bgcolor(buySignal ? color.new(color.green, 90) : na, title="Buy Signal Background")
bgcolor(sellSignal ? color.new(color.red, 90) : na, title="Sell Signal Background")