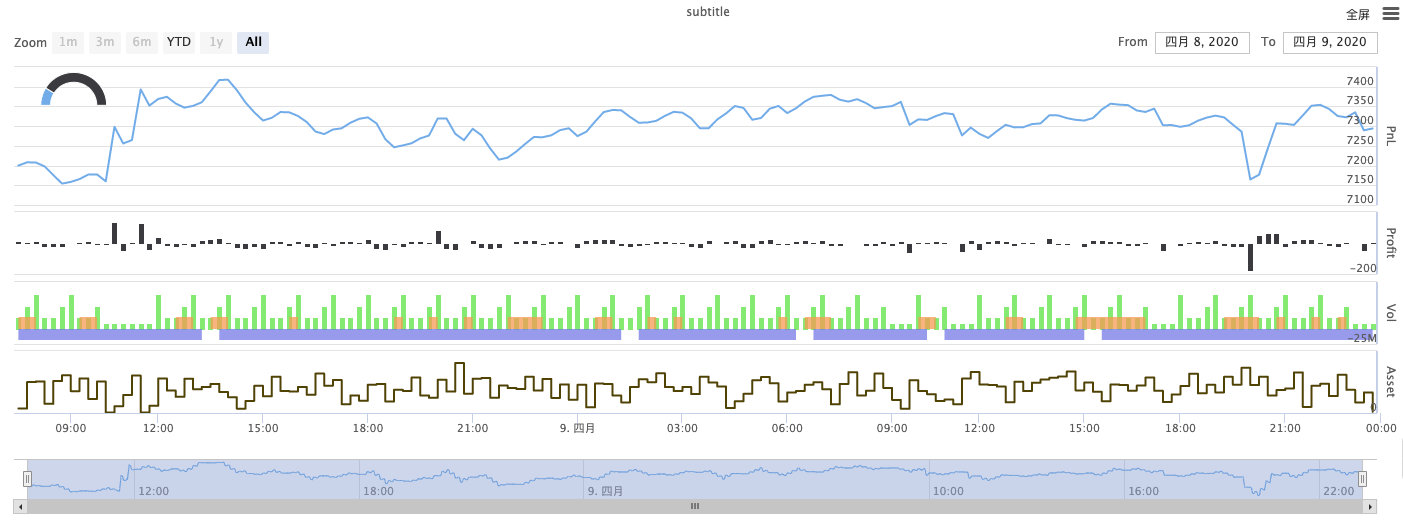
Un exemple complexe de diagramme hybride
Auteur:Nul, Date: 2020-04-11 12h15 et 25 minLes étiquettes:Graphique
Pour plus d'informations, veuillez nous contacter directement.Highchart officielouHighchart est une plateforme de documentation en chinois.

/*backtest
start: 2020-03-11 00:00:00
end: 2020-04-09 23:59:00
period: 1d
exchanges: [{"eid":"Bitfinex","currency":"BTC_USD"}]
*/

var chartCfg = {
    subtitle: {
        text: "subtitle",
    },
    yAxis: [{
        height: "40%",
        lineWidth: 2,
        title: {
            text: 'PnL',
        },
        tickPixelInterval: 20,
        minorGridLineWidth: 1,
        minorTickWidth: 0,
        opposite: true,
        labels: {
            align: "right",
            x: -3,
        }
    }, {
        title: {
            text: 'Profit',
        },
        top: "42%",
        height: "18%",
        offset: 0,
        lineWidth: 2
    }, {
        title: {
            text: 'Vol',
        },
        top: '62%',
        height: '18%',
        offset: 0,
        lineWidth: 2
    }, {
        title: {
            text: 'Asset',
        },
        top: '82%',
        height: '18%',
        offset: 0,
        lineWidth: 2
    }],
    series: [{
        name: 'PnL',
        data: [],
        id: 'primary',
        tooltip: {
            xDateFormat: '%Y-%m-%d %H:%M:%S'
        },
        yAxis: 0
    }, {
        type: 'column',
        lineWidth: 2,
        name: 'Profit',
        data: [],
        yAxis: 1,
    }, {
        type: 'column',
        name: 'Trade',
        data: [],
        yAxis: 2
    }, {
        type: 'area',
        step: true,
        lineWidth: 0,
        name: 'Long',
        data: [],
        yAxis: 2
    }, {
        type: 'area',
        step: true,
        lineWidth: 0,
        name: 'Short',
        data: [],
        yAxis: 2
    }, {
        type: 'line',
        step: true,
        color: '#5b4b00',
        name: 'Asset',
        data: [],
        yAxis: 3
    }, {
        type: 'pie',
        innerSize: '70%',
        name: 'Random',
        data: [],
        center: ['3%', '6%'],
        size: '15%',
        dataLabels: {
            enabled: false
        },
        startAngle: -90,
        endAngle: 90,
    }],
};

function main() {
    let c = Chart(chartCfg);
    let preTicker = null;
    while (true) {
        let t = exchange.GetTicker();

        c.add(0, [t.Time, t.Last]); // PnL
        c.add(1, [t.Time, preTicker ? t.Last - preTicker.Last : 0]); // profit
        let r = Math.random();
        var pos = parseInt(t.Time/86400);
        c.add(2, [t.Time, pos/2]); // Vol
        c.add(3, [t.Time, r > 0.8 ? pos : null]); // Long
        c.add(4, [t.Time, r < 0.8 ? -pos : null]); // Short
        c.add(5, [t.Time, Math.random() * 100]); // Asset
        // update pie
        chartCfg.series[chartCfg.series.length-1].data = [
            ["A", Math.random()*100],
            ["B", Math.random()*100],
         ];
        c.update(chartCfg)
        preTicker = t;
    }
}
Contenu lié
- Stratégie de test de l'inventeur de l'app
- Test de graphique de visualisation complexe
- Test de plusieurs graphiques en C++
- Exemple de diagramme d'indicateur MACD en Python
- Exemple de graphique MACD
- python Tables d'état affichent des exemples de boutons
- Exemples de multi-graphiques (les données peuvent être téléchargées sous forme de table comme csv)
- Utiliser la bibliothèque de classes de lignes pour dessiner des lignes K et des exemples de diagrammes homogènes
- Testez plusieurs graphiques pour afficher la version Python
- TableTemplate
En savoir plus
- TradingViewWebHook stratégie d'exécution du signal (enseignement)
- Les prix des achats et des ventes
- La stratégie de couverture des monnaies multi-monnaies pérennes de Binance (pour faire plus de dépassements et de dépassements) (version Python)
- Les stratégies de SuperTrend (enseignement)
- Trois lignes de code mettent en œuvre des stratégies de contre-indication pour l'apprentissage automatique d'Argos pour interpréter rapidement les nouvelles de l'industrie
- Le stockage local
- La stratégie de lancer des pièces (●'
'●) - SuperTrend V1
- Les stratégies de fluctuation facile
- RecordsCollecter (enseignement)
- Super-crash, super-bête et super-bête
- Stratégie 2: éliminer les hauts et les bas
- Le contrat est passé
- Binance stratégie de couverture de devises multi-monnaie durable version originale (faire plus de dépassement de dépassement de dépassement de dépassement) 13 avril dernier module stop loss
- La stratégie de couverture de la monnaie monétaire permanente de Binance (l'indice monétaire monétaire monétaire) améliorée le 10 avril Bug, nécessitant une mise à jour
- Le MACD est en baisse, les achats et les ventes sont automatiques, le compte à rebours s'arrête
- Le robot est le premier à être mis en bourse
- Les plateformes de couverture de la stabilité
- Une ligne droite
- La plage
NulIl n'y a pas de disque.
Je suis Johnny.Est-ce qu'il y a une limite à la valeur maximale à insérer?
Je suis zéro.Si le graphique dispose d'une API pour contrôler l'affichage et l'occultation des courbes / graphiques