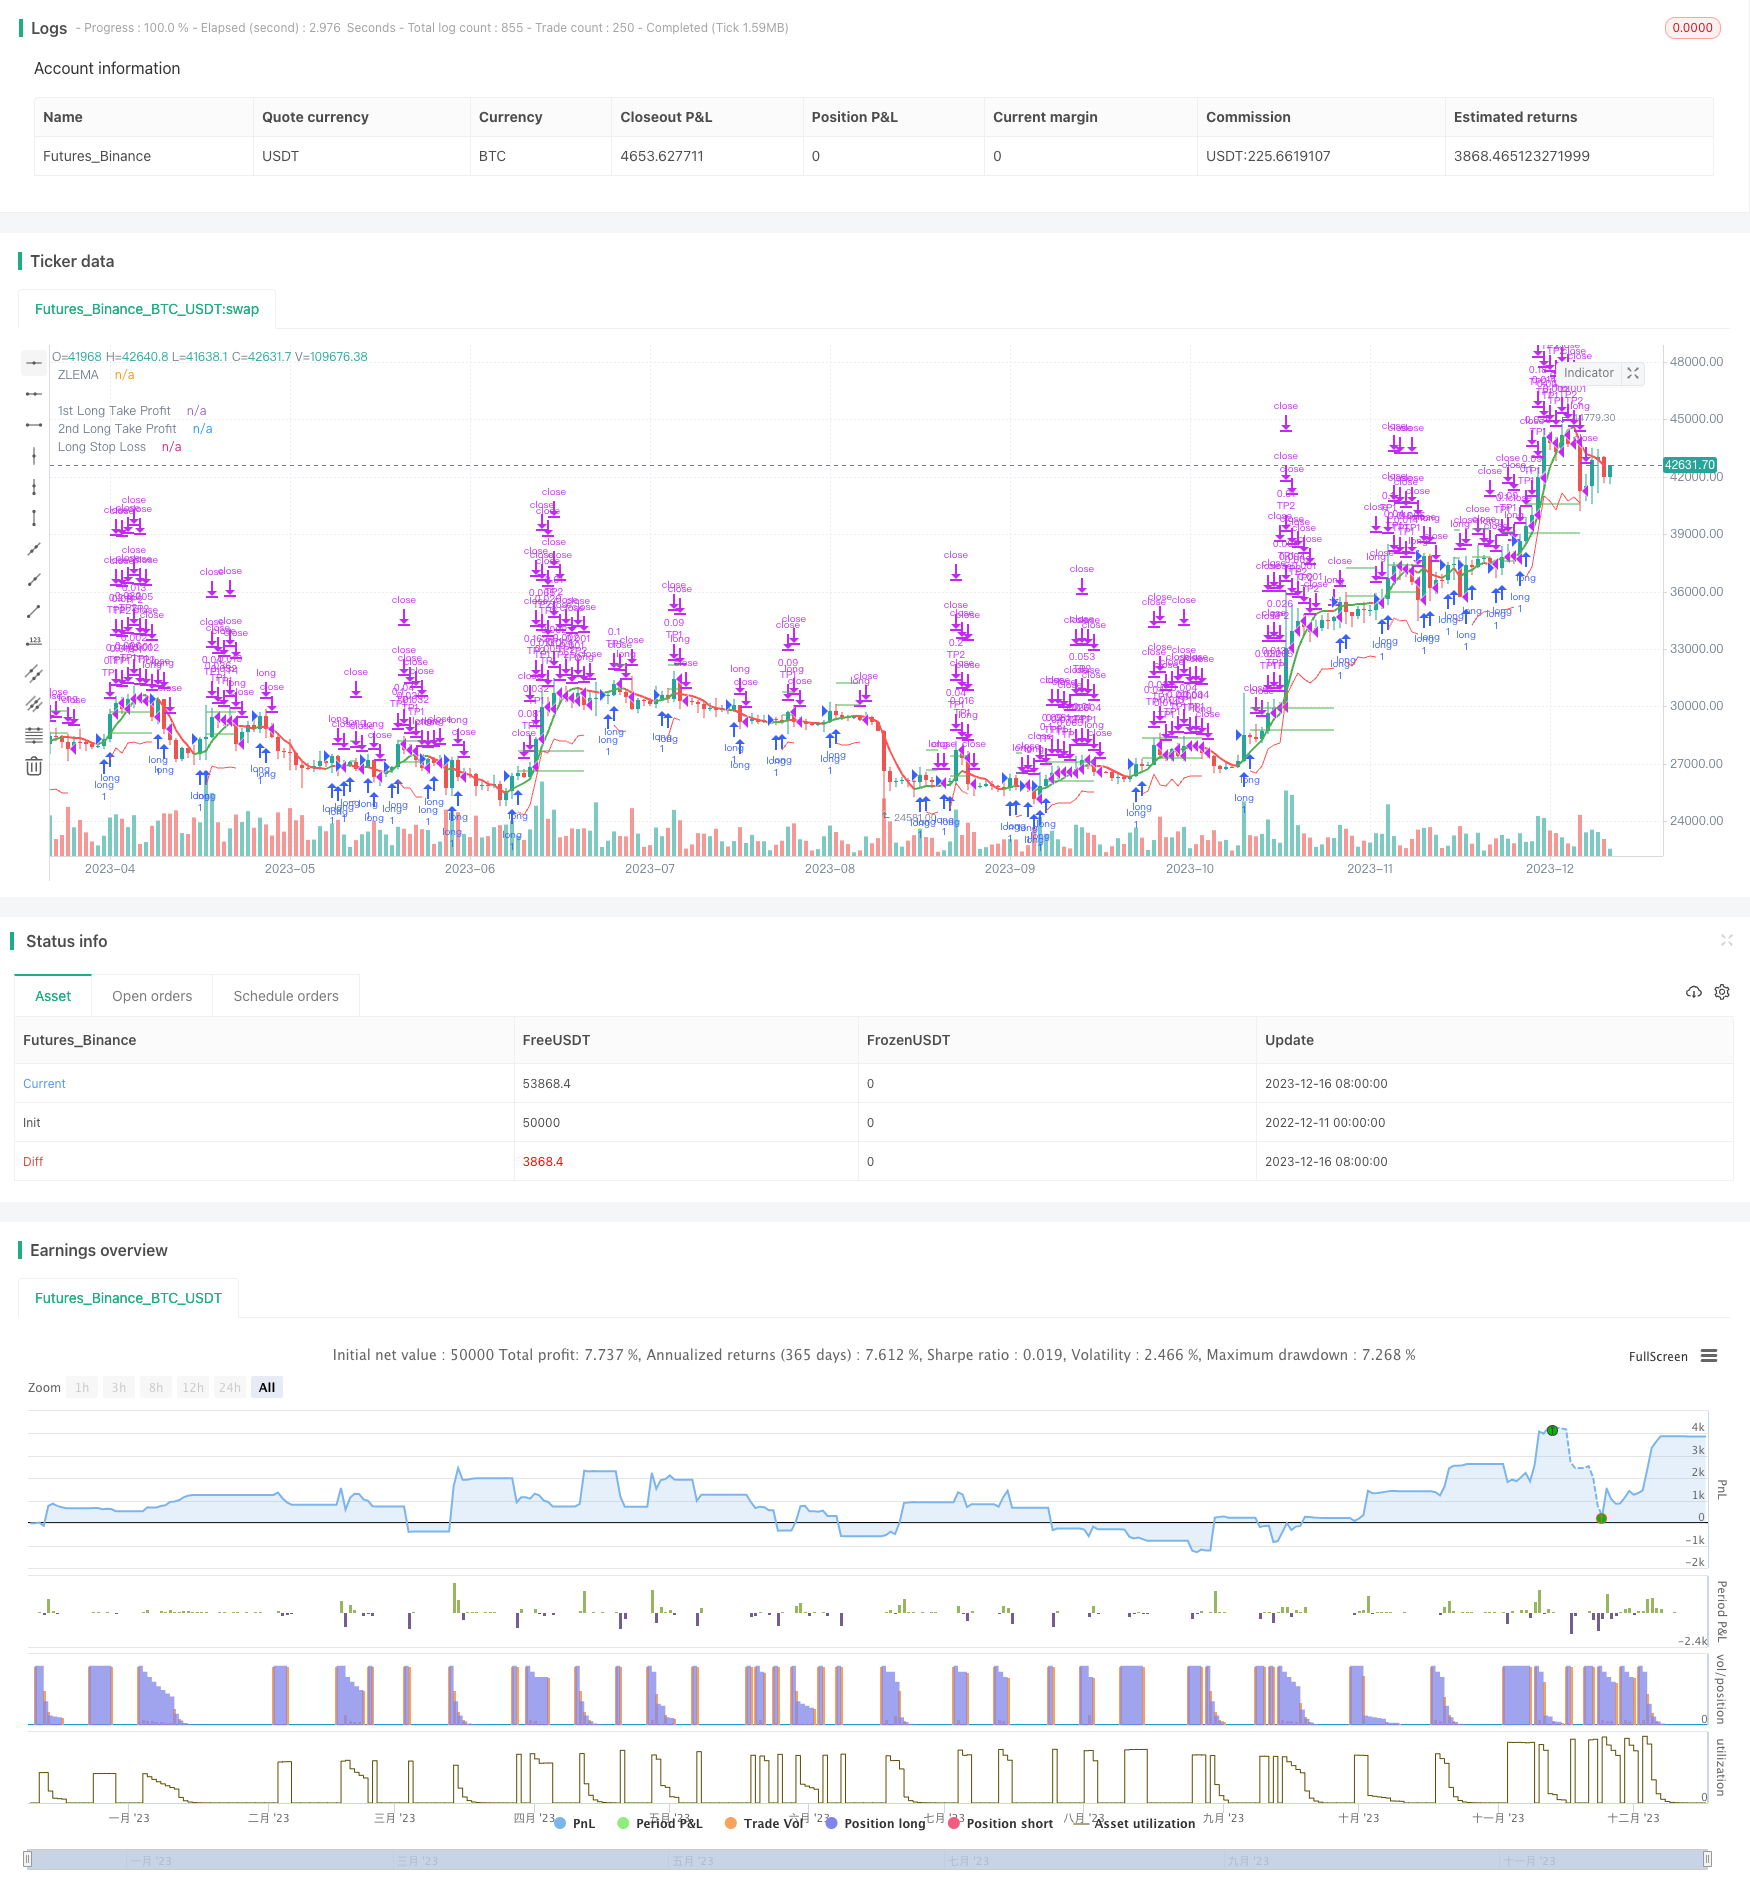
Stratégie de positionnement de moyenne mobile SMA solide et fiable

Aperçu
La stratégie est une simple stratégie de détention de position basée sur la moyenne SMA. Lorsque la ligne SMA courte est traversée par la ligne SMA longue, la position est surchargée; lorsque la ligne SMA courte est traversée par la ligne SMA longue, la position est en baisse.
Principe de stratégie
La stratégie utilise deux courbes moyennes SMA, une courte courbe de 20 jours et une longue courbe de 50 jours. La courbe courte permet de capturer plus rapidement les tendances de variation des prix et la longue courbe filtre le bruit à court terme.
Dans l’ensemble, la stratégie utilise les caractéristiques de la courbe de la moyenne SMA pour juger de la tendance du mouvement des prix sur deux dimensions temporelles et profite d’une position plus stable.
Analyse des avantages
Cette stratégie présente les avantages suivants:
- L’opération est simple, facile à comprendre, le seuil est bas.
- La stabilité relative grâce à l’avantage de la moyenne SMA
- Les détenteurs de positions à long terme sont moins exposés au bruit des marchés à court terme.
- Moins de paramètres à configurer, plus facile à optimiser pour trouver la meilleure combinaison de paramètres
Analyse des risques
La stratégie présente également les risques suivants:
- Les stops sont plus susceptibles d’être effectués lorsque les marchés sont en perte de vitesse.
- La moyenne SMA est retardée et ne capte pas les variations de prix en temps opportun
- L’incapacité de tirer profit de la reprise à court terme
- La taille des pertes individuelles est hors de contrôle
Direction d’optimisation
La stratégie peut également être optimisée dans les domaines suivants:
- Le moment est venu de rejoindre le MACD pour juger de la reprise du bas afin de réduire les pertes dans un contexte de choc
- Tester les combinaisons moyennes et linéaires SMA de différents paramètres pour trouver le paramètre optimal
- L’ajout d’indicateurs nationaux pour dévier de la tendance et améliorer l’exactitude de l’ouverture des positions
- Augmentation des stratégies de stop-loss et maîtrise des pertes individuelles
Résumer
Dans l’ensemble, la stratégie de détention de positions en SMA est stable, simple, facile à utiliser et adaptée aux débutants. Avec l’évolution continue des transactions quantifiées, la stratégie peut être optimisée par l’introduction de plus d’indicateurs et de moyens techniques pour obtenir de meilleurs résultats.
/*backtest
start: 2022-12-11 00:00:00
end: 2023-12-17 00:00:00
period: 1d
basePeriod: 1h
exchanges: [{"eid":"Futures_Binance","currency":"BTC_USDT"}]
*/

//@version=5
strategy('Zlema Strateg Long 5m', overlay=true )

// FUNCTIONS

Atr(p) =>
    atr = 0.
    Tr = math.max(high - low, math.max(math.abs(high - close[1]), math.abs(low - close[1])))
    atr := nz(atr[1] + (Tr - atr[1]) / p, Tr)
    atr

// ZLEMA
length = input(title='Length', defval=14)
highlightMovements = input(title='Highlight Movements ?', defval=true)
src = input(title='Source', defval=close)

lag = math.floor((length - 1) / 2)

zlema = ta.ema(src + src - src[lag], length)

zlemaColor = highlightMovements ? zlema > zlema[1] ? color.green : color.red : #6d1e7f
plot(zlema, title='ZLEMA', linewidth=2, color=zlemaColor, transp=0)


// TAKE PROFIT AND STOP LOSS
long_tp1_inp = input.float(1, title='Long Take Profit 1 %', step=0.1) / 100
long_tp1_qty = input.int(10, title='Long Take Profit 1 Qty', step=1)

long_tp2_inp = input.float(5, title='Long Take Profit 2%', step=0.1) / 100
long_tp2_qty = input.int(50, title='Long Take Profit 2 Qty', step=1)

long_take_level_1 = strategy.position_avg_price * (1 + long_tp1_inp)
long_take_level_2 = strategy.position_avg_price * (1 + long_tp2_inp)


// Stop Loss
multiplier = input.float(2.2, 'SL Mutiplier', minval=1, step=0.1)
ATR_period = input.int(17, 'ATR period', minval=1, step=1)

// Strategy
entry_long = zlema > zlema[1]
entry_price_long = ta.valuewhen(entry_long, close, 0)
SL_floating_long = entry_price_long - multiplier * Atr(ATR_period)
exit_long = zlema < zlema[1]

///// BACKTEST PERIOD ///////
testStartYear = input(2022, 'Backtest Start Year')
testStartMonth = input(1, 'Backtest Start Month')
testStartDay = input(1, 'Backtest Start Day')
testPeriodStart = timestamp(testStartYear, testStartMonth, testStartDay, 0, 0)

testStopYear = input(9999, 'Backtest Stop Year')
testStopMonth = input(12, 'Backtest Stop Month')
testStopDay = input(31, 'Backtest Stop Day')
testPeriodStop = timestamp(testStopYear, testStopMonth, testStopDay, 0, 0)

testPeriod() =>
    time >= testPeriodStart and time <= testPeriodStop ? true : false

if testPeriod()
    strategy.entry('long', strategy.long, comment='Long', when=entry_long)
    strategy.exit('TP1', 'long', qty_percent=long_tp1_qty, limit=long_take_level_1)  //, trail_points=entry_price_long * long_trailing / syminfo.mintick, trail_offset=entry_price_long * long_trailing / syminfo.mintick)
    strategy.exit('TP2', qty_percent=long_tp2_qty, limit=long_take_level_2)  //, trail_points=entry_price_long * long_trailing / syminfo.mintick, trail_offset=entry_price_long * long_trailing / syminfo.mintick)
    strategy.close('long', when=exit_long, comment='exit long')


// LONG POSITION
plot(strategy.position_size > 0 ? long_take_level_1 : na, style=plot.style_linebr, color=color.new(color.green, 0), linewidth=1, title='1st Long Take Profit')
plot(strategy.position_size > 0 ? long_take_level_2 : na, style=plot.style_linebr, color=color.new(color.green, 0), linewidth=1, title='2nd Long Take Profit')
plot(strategy.position_size > 0 ? SL_floating_long : na, style=plot.style_linebr, color=color.new(color.red, 0), linewidth=1, title='Long Stop Loss')


if testPeriod()
    strategy.entry('long', strategy.long, comment='Long', when=entry_long)


// LONG POSITIONplot(strategy.position_size > 0 ? SL_floating_long : na, style=plot.style_linebr, color=color.new(color.red, 0), linewidth=1, title='Long Stop Loss')