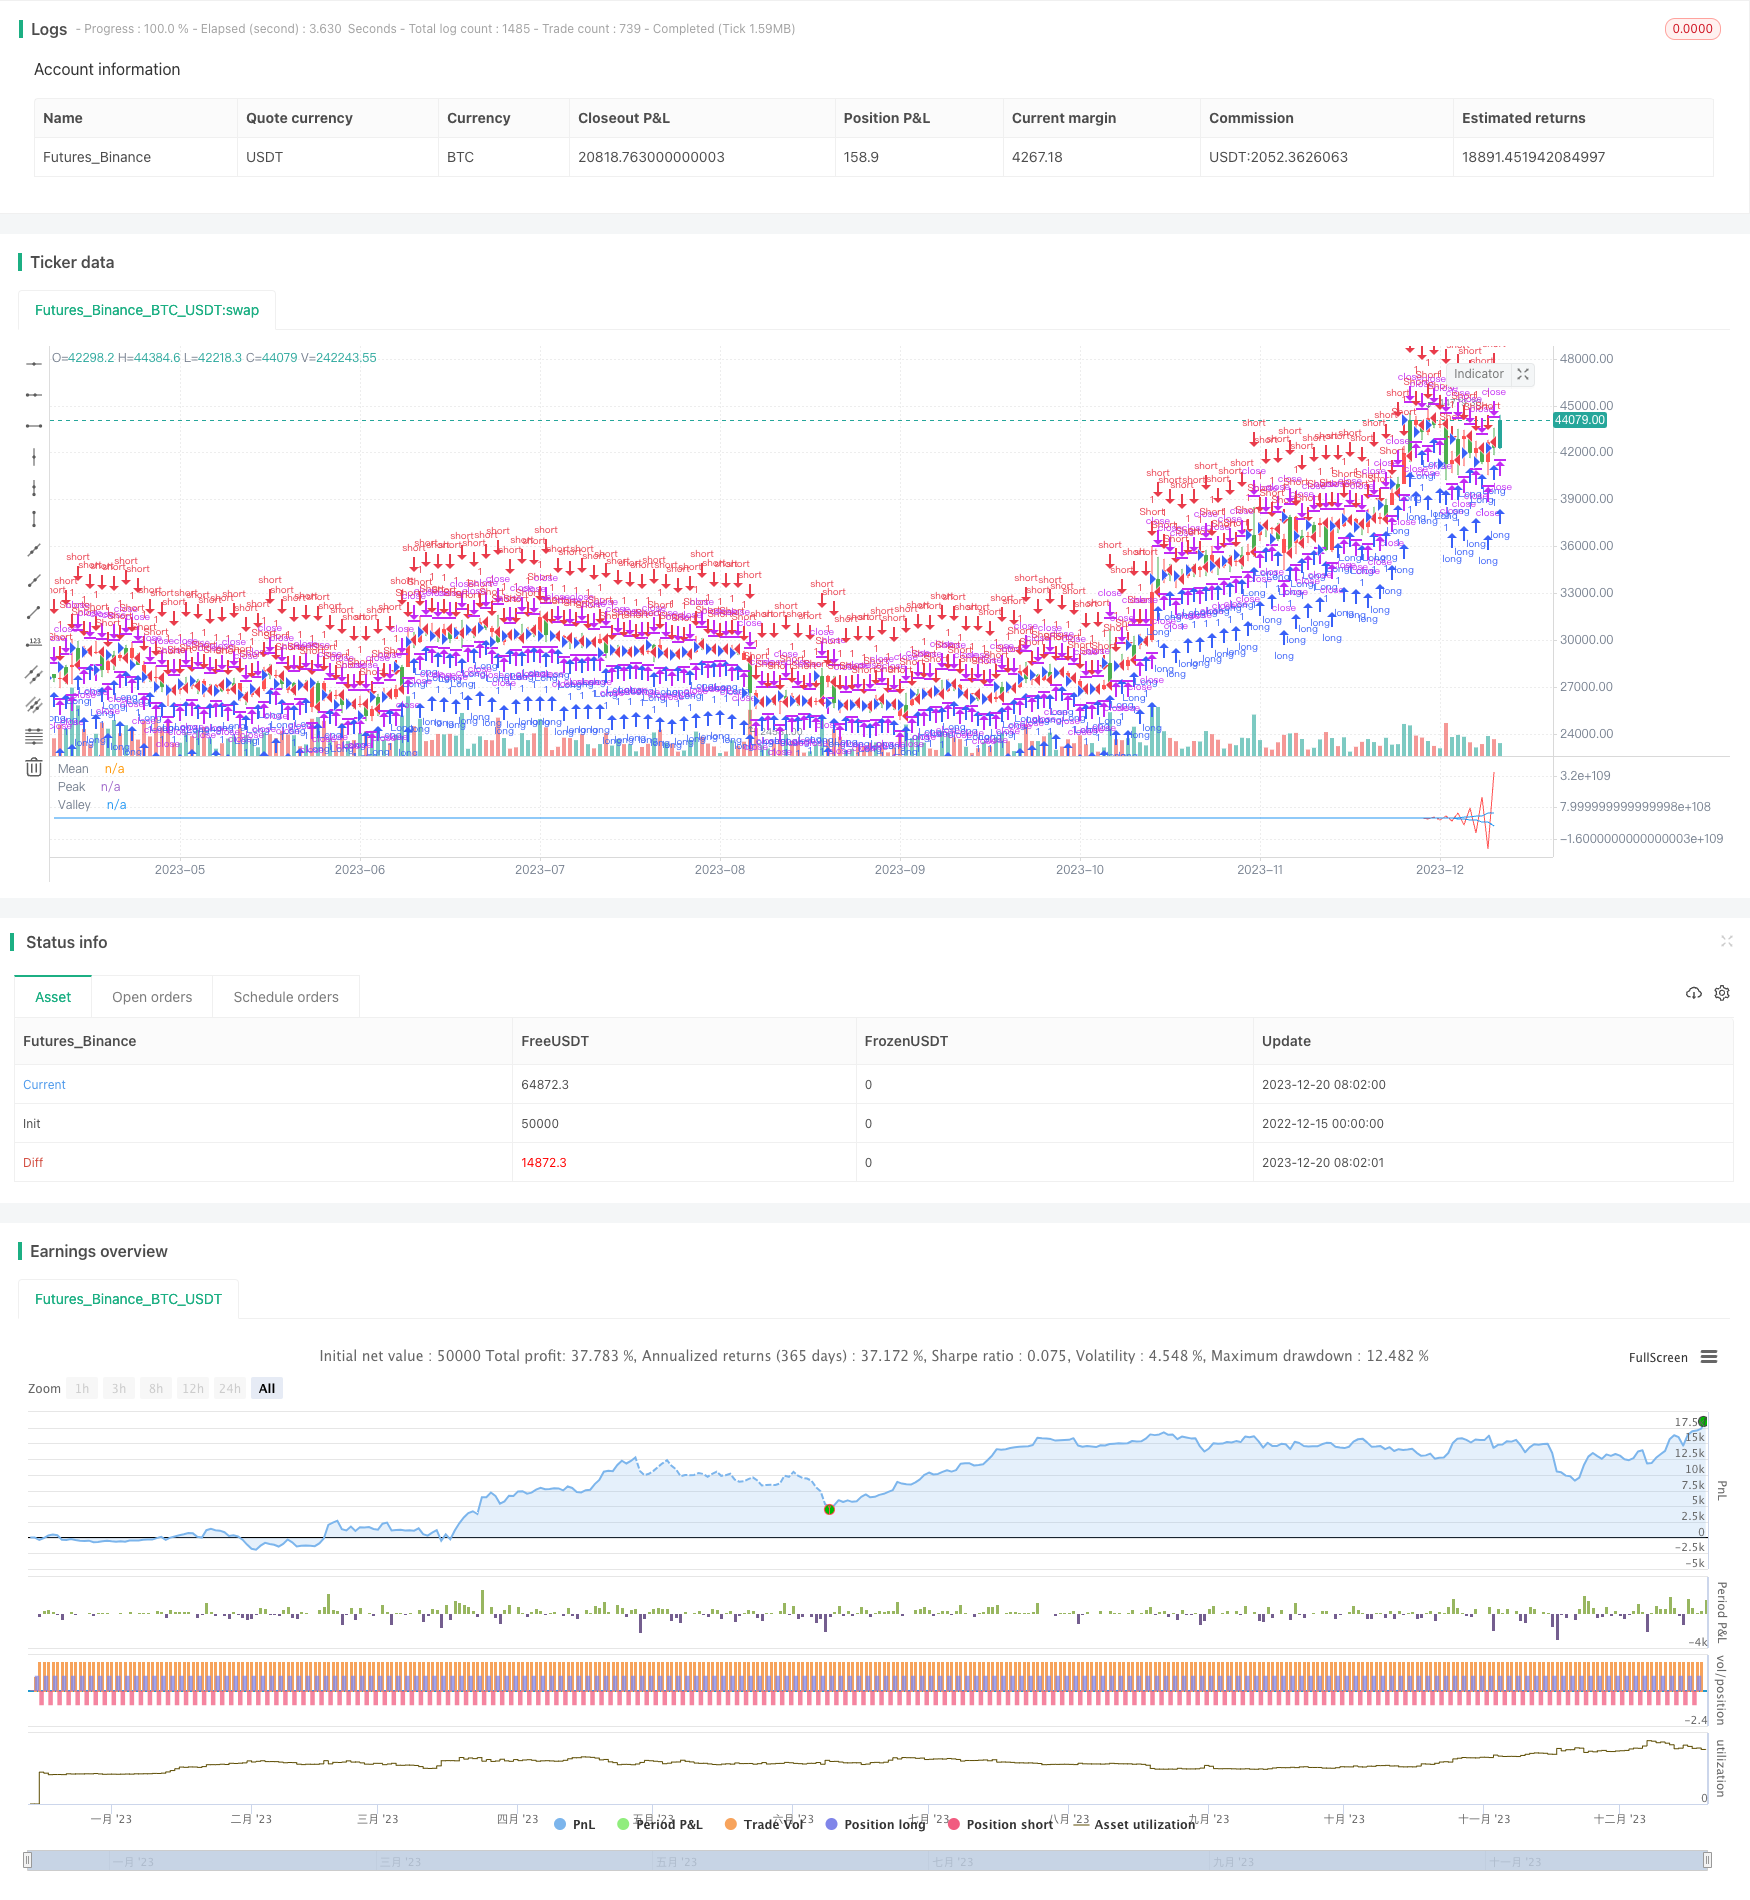
Stratégie de trading quantitative basée sur la décomposition des modes empiriques

Aperçu
Cette stratégie est basée sur la décomposition en mode empirique (EMD), qui consiste à décomposer la séquence de prix, à extraire les caractéristiques des différentes bandes et à générer des signaux de négociation en combinaison avec la valeur moyenne. Cette stratégie s’applique principalement aux positions de ligne moyenne et longue.
Principe de stratégie
- Utilisez la méthode EMD pour filtrer les prix et extraire les caractéristiques de fluctuation des prix
- Calculer la moyenne mobile des séquences de sommets et de vallées
- Générer un signal de transaction lorsque la moyenne dépasse un certain pourcentage de la ligne de crête et de la vallée
- Faire un plus ou un moins selon le signal de transaction
Analyse des avantages
- La méthode EMD permet de décomposer efficacement les séquences de prix et d’extraire des caractéristiques utiles
- La ligne de crête et de vallée contrôle la stratégie de négociation uniquement lorsque les fluctuations de prix sont supérieures à une certaine amplitude
- La combinaison de la moyenne et de la moyenne permet d’éliminer efficacement les fausses percées.
Analyse des risques
- Une mauvaise sélection des paramètres de la méthode EMD peut entraîner une suradaptation
- Il faut des cycles plus longs pour former un signal de transaction, ce qui ne s’adapte pas aux transactions à haute fréquence.
- Les prix des produits alimentaires sont en effet très volatiles.
Direction d’optimisation
- Optimiser les paramètres du modèle EMD pour une meilleure adaptation au marché
- Combiné à d’autres indicateurs comme signal d’arrêt de perte
- Essayez différentes séquences de prix comme entrée stratégique
Résumer
Cette stratégie utilise une méthode d’extraction des caractéristiques de la séquence de prix par modélisation empirique et génère des signaux de négociation basés sur les caractéristiques extraites, pour réaliser une stratégie de négociation de ligne moyenne et longue stable. L’avantage de cette stratégie réside dans la capacité d’identifier efficacement les caractéristiques cycliques des prix et d’émettre des instructions de négociation dans des fluctuations importantes.
/*backtest
start: 2022-12-15 00:00:00
end: 2023-12-21 00:00:00
period: 1d
basePeriod: 1h
exchanges: [{"eid":"Futures_Binance","currency":"BTC_USDT"}]
*/

//@version=2
////////////////////////////////////////////////////////////
//  Copyright by HPotter v1.0 12/04/2017
// The related article is copyrighted material from Stocks & Commodities Mar 2010
// You can use in the xPrice any series: Open, High, Low, Close, HL2, HLC3, OHLC4 and ect...
//
// You can change long to short in the Input Settings
// Please, use it only for learning or paper trading. Do not for real trading.
////////////////////////////////////////////////////////////
strategy(title="Empirical Mode Decomposition")
Length = input(20, minval=1)
Delta = input(0.5)
Fraction = input(0.1)
reverse = input(false, title="Trade reverse")
xPrice = hl2
beta = cos(3.1415 * (360 / Length) / 180)
gamma = 1 / cos(3.1415 * (720 * Delta / Length) / 180)
alpha = gamma - sqrt(gamma * gamma - 1)
xBandpassFilter = 0.5 * (1 - alpha) * (xPrice - xPrice[2]) + beta * (1 + alpha) * nz(xBandpassFilter[1]) - alpha * nz(xBandpassFilter[2])
xMean = sma(xBandpassFilter, 2 * Length)
xPeak =  iff (xBandpassFilter[1] > xBandpassFilter and xBandpassFilter[1] > xBandpassFilter[2], xBandpassFilter[1], nz(xPeak[1]))
xValley =  iff (xBandpassFilter[1] < xBandpassFilter and xBandpassFilter[1] < xBandpassFilter[2], xBandpassFilter[1], nz(xValley[1]))
xAvrPeak = sma(xPeak, 50)
xAvrValley = sma(xValley, 50)
nAvrPeak = Fraction * xAvrPeak
nAvrValley = Fraction * xAvrValley
pos = iff(xMean > nAvrPeak and xMean > nAvrValley, 1,
	     iff(xMean < nAvrPeak and xMean < nAvrValley, -1, nz(pos[1], 0)))
possig = iff(reverse and pos == 1, -1,
          iff(reverse and pos == -1, 1, pos))
if (possig == 1)
    strategy.entry("Long", strategy.long)
if (possig == -1)
    strategy.entry("Short", strategy.short)
barcolor(possig == -1 ? red: possig == 1 ? green : blue )
plot(xMean, color=red, title="Mean")
plot(nAvrPeak, color=blue, title="Peak")
plot(nAvrValley, color=blue, title="Valley")