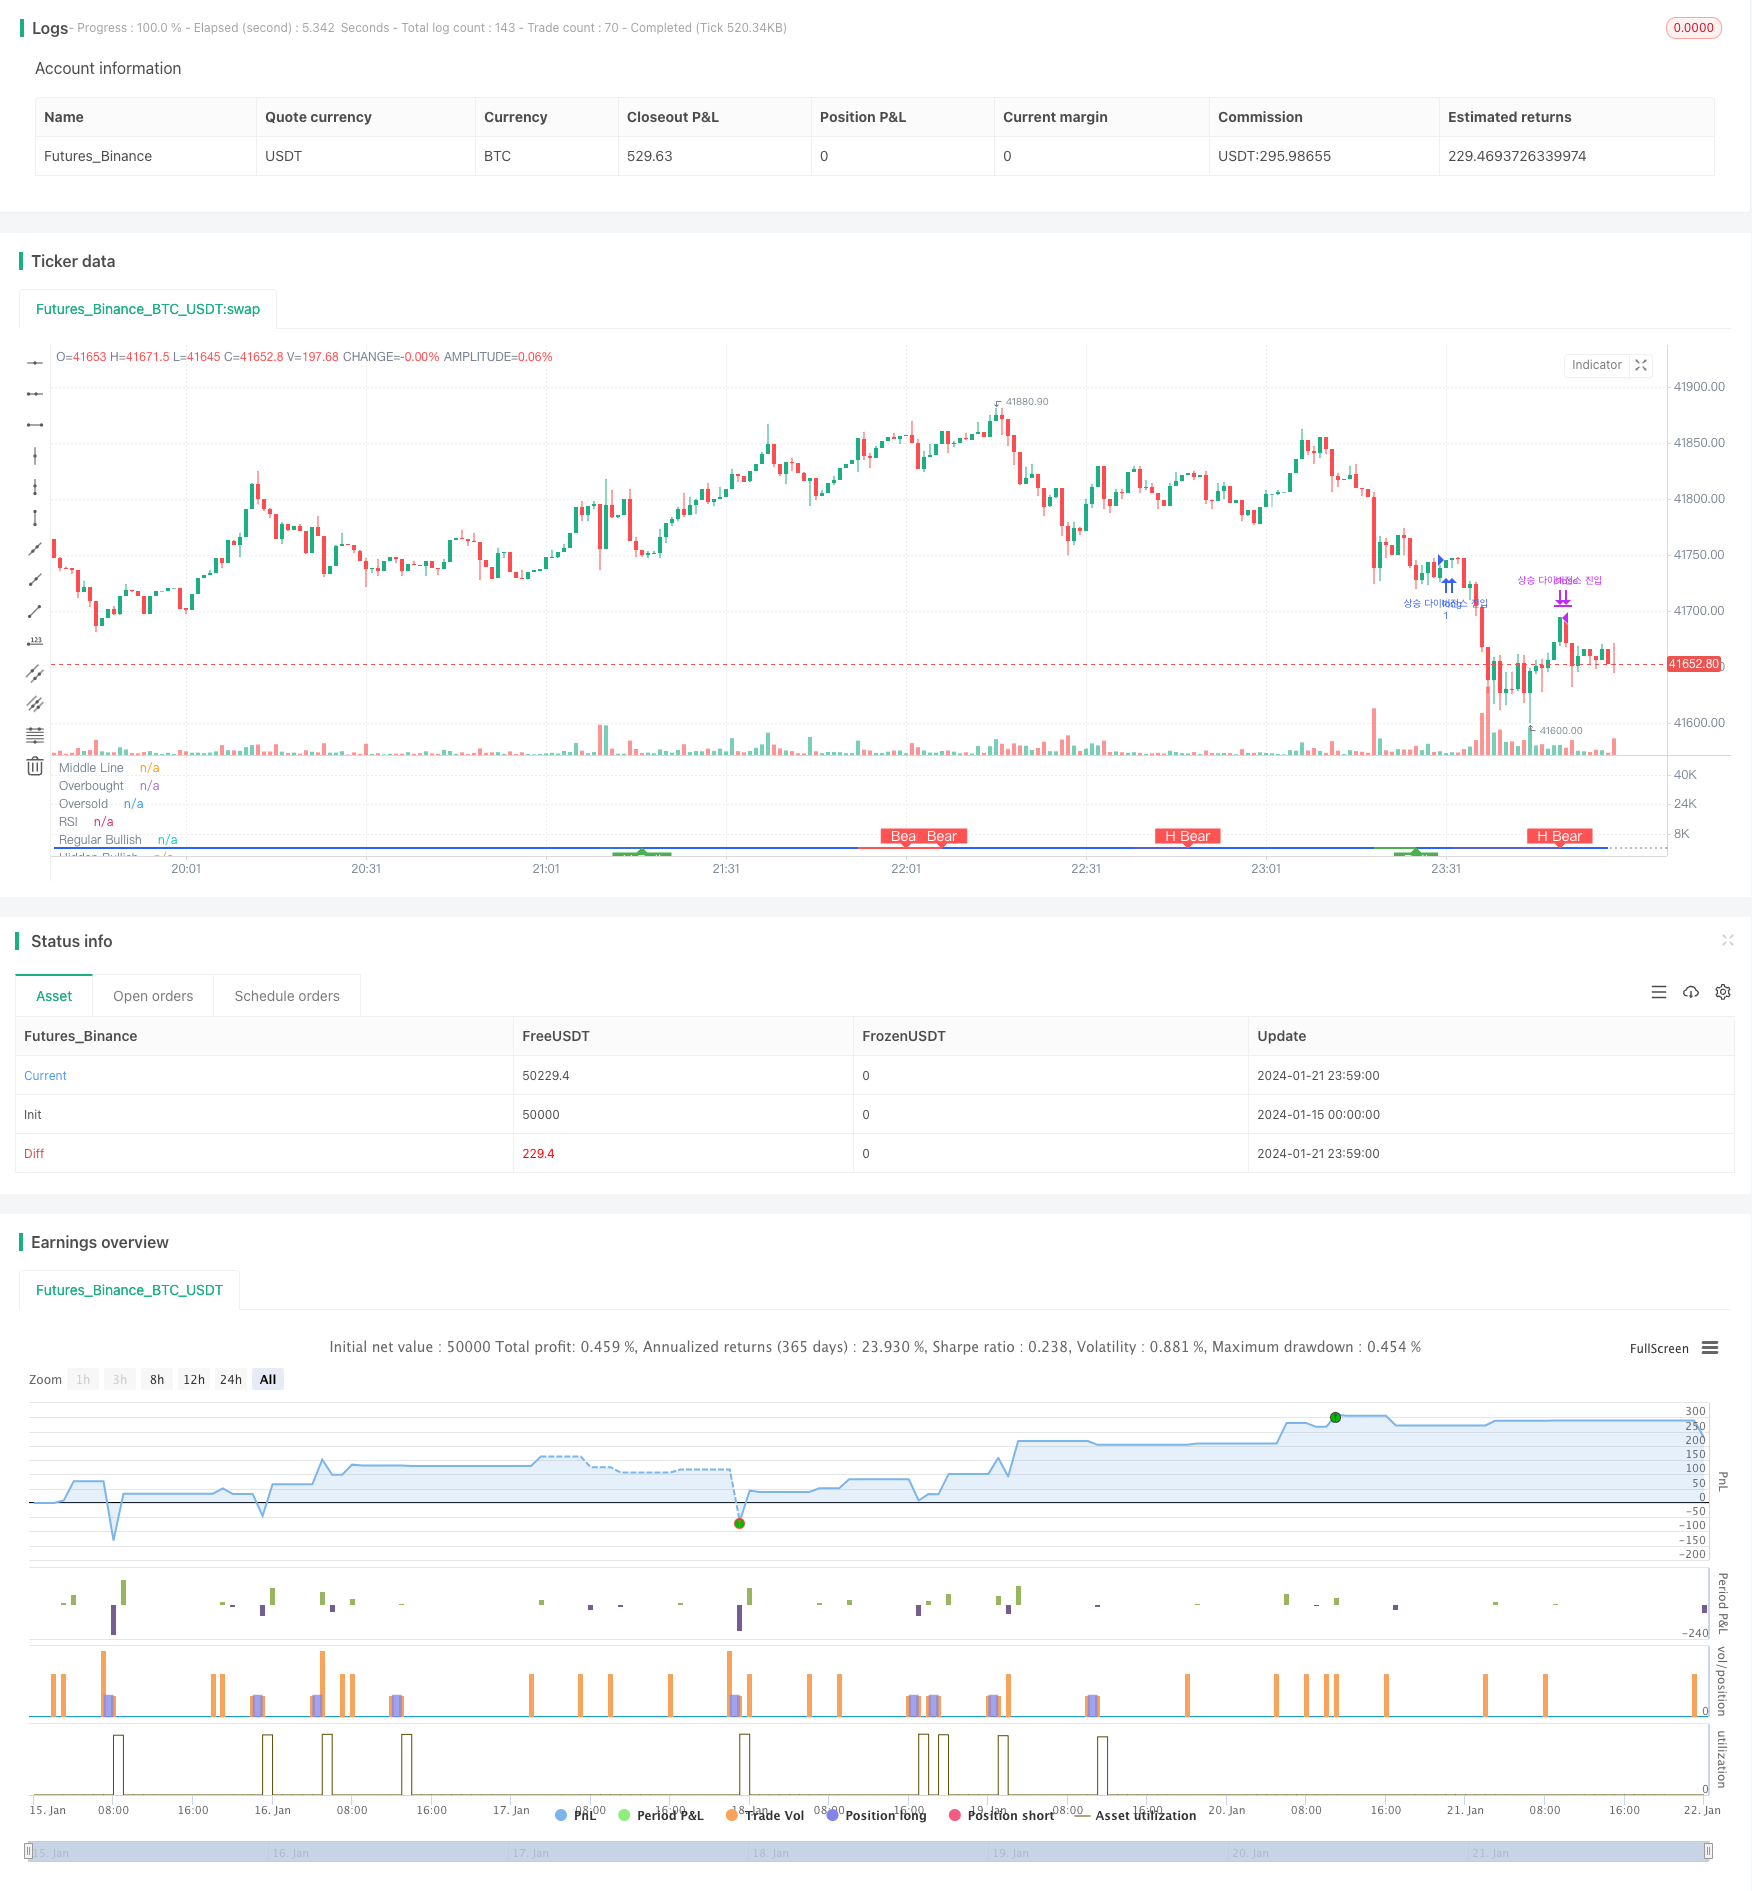
Stratégie de trading de divergence RSI

Aperçu
La stratégie de trading de divergence du RSI consiste à analyser la divergence du RSI par rapport au prix et à détecter les opportunités de divergence de valeur.
Principe de stratégie
Cette stratégie est basée sur la différence de valeur entre l’indicateur RSI et le prix lors d’une déviation. L’indicateur RSI reflète la force et la faiblesse, le prix reflète la relation d’offre et de demande. Lorsque les deux sont en désaccord, cela indique que le marché a un prix erroné et peut être acheté à découvert ou survendu à profit.
Concrètement, la divergence polyvalente habituelle est que le RSI forme des points plus élevés et plus bas, tandis que les prix forment des points plus bas. Cela signifie que le marché, bien qu’apparemment baissier, a en fait des signes de rebond accumulé.
La divergence de la tête vide habituelle est le contraire, le RSI forme des sommets plus bas et les prix des sommets plus élevés. Cela signifie que le marché est superficiellement optimiste, mais qu’il montre des signes de faiblesse interne.
En outre, il y a des divergences cachées et des divergences de tête vide. Dans ce cas, la relation entre le RSI et le prix est le contraire de celle des divergences conventionnelles, mais le principe est le même et les bénéfices sont également possibles.
Avantages stratégiques
- Capturer les écarts de valeur et détecter les erreurs de prix du marché
- Le prix de l’action est le plus élevé de tous les indicateurs de l’activité.
- Il est important de distinguer les divergences et de couvrir les opportunités.
Analyse des risques
- Il existe également des divergences dans des situations de marché particulières qui nécessitent une identification.
- Le taux de victoires au-dessus de la barre des 50 n’est pas élevé et peut être optimisé de manière appropriée.
- Les erreurs dans le choix d’une direction plurielle peuvent entraîner des pertes plus importantes
Direction d’optimisation
- Optimiser les paramètres du RSI pour améliorer la précision des prévisions des indicateurs
- Les signaux de jugement associés à d’autres indicateurs sont éloignés de la divergence
- Évaluer le risque de sur-déclenchement des opérations de courtage et de prise de bénéfices, contrôler les pertes et les profits individuels
Résumer
La stratégie de divergence de l’indicateur RSI est une stratégie de arbitrage statistique typique. L’avantage de cette stratégie réside dans la détection en temps opportun des opportunités de renversement de tendance, le risque réside dans l’exactitude de l’identification de la divergence.
/*backtest
start: 2024-01-15 00:00:00
end: 2024-01-22 00:00:00
period: 1m
basePeriod: 1m
exchanges: [{"eid":"Futures_Binance","currency":"BTC_USDT"}]
*/

//@version=5
strategy(title="Divergence Indicator")
len = input.int(title="RSI Period", minval=1, defval=14)
src = input(title="RSI Source", defval=close)
lbR = input(title="Pivot Lookback Right", defval=5)
lbL = input(title="Pivot Lookback Left", defval=5)
rangeUpper = input(title="Max of Lookback Range", defval=60)
rangeLower = input(title="Min of Lookback Range", defval=5)
plotBull = input(title="Plot Bullish", defval=true)
plotHiddenBull = input(title="Plot Hidden Bullish", defval=true)
plotBear = input(title="Plot Bearish", defval=true)
plotHiddenBear = input(title="Plot Hidden Bearish", defval=true)
bearColor = color.red
bullColor = color.green
hiddenBullColor = color.new(color.green, 80)
hiddenBearColor = color.new(color.red, 80)
textColor = color.white
noneColor = color.new(color.white, 100)
osc = ta.rsi(src, len)

plot(osc, title="RSI", linewidth=2, color=#2962FF)
hline(50, title="Middle Line", color=#787B86, linestyle=hline.style_dotted)
obLevel = hline(70, title="Overbought", color=#787B86, linestyle=hline.style_dotted)
osLevel = hline(30, title="Oversold", color=#787B86, linestyle=hline.style_dotted)
fill(obLevel, osLevel, title="Background", color=color.rgb(33, 150, 243, 90))

plFound = na(ta.pivotlow(osc, lbL, lbR)) ? false : true
phFound = na(ta.pivothigh(osc, lbL, lbR)) ? false : true
_inRange(cond) =>
	bars = ta.barssince(cond == true)
	rangeLower <= bars and bars <= rangeUpper

//------------------------------------------------------------------------------
// Regular Bullish
// Osc: Higher Low

oscHL = osc[lbR] > ta.valuewhen(plFound, osc[lbR], 1) and _inRange(plFound[1])

// Price: Lower Low

priceLL = low[lbR] < ta.valuewhen(plFound, low[lbR], 1)
// bull : 상승 Condition : 조건
bullCond = plotBull and priceLL and oscHL and plFound // 상승다이버전스?
strategy.entry("상승 다이버전스 진입", strategy.long, when = bullCond)
strategy.close("상승 다이버전스 진입", when = ta.crossover(osc, 50))
plot(
     plFound ? osc[lbR] : na,
     offset=-lbR,
     title="Regular Bullish",
     linewidth=2,
     color=(bullCond ? bullColor : noneColor)
     )

plotshape(
	 bullCond ? osc[lbR] : na,
	 offset=-lbR,
	 title="Regular Bullish Label",
	 text=" Bull ",
	 style=shape.labelup,
	 location=location.absolute,
	 color=bullColor,
	 textcolor=textColor
	 )

//------------------------------------------------------------------------------
// Hidden Bullish
// Osc: Lower Low

oscLL = osc[lbR] < ta.valuewhen(plFound, osc[lbR], 1) and _inRange(plFound[1])

// Price: Higher Low

priceHL = low[lbR] > ta.valuewhen(plFound, low[lbR], 1)
hiddenBullCond = plotHiddenBull and priceHL and oscLL and plFound
// strategy.entry("히든 상승 다이버전스 진입", strategy.long, when = hiddenBullCond)
// strategy.close("히든 상승 다이버전스 진입", when = ta.crossover(osc, 50))
plot(
	 plFound ? osc[lbR] : na,
	 offset=-lbR,
	 title="Hidden Bullish",
	 linewidth=2,
	 color=(hiddenBullCond ? hiddenBullColor : noneColor)
	 )

plotshape(
	 hiddenBullCond ? osc[lbR] : na,
	 offset=-lbR,
	 title="Hidden Bullish Label",
	 text=" H Bull ",
	 style=shape.labelup,
	 location=location.absolute,
	 color=bullColor,
	 textcolor=textColor
	 )

//------------------------------------------------------------------------------
// Regular Bearish
// Osc: Lower High

oscLH = osc[lbR] < ta.valuewhen(phFound, osc[lbR], 1) and _inRange(phFound[1])

// Price: Higher High

priceHH = high[lbR] > ta.valuewhen(phFound, high[lbR], 1)
// bear : 하락
bearCond = plotBear and priceHH and oscLH and phFound
// strategy.entry("하락 다이버전스 진입", strategy.short, when = bearCond)
// strategy.close("하락 다이버전스 진입", when = ta.crossunder(osc, 50))
plot(
	 phFound ? osc[lbR] : na,
	 offset=-lbR,
	 title="Regular Bearish",
	 linewidth=2,
	 color=(bearCond ? bearColor : noneColor)
	 )

plotshape(
	 bearCond ? osc[lbR] : na,
	 offset=-lbR,
	 title="Regular Bearish Label",
	 text=" Bear ",
	 style=shape.labeldown,
	 location=location.absolute,
	 color=bearColor,
	 textcolor=textColor
	 )

//------------------------------------------------------------------------------
// Hidden Bearish
// Osc: Higher High

oscHH = osc[lbR] > ta.valuewhen(phFound, osc[lbR], 1) and _inRange(phFound[1])

// Price: Lower High

priceLH = high[lbR] < ta.valuewhen(phFound, high[lbR], 1)

hiddenBearCond = plotHiddenBear and priceLH and oscHH and phFound
// strategy.entry("히든 하락 다이버전스 진입", strategy.short, when = hiddenBearCond)
// strategy.close("히든 하락 다이버전스 진입", when = ta.crossunder(osc, 50))
plot(
	 phFound ? osc[lbR] : na,
	 offset=-lbR,
	 title="Hidden Bearish",
	 linewidth=2,
	 color=(hiddenBearCond ? hiddenBearColor : noneColor)
	 )

plotshape(
	 hiddenBearCond ? osc[lbR] : na,
	 offset=-lbR,
	 title="Hidden Bearish Label",
	 text=" H Bear ",
	 style=shape.labeldown,
	 location=location.absolute,
	 color=bearColor,
	 textcolor=textColor
	 )