Stratégie de trading intraday basée sur l'EMA

Résumé
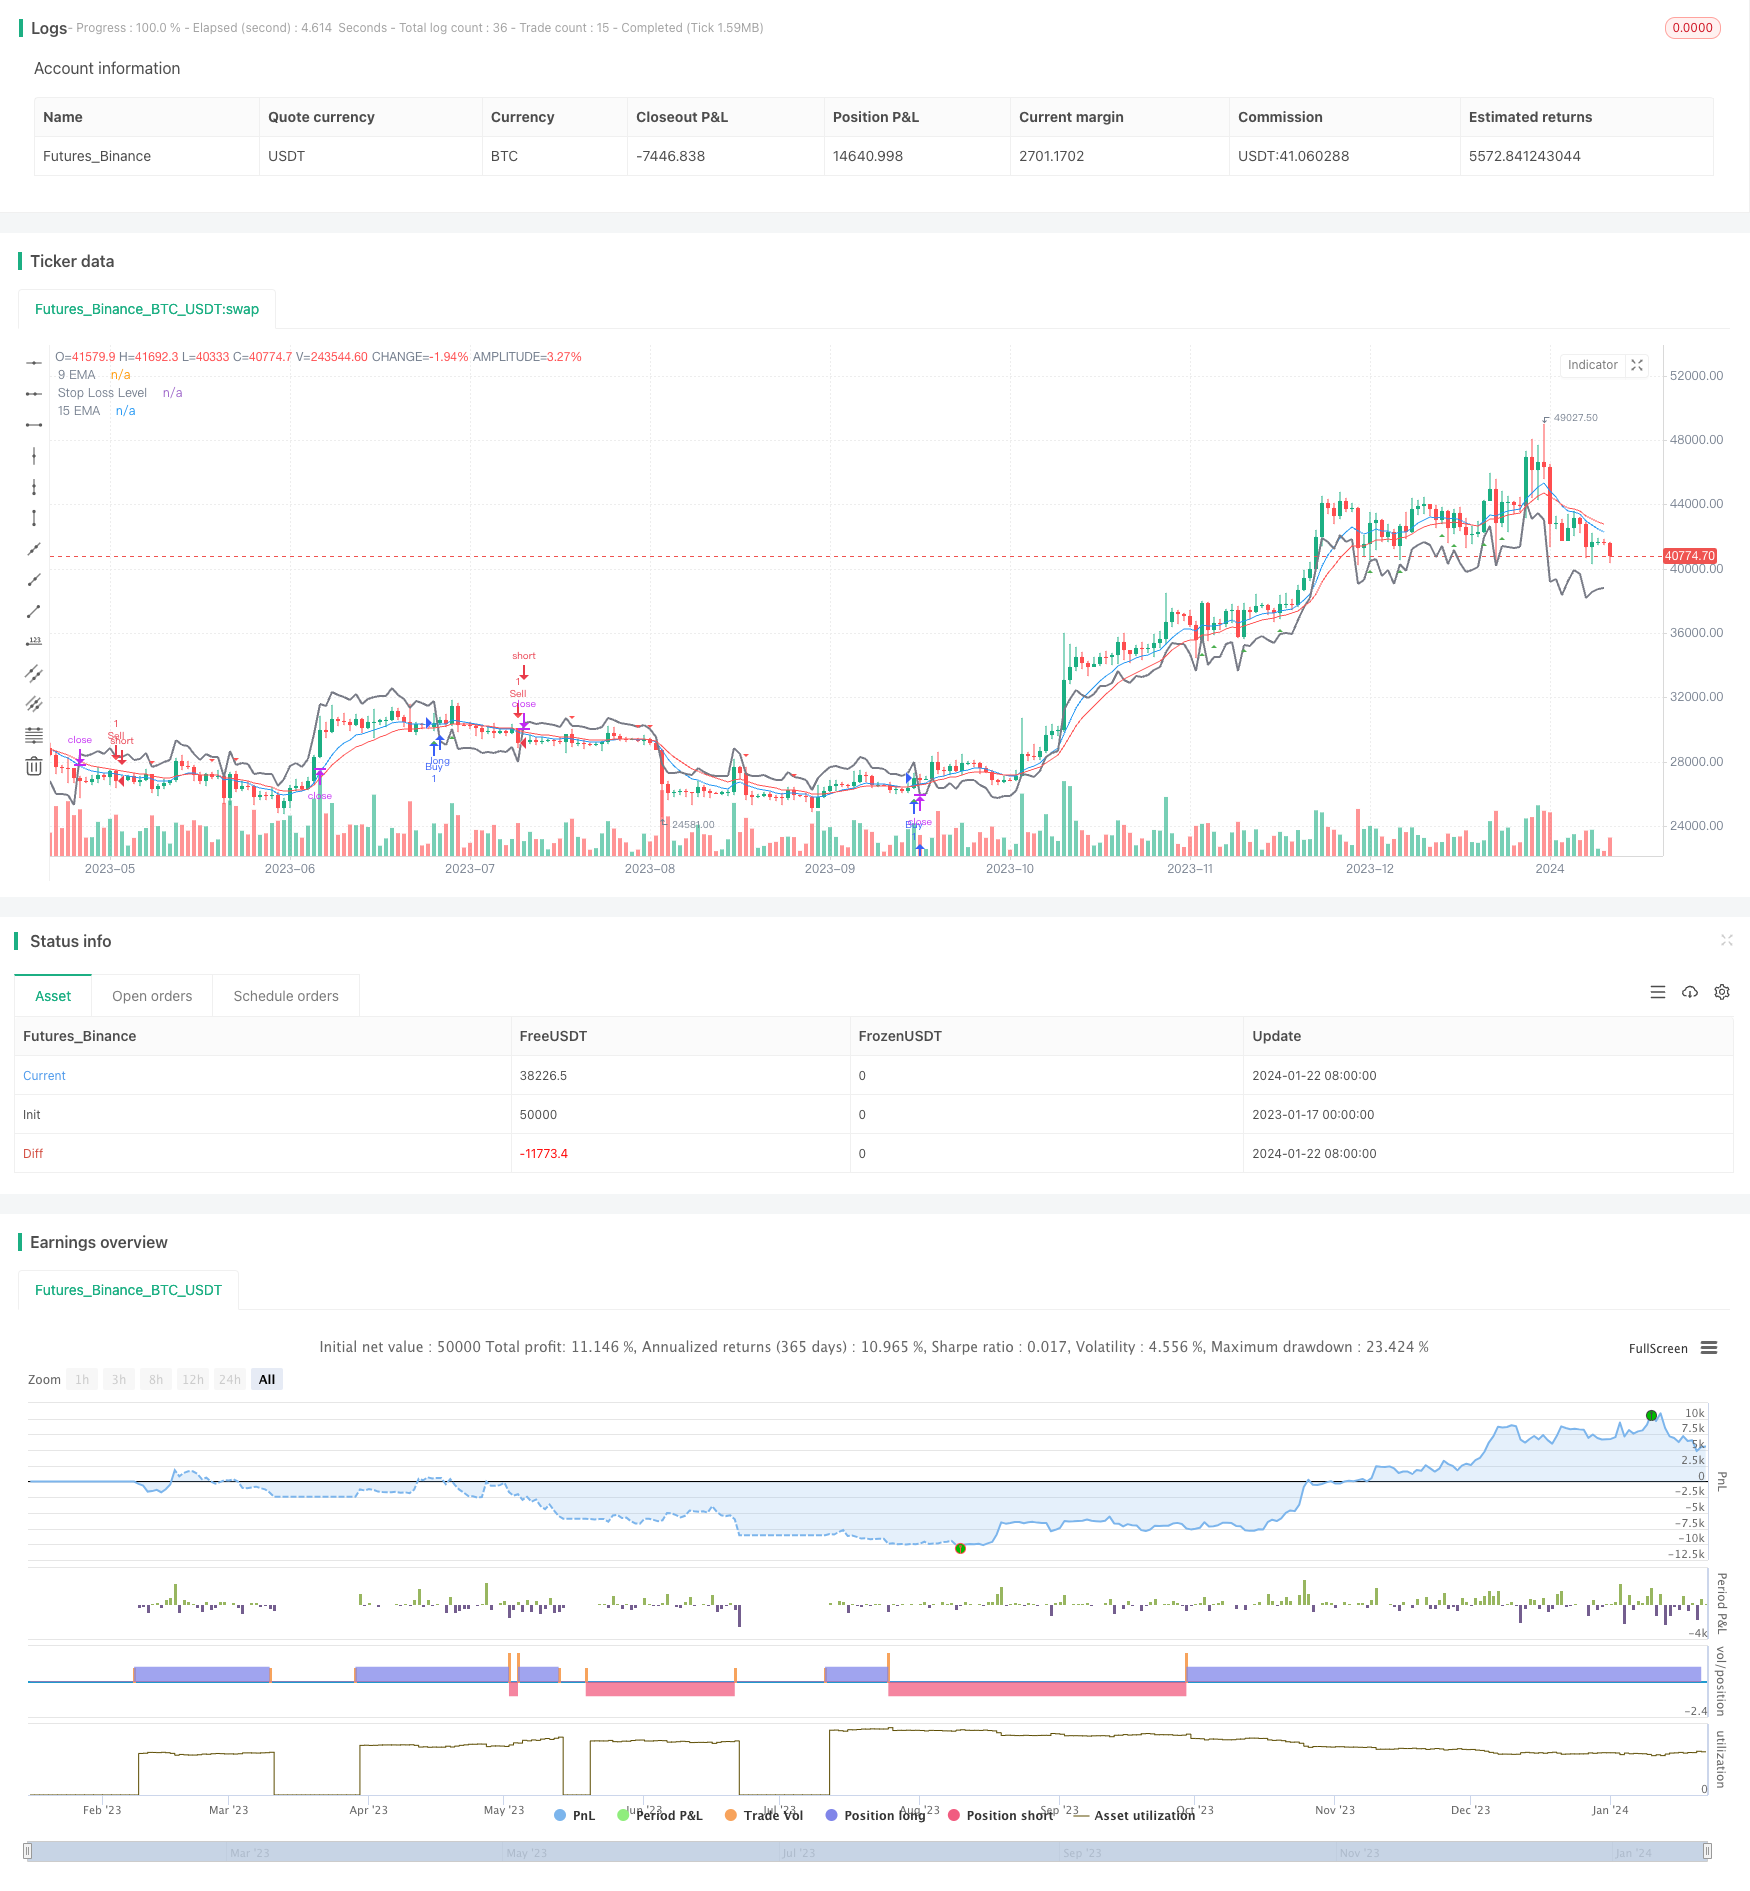
Cette stratégie utilise les signaux d’achat et de vente qui se forment dans les forks EMA et les forks morts en calculant les moyennes mobiles indicielles des 9e et 15e jours. Elle est utilisée pour traiter les courts courts de la journée. Elle génère un signal d’achat lorsqu’elle traverse 15 EMA sur 9 EMA et que la ligne K la plus proche est la ligne droite.
Principe de stratégie
- Calculer les EMA de 9 et 15 jours
- Identifier la nature de la chute de la ligne K la plus proche pour déterminer si elle est positive ou négative
- Un signal d’achat est généré lorsque 9 EMA est traversé par 15 EMA et que la ligne K la plus proche est la ligne Y
- Un signal de vente est généré lorsque 9 EMA est traversé par 15 EMA et que la ligne K la plus proche est négative.
- Calculer l’ATR à l’aide de l’indicateur ATR et tracer une ligne de stop loss lors de la tenue d’une position
Analyse des avantages
Cette stratégie présente les avantages suivants:
- Une combinaison de deux indicateurs EMA est utilisée pour capturer les tendances à court et moyen terme.
- Filtrage de faux signaux en combinaison avec la ligne K
- L’ATR utilise le stop-loss dynamique pour contrôler le risque tout en garantissant la rentabilité.
- La courte période de temps est appropriée pour exploiter les fluctuations de prix de la courte ligne pour le trading de skillet intrajournalier.
- Simple à utiliser et facile à mettre en œuvre
Analyse des risques
Cette stratégie comporte aussi des risques:
- L’EMA est en retard et risque de manquer une partie des fluctuations des prix
- La régression de la moyenne des deux EMA peut générer un signal de whipsaws
- Les transactions sur courte durée sont sujettes aux fluctuations de prix
- Une distance de rupture trop petite est facile à franchir, une distance trop grande affecte l’espace de profit
La réponse:
- Ajustement approprié des paramètres EMA pour raccourcir le cycle moyen
- Combinaison avec d’autres indicateurs tels que le MACD pour filtrer les signaux
- Ajustez dynamiquement la distance de rupture et optimiser la stratégie de rupture
Direction d’optimisation
Cette stratégie peut être optimisée dans les domaines suivants:
- Tester différentes combinaisons de paramètres EMA pour trouver la meilleure période moyenne
- Ajouter d’autres critères de jugement et construire des modèles multifactoriels
- Le filtrage des périodes de temps permet d’émettre des signaux uniquement à certaines périodes.
- Ajustement de la distance d’arrêt en combinaison avec l’indicateur de volatilité
- Paramètres d’optimisation dynamique utilisant l’apprentissage automatique
Résumer
Cette stratégie, qui intègre les deux indicateurs EMA pour déterminer la direction de la tendance et le signal de filtrage de l’entité de la ligne K, utilise l’arrêt dynamique ATR, une stratégie de trading simple et pratique. La stabilité et la rentabilité de la stratégie peuvent être encore améliorées par l’optimisation des paramètres et la combinaison de multiples facteurs.
/*backtest
start: 2023-01-17 00:00:00
end: 2024-01-23 00:00:00
period: 1d
basePeriod: 1h
exchanges: [{"eid":"Futures_Binance","currency":"BTC_USDT"}]
*/

//@version=5
strategy("EMA Scalping Strategy", shorttitle="EMAScalp", overlay=true)

// Input parameters
ema9_length = input(9, title="9 EMA Length")
ema15_length = input(15, title="15 EMA Length")

// Calculate EMAs
ema9 = ta.ema(close, ema9_length)
ema15 = ta.ema(close, ema15_length)

// Plot EMAs on the chart
plot(ema9, color=color.blue, title="9 EMA")
plot(ema15, color=color.red, title="15 EMA")

// Identify Bullish and Bearish candles
bullish_candle = close > open
bearish_candle = close < open

// Bullish conditions for Buy Signal
buy_condition = ta.crossover(close, ema9) and ema15 < ema9 and bullish_candle

// Bearish conditions for Sell Signal
sell_condition = ta.crossunder(close, ema9) and ema15 > ema9 and bearish_candle

// Plot Buy and Sell signals
plotshape(series=buy_condition, title="Buy Signal", color=color.green, style=shape.triangleup, location=location.belowbar)
plotshape(series=sell_condition, title="Sell Signal", color=color.red, style=shape.triangledown, location=location.abovebar)

// Optional: Add stop-loss levels
atr_length = input(14, title="ATR Length for Stop Loss")
atr_multiplier = input(1.5, title="ATR Multiplier for Stop Loss")

atr_value = ta.atr(atr_length)
stop_loss_level = strategy.position_size > 0 ? close - atr_multiplier * atr_value : close + atr_multiplier * atr_value
plot(stop_loss_level, color=color.gray, title="Stop Loss Level", linewidth=2)

// Strategy rules
if (buy_condition)
    strategy.entry("Buy", strategy.long)
    strategy.exit("Exit Buy", from_entry="Buy", loss=stop_loss_level)

if (sell_condition)
    strategy.entry("Sell", strategy.short)
    strategy.exit("Exit Sell", from_entry="Sell", loss=stop_loss_level)