Stratégie de suivi des tendances du pétrole brut basée sur l'indicateur ADX

Aperçu
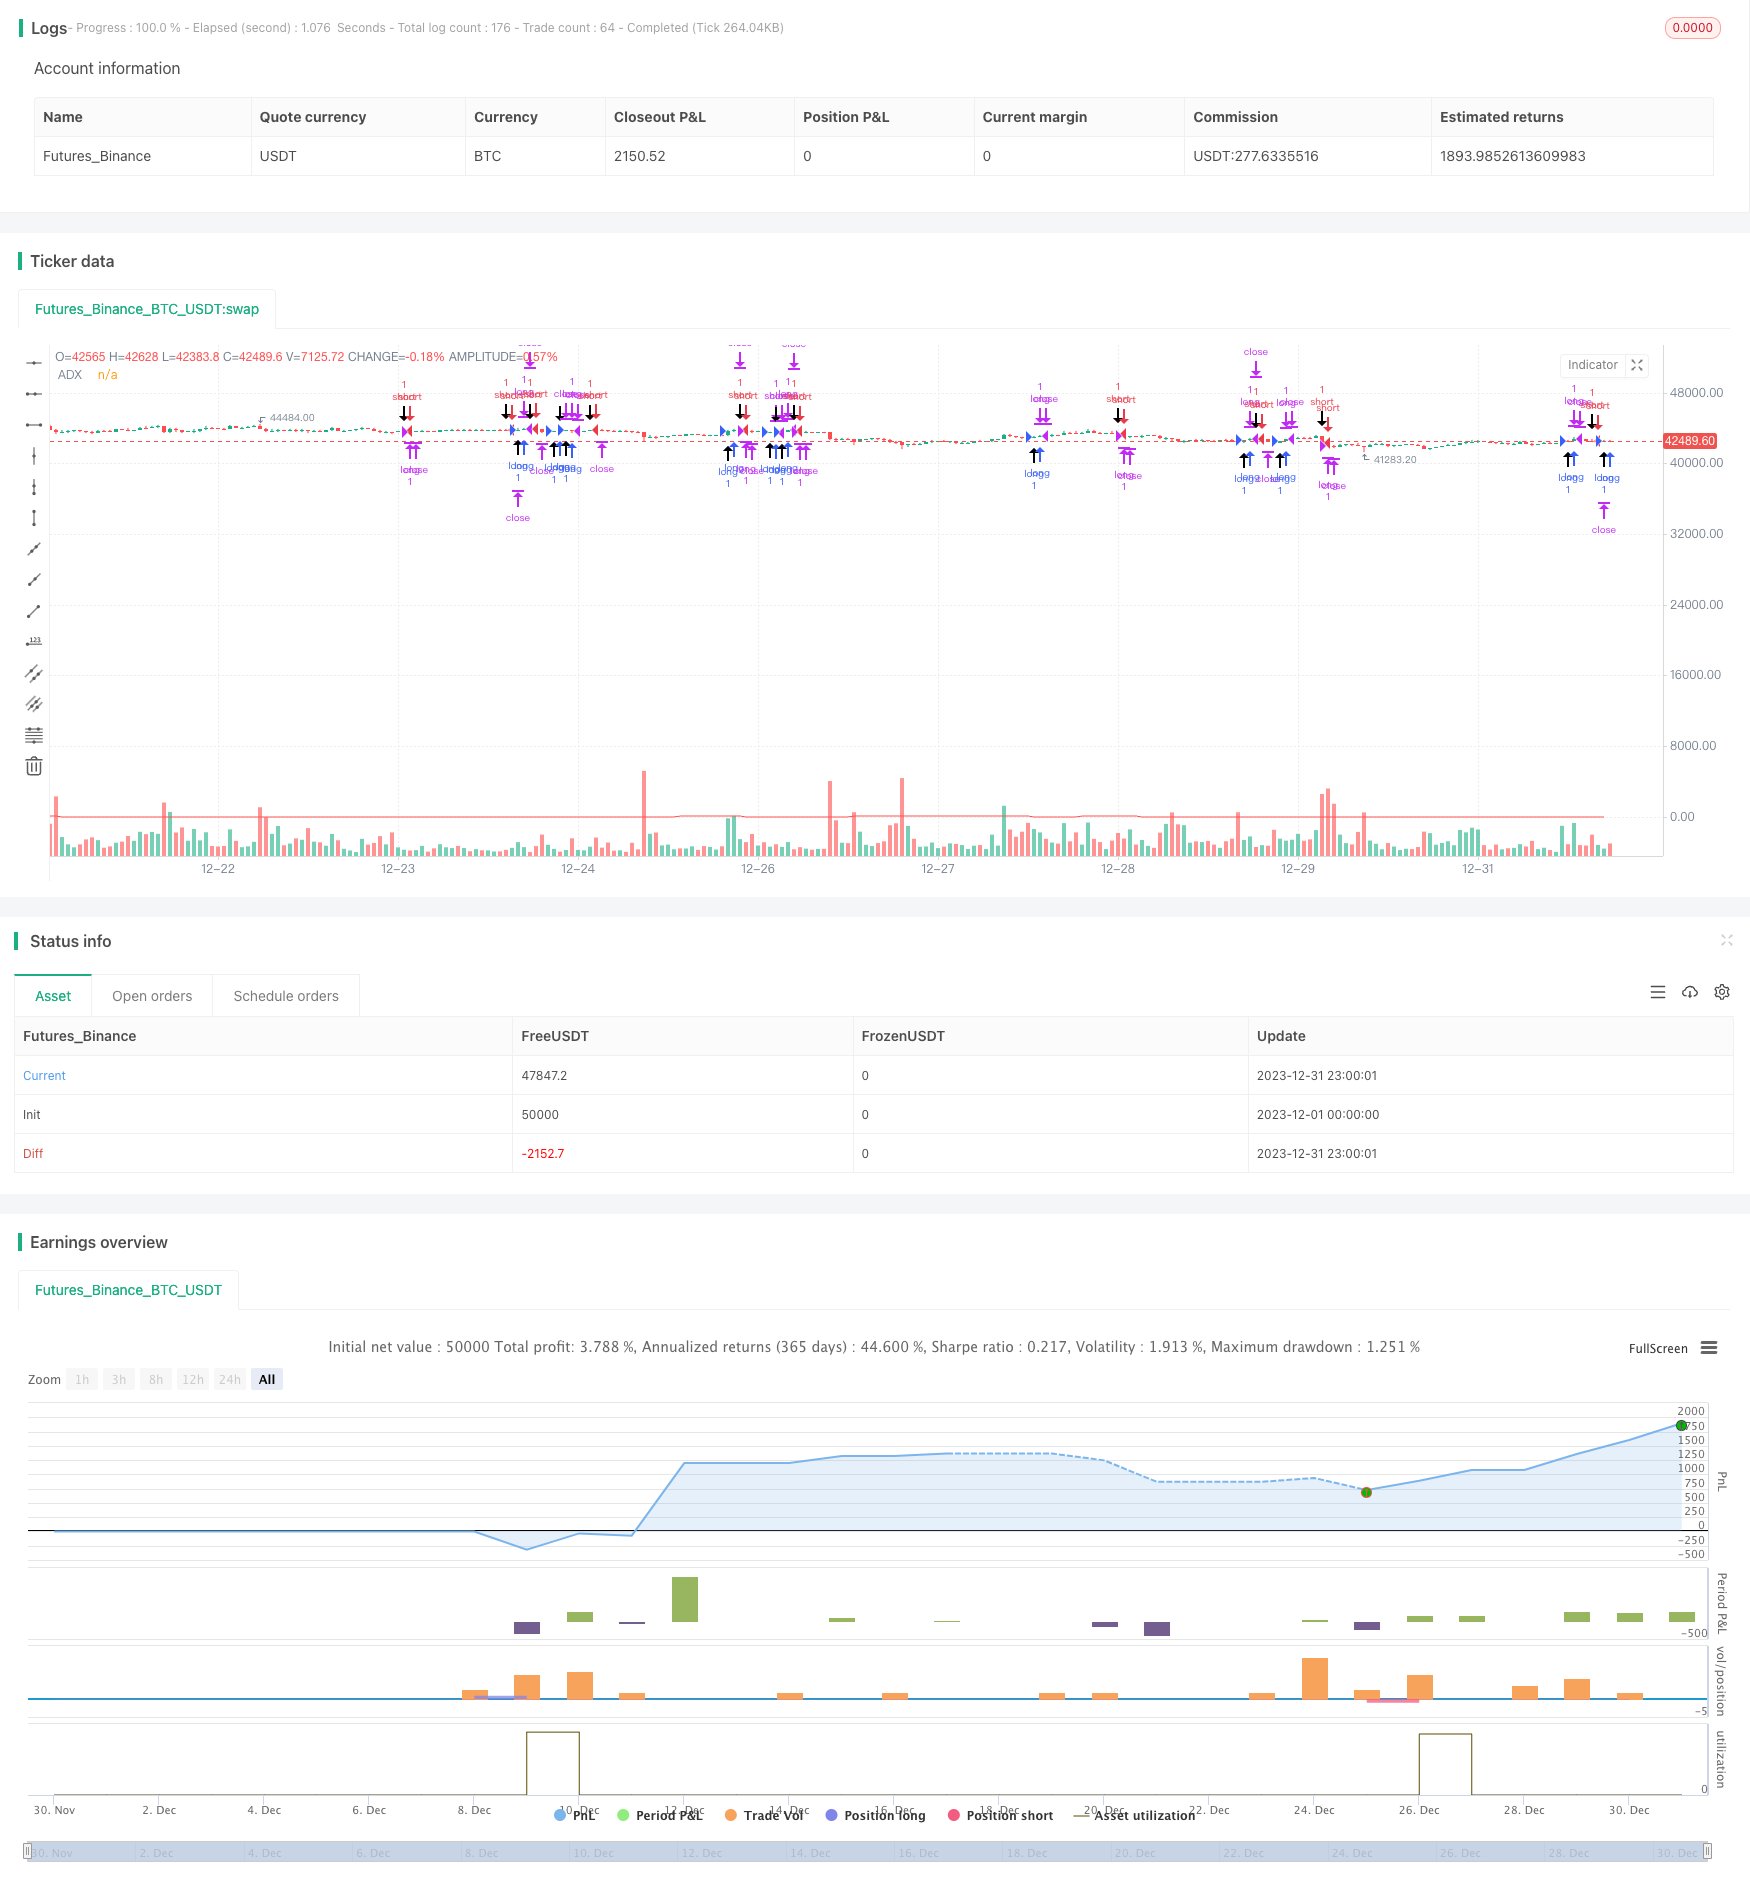
Cette stratégie est basée sur la stratégie de trading de futures sur le pétrole brut gratuit de Kevin Davey. Cette stratégie utilise l’indicateur ADX pour juger de la tendance du marché du pétrole brut, combinée au principe de la rupture des prix, pour réaliser une stratégie de trading automatique du pétrole brut simple et pratique.
Principe de stratégie
- Calcul de l’indicateur ADX à 14 cycles
- Si l’ADX est supérieur à 10, il est considéré comme tendance.
- Si le prix de clôture est supérieur au prix de clôture avant la ligne K de 65 lignes, cela indique une rupture de prix, un signal de position longue
- Si le prix de clôture est inférieur au prix de clôture avant la ligne K de 65 lignes, cela indique une rupture de prix, un signal de position courte
- Arrêt de perte et arrêt après l’entrée
La stratégie repose principalement sur l’indicateur ADX pour juger de la tendance et générer des signaux de négociation en fonction de la rupture des prix dans des conditions de tendance. L’ensemble de la logique de la stratégie est très simple et claire.
Analyse des forces stratégiques
- L’ADX peut être utilisé pour évaluer les tendances et éviter de rater des opportunités de tendance
- La rupture des prix de la période fixe génère un signal et un meilleur effet de retracement
- Le code est intuitif, simple à comprendre et à modifier
- Kevin Davey a vérifié en laboratoire pendant des années que la non-conformité était correcte.
Analyse stratégique des risques
- L’ADX comme indicateur principal, sensible à la sélection des paramètres et à la sélection des cycles de rupture
- La rupture du cycle fixe pourrait laisser passer des opportunités
- Une mauvaise configuration du Stop Loss Barrier peut augmenter les pertes
- Différences possibles entre les résultats en temps réel et les résultats en temps réel
Orientation de l’optimisation de la stratégie
- Optimisation des paramètres ADX et des cycles de rupture
- Augmentation de l’ajustement dynamique du portefeuille
- Modification et amélioration de la stratégie en fonction des résultats de la rétroanalyse et de la vérification en laboratoire
- Introduction de l’apprentissage automatique et de l’apprentissage en profondeur pour une optimisation stratégique
Résumer
Cette stratégie est généralement une stratégie de trading de pétrole brut très pratique. Elle utilise l’indicateur ADX pour juger de la tendance très raisonnable, le principe de la rupture des prix est simple et efficace, avec un bon retour d’expérience.
/*backtest
start: 2023-12-01 00:00:00
end: 2023-12-31 23:59:59
period: 1h
basePeriod: 15m
exchanges: [{"eid":"Futures_Binance","currency":"BTC_USDT"}]
*/

// Strategy idea coded from EasyLanguage to Pinescript
//@version=5
strategy("Kevin Davey Crude free crude oil strategy", shorttitle="CO Fut", format=format.price, precision=2, overlay = true, calc_on_every_tick = true)
adxlen = input(14, title="ADX Smoothing")
dilen = input(14, title="DI Length")
dirmov(len) =>
	up = ta.change(high)
	down = -ta.change(low)
	plusDM = na(up) ? na : (up > down and up > 0 ? up : 0)
	minusDM = na(down) ? na : (down > up and down > 0 ? down : 0)
	truerange = ta.rma(ta.tr, len)
	plus = fixnan(100 * ta.rma(plusDM, len) / truerange)
	minus = fixnan(100 * ta.rma(minusDM, len) / truerange)
	[plus, minus]
adx(dilen, adxlen) =>
	[plus, minus] = dirmov(dilen)
	sum = plus + minus
	adx = 100 * ta.rma(math.abs(plus - minus) / (sum == 0 ? 1 : sum), adxlen)
sig = adx(dilen, adxlen)
plot(sig, color=color.red, title="ADX")

buy = sig > 10 and (close - close[65]) > 0 and (close - close[65])[1] < 0
sell = sig > 10 and (close - close[65]) < 0 and (close - close[65])[1] > 0

plotshape(buy, style = shape.arrowup, location = location.belowbar,size = size.huge)
plotshape(sell, style = shape.arrowdown, location = location.abovebar,size = size.huge)

if buy
	strategy.entry("long", strategy.long)
if sell
	strategy.entry("short", strategy.short)

if strategy.position_size != 0
	strategy.exit("long", profit = 450, loss = 300)
	strategy.exit("short", profit = 450, loss = 300)


// GetTickValue() returns the currency value of the instrument's
// smallest possible price movement.
GetTickValue() =>
    syminfo.mintick * syminfo.pointvalue

// On the last historical bar, make a label to display the
// instrument's tick value
if barstate.islastconfirmedhistory
    label.new(x=bar_index + 1, y=close, style=label.style_label_left,
         color=color.black, textcolor=color.white, size=size.large,
         text=syminfo.ticker + " has a tick value of:\n" +
             syminfo.currency + " " + str.tostring(GetTickValue()))