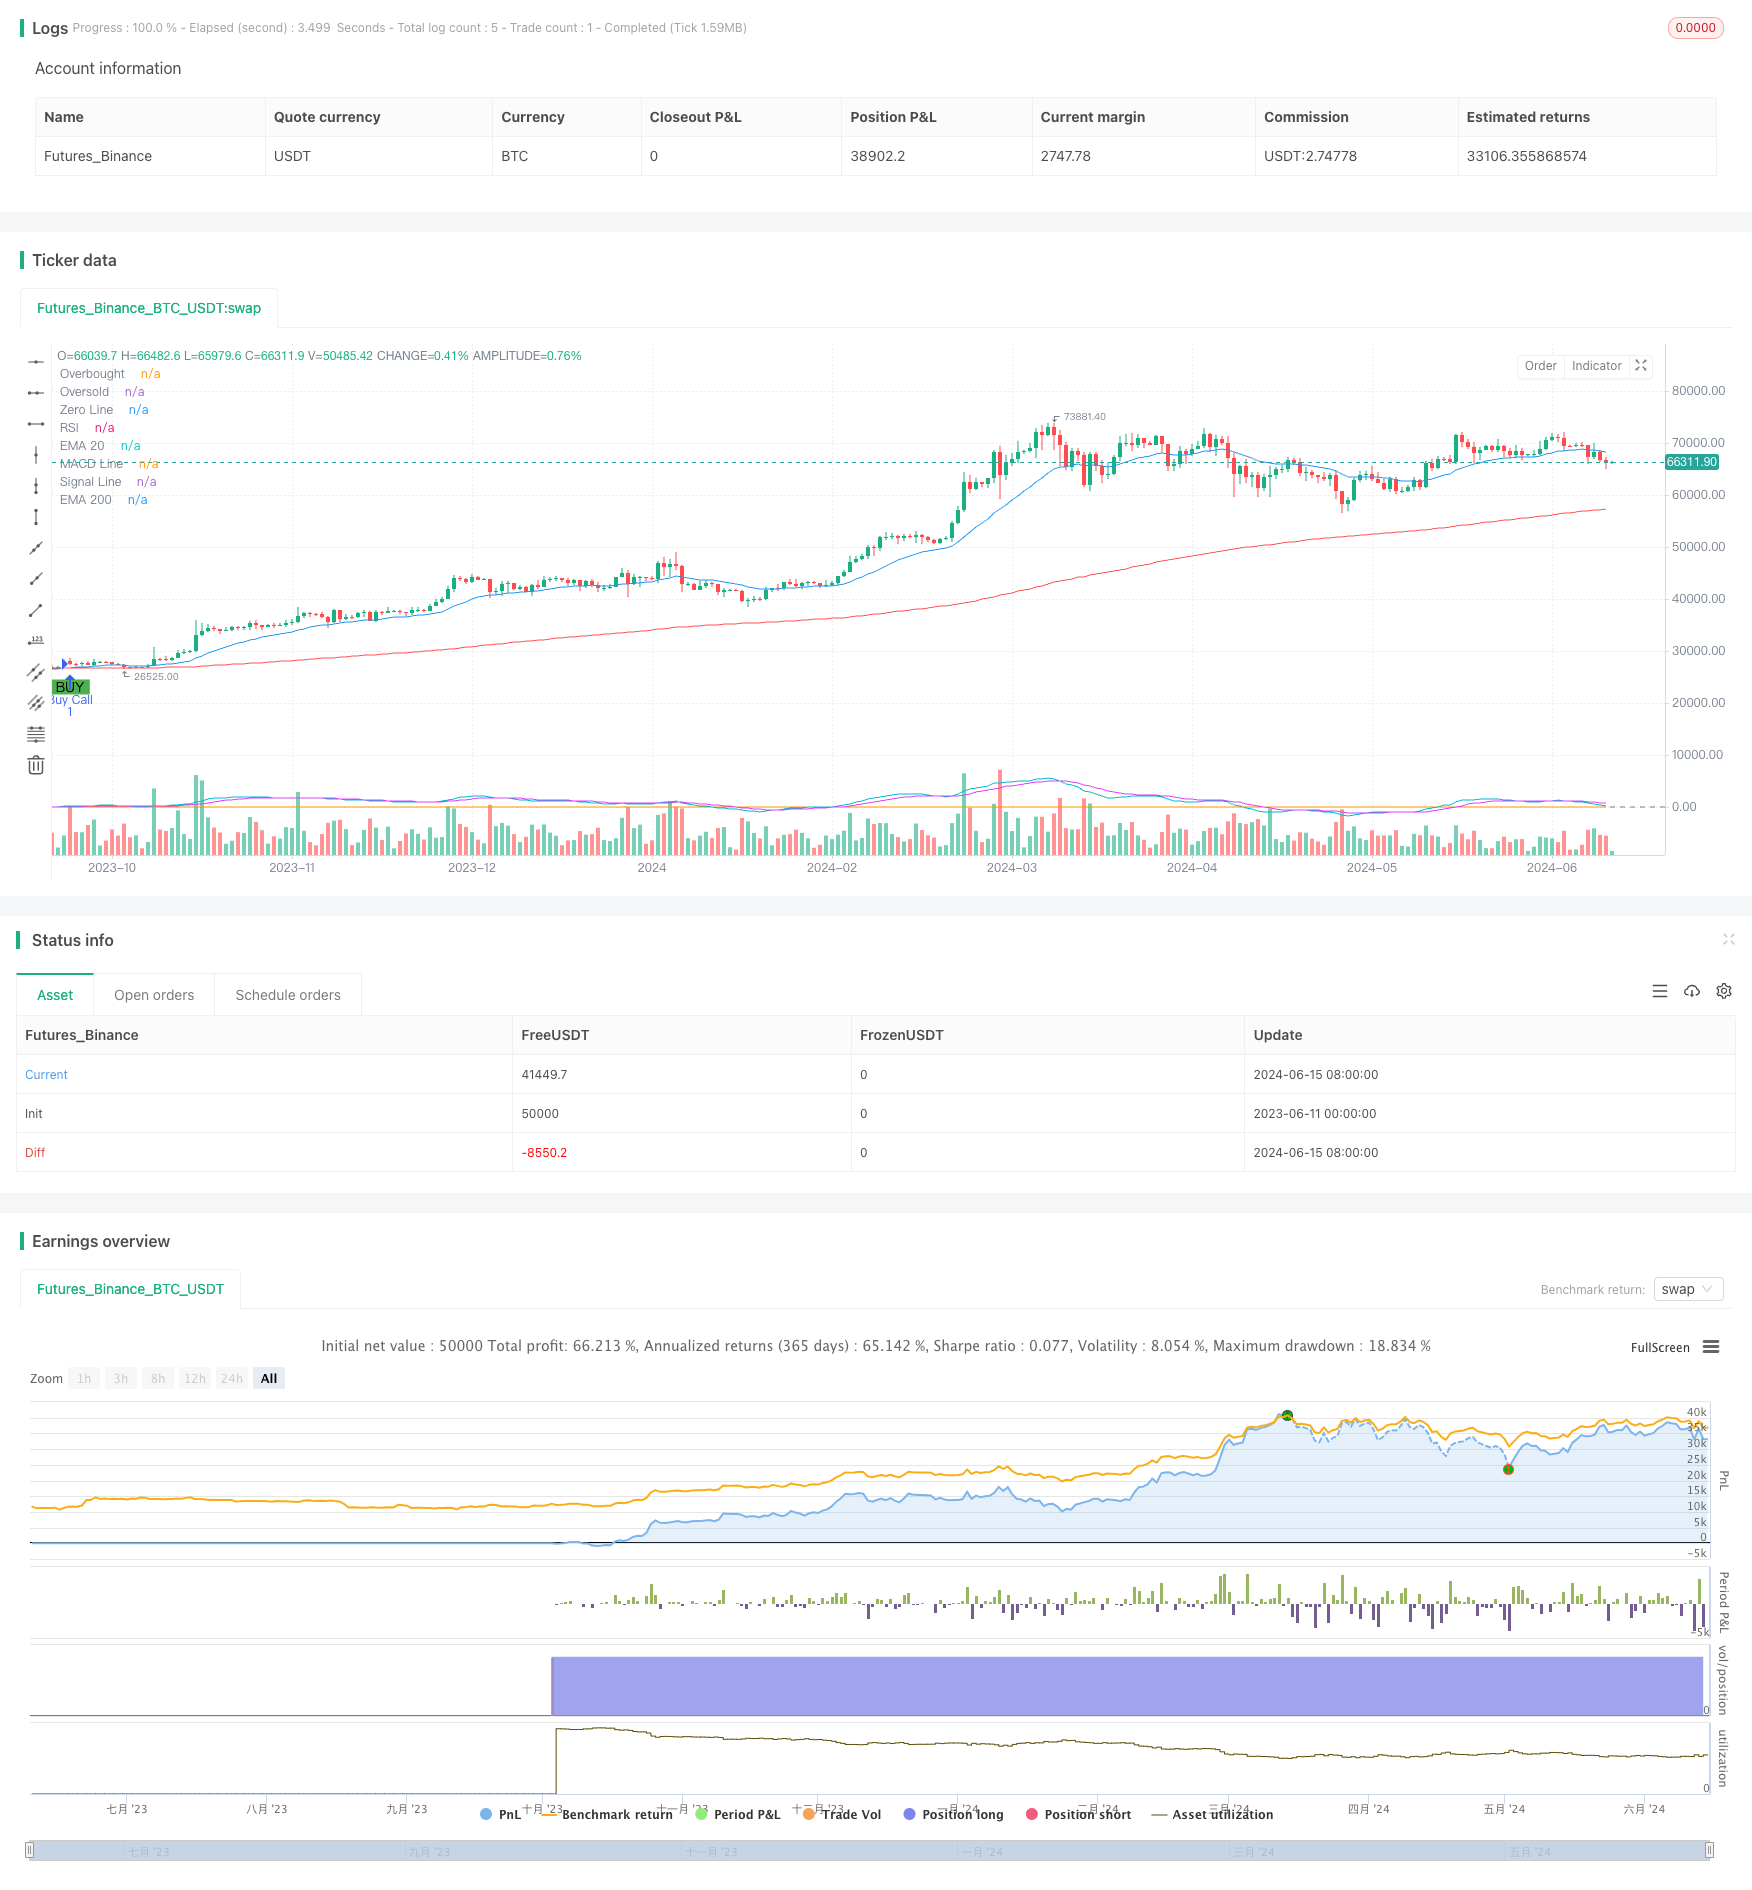
Aperçu
La stratégie est basée sur les signaux croisés des moyennes mobiles des indices à 20 et 200 jours (EMA) et est confirmée en combinaison avec l’indicateur de la faiblesse relative (RSI) et l’indicateur de la dispersion de la convergence des moyennes mobiles (MACD) pour générer des signaux d’achat et de vente. En même temps, la stratégie utilise une méthode de stop-loss dynamique et de gains objectifs fixes pour gérer les risques de négociation et bloquer les bénéfices.
Principe de stratégie
- Les EMA de 20 jours et de 200 jours sont calculés, générant un signal d’achat lorsque l’EMA de 200 jours est traversée par l’EMA de 20 jours; générant un signal de vente lorsque l’EMA de 200 jours est traversée par l’EMA de 20 jours.
- L’utilisation du RSI et du MACD pour confirmer les signaux de croisement EMA implique l’exécution d’un achat uniquement lorsque le RSI est supérieur à 50 et que la ligne MACD est supérieure à la ligne du signal; et d’une vente uniquement lorsque le RSI est inférieur à 50 et que la ligne MACD est inférieure à la ligne du signal.
- Il est possible de définir un taux de rendement cible fixe (par exemple 20%) et un taux de stop-loss initial (par exemple 10%).
- Lorsque les gains de détention atteignent le taux de rendement visé, le prix d’arrêt est porté au-dessous de 10% du prix actuel, ce qui permet de réaliser un arrêt dynamique.
- La position de vente ferme lorsque le prix touche le prix de stop-loss.
Avantages stratégiques
- La combinaison de plusieurs indicateurs techniques pour confirmer le signal de transaction améliore la fiabilité du signal.
- L’utilisation d’une méthode de stop-loss dynamique, qui permet de bloquer les bénéfices tout en laissant une marge de manœuvre au prix pour éviter une liquidation anticipée.
- La fixation d’un taux de rendement cible fixe aide à contrôler les risques et à obtenir des rendements stables.
Risque stratégique
- Les signaux de croisement EMA peuvent être fréquemment faussés, ce qui entraîne une augmentation des coûts de transaction.
- La stratégie peut entraîner des pertes consécutives dans des marchés instables.
- Les taux de rendement et de stop-loss fixés peuvent ne pas s’adapter à différentes conditions du marché et doivent être ajustés en fonction de la volatilité du marché.
Orientation de l’optimisation de la stratégie
- L’introduction de plus d’indicateurs techniques ou d’indicateurs d’humeur du marché pour améliorer la précision et la fiabilité des signaux.
- Le taux de rendement et le taux de stop-loss sont adaptés en fonction de la volatilité du marché et des caractéristiques de l’actif.
- Il utilise des paramètres différents dans différents environnements de marché, en fonction des tendances et des cycles de fluctuation du marché.
Résumer
La stratégie est susceptible de générer des gains stables dans un marché tendanciel grâce à la confirmation des signaux croisés EMA combinés aux RSI et MACD, ainsi qu’à une méthode de gestion des risques de stop loss dynamique et de gain cible fixe. Cependant, la stratégie peut être exposée à des risques de transactions fréquentes et de pertes continues dans un marché turbulent. Par conséquent, des optimisations et améliorations supplémentaires sont nécessaires pour améliorer l’adaptabilité et la solidité de la stratégie.
/*backtest
start: 2023-06-11 00:00:00
end: 2024-06-16 00:00:00
period: 1d
basePeriod: 1h
exchanges: [{"eid":"Futures_Binance","currency":"BTC_USDT"}]
*/

//@version=5
strategy("EMA Crossover Strategy with RSI and MACD Confirmation and Dynamic Trailing Stop Loss", overlay=true)

// Calculate EMAs
ema20 = ta.ema(close, 20)
ema200 = ta.ema(close, 200)

// Calculate RSI
rsi = ta.rsi(close, 14)

// Calculate MACD
[macdLine, signalLine, _] = ta.macd(close, 12, 26, 9)

// Plot EMAs, RSI, and MACD on the chart
plot(ema20, color=color.blue, title="EMA 20")
plot(ema200, color=color.red, title="EMA 200")
hline(70, "Overbought", color=color.red)
hline(30, "Oversold", color=color.green)
plot(rsi, title="RSI", color=color.orange)
hline(0, "Zero Line", color=color.gray)
plot(macdLine, title="MACD Line", color=color.aqua)
plot(signalLine, title="Signal Line", color=color.fuchsia)

// Strategy parameters
targetProfitPercent = 20
trailingStopIncrement = 10

// Strategy variables
var float initialStopLevel = na
var float trailingStopLevel = na

// Strategy rules with RSI and MACD confirmation
longCondition = ta.crossover(ema20, ema200) and rsi > 50 and macdLine > signalLine
shortCondition = ta.crossunder(ema20, ema200) and rsi < 50 and macdLine < signalLine

// Execute trades
if (longCondition)
    strategy.entry("Buy Call", strategy.long)
    initialStopLevel := strategy.position_avg_price * (1 - 0.10) // Initial stop-loss at 10% below entry price

if (shortCondition)
    strategy.entry("Buy Put", strategy.short)

// Calculate profit and loss targets
takeProfit = strategy.position_avg_price * (1 + targetProfitPercent / 100) // 20% profit target

// Update trailing stop loss
if (strategy.opentrades > 0)
    if (strategy.position_size > 0) // Long position
        if (strategy.netprofit >= takeProfit)
            // Update stop-loss based on profit increments
            if (trailingStopLevel == na)
                trailingStopLevel := strategy.position_avg_price * (1 - 0.10) // Initial trailing stop at 10% below entry price
            else
                if (strategy.position_avg_price * (1 - 0.10) > trailingStopLevel)
                    trailingStopLevel := strategy.position_avg_price * (1 - 0.10) // Increase stop-loss to 10% below current price

        // Apply trailing stop loss
        strategy.exit("Take Profit", "Buy Call", stop=trailingStopLevel)

// Plot buy and sell signals on the chart
plotshape(series=longCondition, title="Buy Signal", location=location.belowbar, color=color.green, style=shape.labelup, text="BUY")
plotshape(series=shortCondition, title="Sell Signal", location=location.abovebar, color=color.red, style=shape.labeldown, text="SELL")