पिवोट पॉइंट्स हाई लो मल्टी टाइम फ्रेम
लेखक:चाओझांग, दिनांकः 2022-05-16 15:12:10टैगःपिवोट
नमस्ते सभी,
सार्वजनिक पुस्तकालय में अंतर्निहित और प्रकाशित पिवोट पॉइंट हाई लो संकेतक हैं लेकिन जहां तक मैं देखता हूं उनमें से कोई भी उच्च समय फ्रेम के लिए नहीं है। इसलिए मैंने इस स्क्रिप्ट को लिखने और प्रकाशित करने का फैसला किया। मुझे उम्मीद है कि यह व्यापार या अपनी स्क्रिप्ट विकसित करते समय उपयोगी होगा। मैंने इसे अपने भविष्य के प्रोजेक्ट्स में से एक में उपयोग करने के लिए भी किया (हम इसे कुछ हफ्तों / महीनों में देखेंगे) ।
मैंने सभी सेटिंग्स को वैकल्पिक बनाने की कोशिश की, ताकि आप उनके साथ अपनी इच्छानुसार खेल सकें।
नोटः यदि चार्ट समय सीमा विकल्पों में समय सीमा से कम है, तो कोई नियंत्रण तंत्र नहीं है। इसलिए आप चार्ट समय सीमा से अधिक विकल्पों में उच्च समय सीमा सेट करना बेहतर है।
आनंद लें!
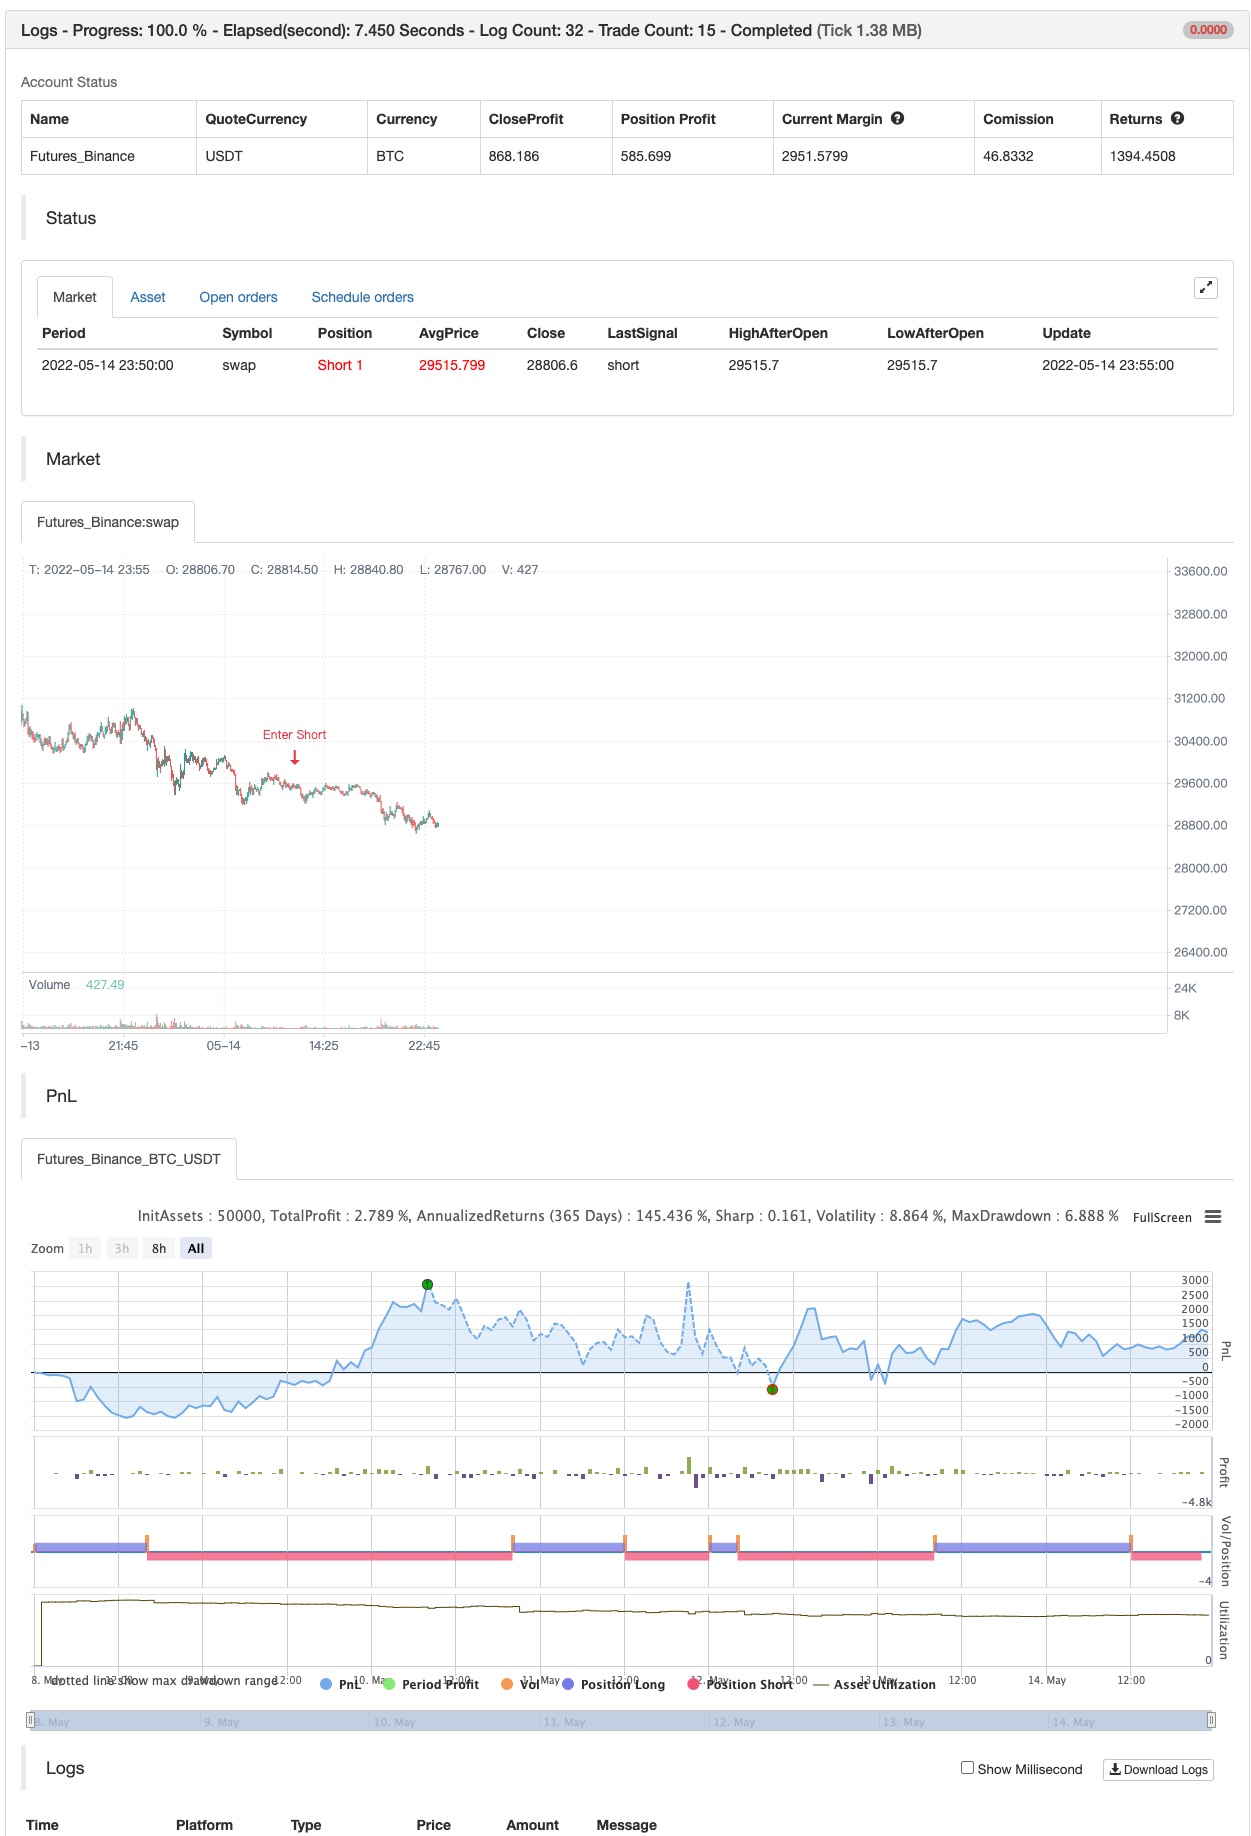
बैकटेस्ट

/*backtest
start: 2022-05-08 00:00:00
end: 2022-05-14 23:59:00
period: 5m
basePeriod: 1m
exchanges: [{"eid":"Futures_Binance","currency":"BTC_USDT"}]
*/

// This source code is subject to the terms of the Mozilla Public License 2.0 at https://mozilla.org/MPL/2.0/
// © LonesomeTheBlue

//@version=5
indicator("Pivot Points High Low Multi Time Frame", overlay = true, max_lines_count = 500, max_labels_count = 500)
timeframe = input.timeframe(defval = '240')
leftBars  = input.int(defval = 2, title = "Left Bars", minval = 1)
rightBars  = input.int(defval = 2, title = "Right Bars", minval = 1)
phlinecol = input(defval = color.lime, title = "Pivot High/Low Line Colors", inline = "lc")
pllinecol = input(defval = color.red, title = "", inline = "lc")
phbgcol = input(defval = color.lime, title = "Pivot High BG/Text Colors", inline = "ph")
phtextcol = input(defval = color.black, title = "", inline = "ph")
plbgcol = input(defval = color.red, title = "Pivot Low BG/Text Colors", inline = "pl")
pltextcol = input(defval = color.white, title = "", inline = "pl")

get_phpl()=>
    float ph = ta.pivothigh(leftBars, rightBars)
    float pl = ta.pivotlow(leftBars, rightBars)
    phtimestart = ph ? time[rightBars] : na
    phtimeend = ph ? time[rightBars - 1] : na
    pltimestart = pl ? time[rightBars] : na
    pltimeend = pl ? time[rightBars - 1] : na

    [ph, phtimestart, phtimeend, pl, pltimestart, pltimeend]

// get if there if Pivot High/low and their start/end times
[ph, phtimestart, phtimeend, pl, pltimestart, pltimeend] = request.security(syminfo.tickerid, timeframe, get_phpl(), lookahead = barmerge.lookahead_on)

// keep time of each bars, this is used for lines/labels
var mytime = array.new_int(0)
array.unshift(mytime, time)

// calculate end of the line/time for pivot high/low
bhend = array.get(mytime, math.min(array.indexof(mytime, phtimeend) + 1, array.size(mytime) - 1))
blend = array.get(mytime, math.min(array.indexof(mytime, pltimeend) + 1, array.size(mytime) - 1))

// to draw once
float pivothigh = na(ph[1]) and ph ? ph : na
float pivotlow  = na(pl[1]) and pl ? pl : na


if not na(pivothigh)
    strategy.entry("Enter Long", strategy.long)
else if not na(pivotlow)
    strategy.entry("Enter Short", strategy.short)
संबंधित सामग्री
- फ़िल्टर वेव पैटर्न और विलियम सूचकांक के संयोजन में बहु-समय चक्र ट्रेडिंग रणनीति
- गतिशील समर्थन प्रतिरोध और ब्रिन बैंड बहु-संकेतक क्रॉसिंग रणनीति
- गतिशील समर्थन प्रतिरोध कुंडल स्व-अनुकूलित मात्रा व्यापार रणनीति
- आरएसआई विचलन सूचक
- पिवोट ट्रेंड
- आयतन भिन्नता
- पिवोट आधारित अनुवर्ती अधिकतम और न्यूनतम
- पिवोट पॉइंट सुपरट्रेंड
- विला डायनामिक पिवोट सुपरट्रेंड रणनीति
- पिवोट ऑर्डर ब्लॉक
अधिक जानकारी
- एसएमए बीटीसी हत्यारा
- एमएल अलर्ट टेम्पलेट
- ब्रेक के साथ फिबोनाची प्रगति
- आरएसआई एमटीएफ ओबी+ओ
- फुकुइज़ ऑक्टा-ईएमए + इचिमोकू
- सीसीआई एमटीएफ ओबी+ओ
- स्मार्ट एमएसीडी
- ओसीसी रणनीति आर5.1
- BEARMARKET में आपका स्वागत है [30 मिनट]
- साइड बॉस
- भूत प्रवृत्ति ट्रैक रणनीति डेटाबेस
- भूत प्रवृत्ति ट्रैक रणनीति व्यापार सूची
- भूत प्रवृत्ति ट्रैकिंग रणनीति
- इंद्रधनुष दोलन
- इक्विटी वक्र स्थिति आकार उदाहरण का व्यापार
- KLineChart का प्रदर्शन
- विला डायनामिक पिवोट सुपरट्रेंड रणनीति
- क्रॉडल का सुपरट्रेंड
- zdmre द्वारा आरएसआई
- FTL - रेंज फिल्टर X2 + EMA + UO