Multi-Timeframe Trading Strategy Combining Harmonic Patterns and Williams %R
Author: ChaoZhang, Date: 2025-01-17 16:19:15Tags: WPRSLTPRRPivot

Overview
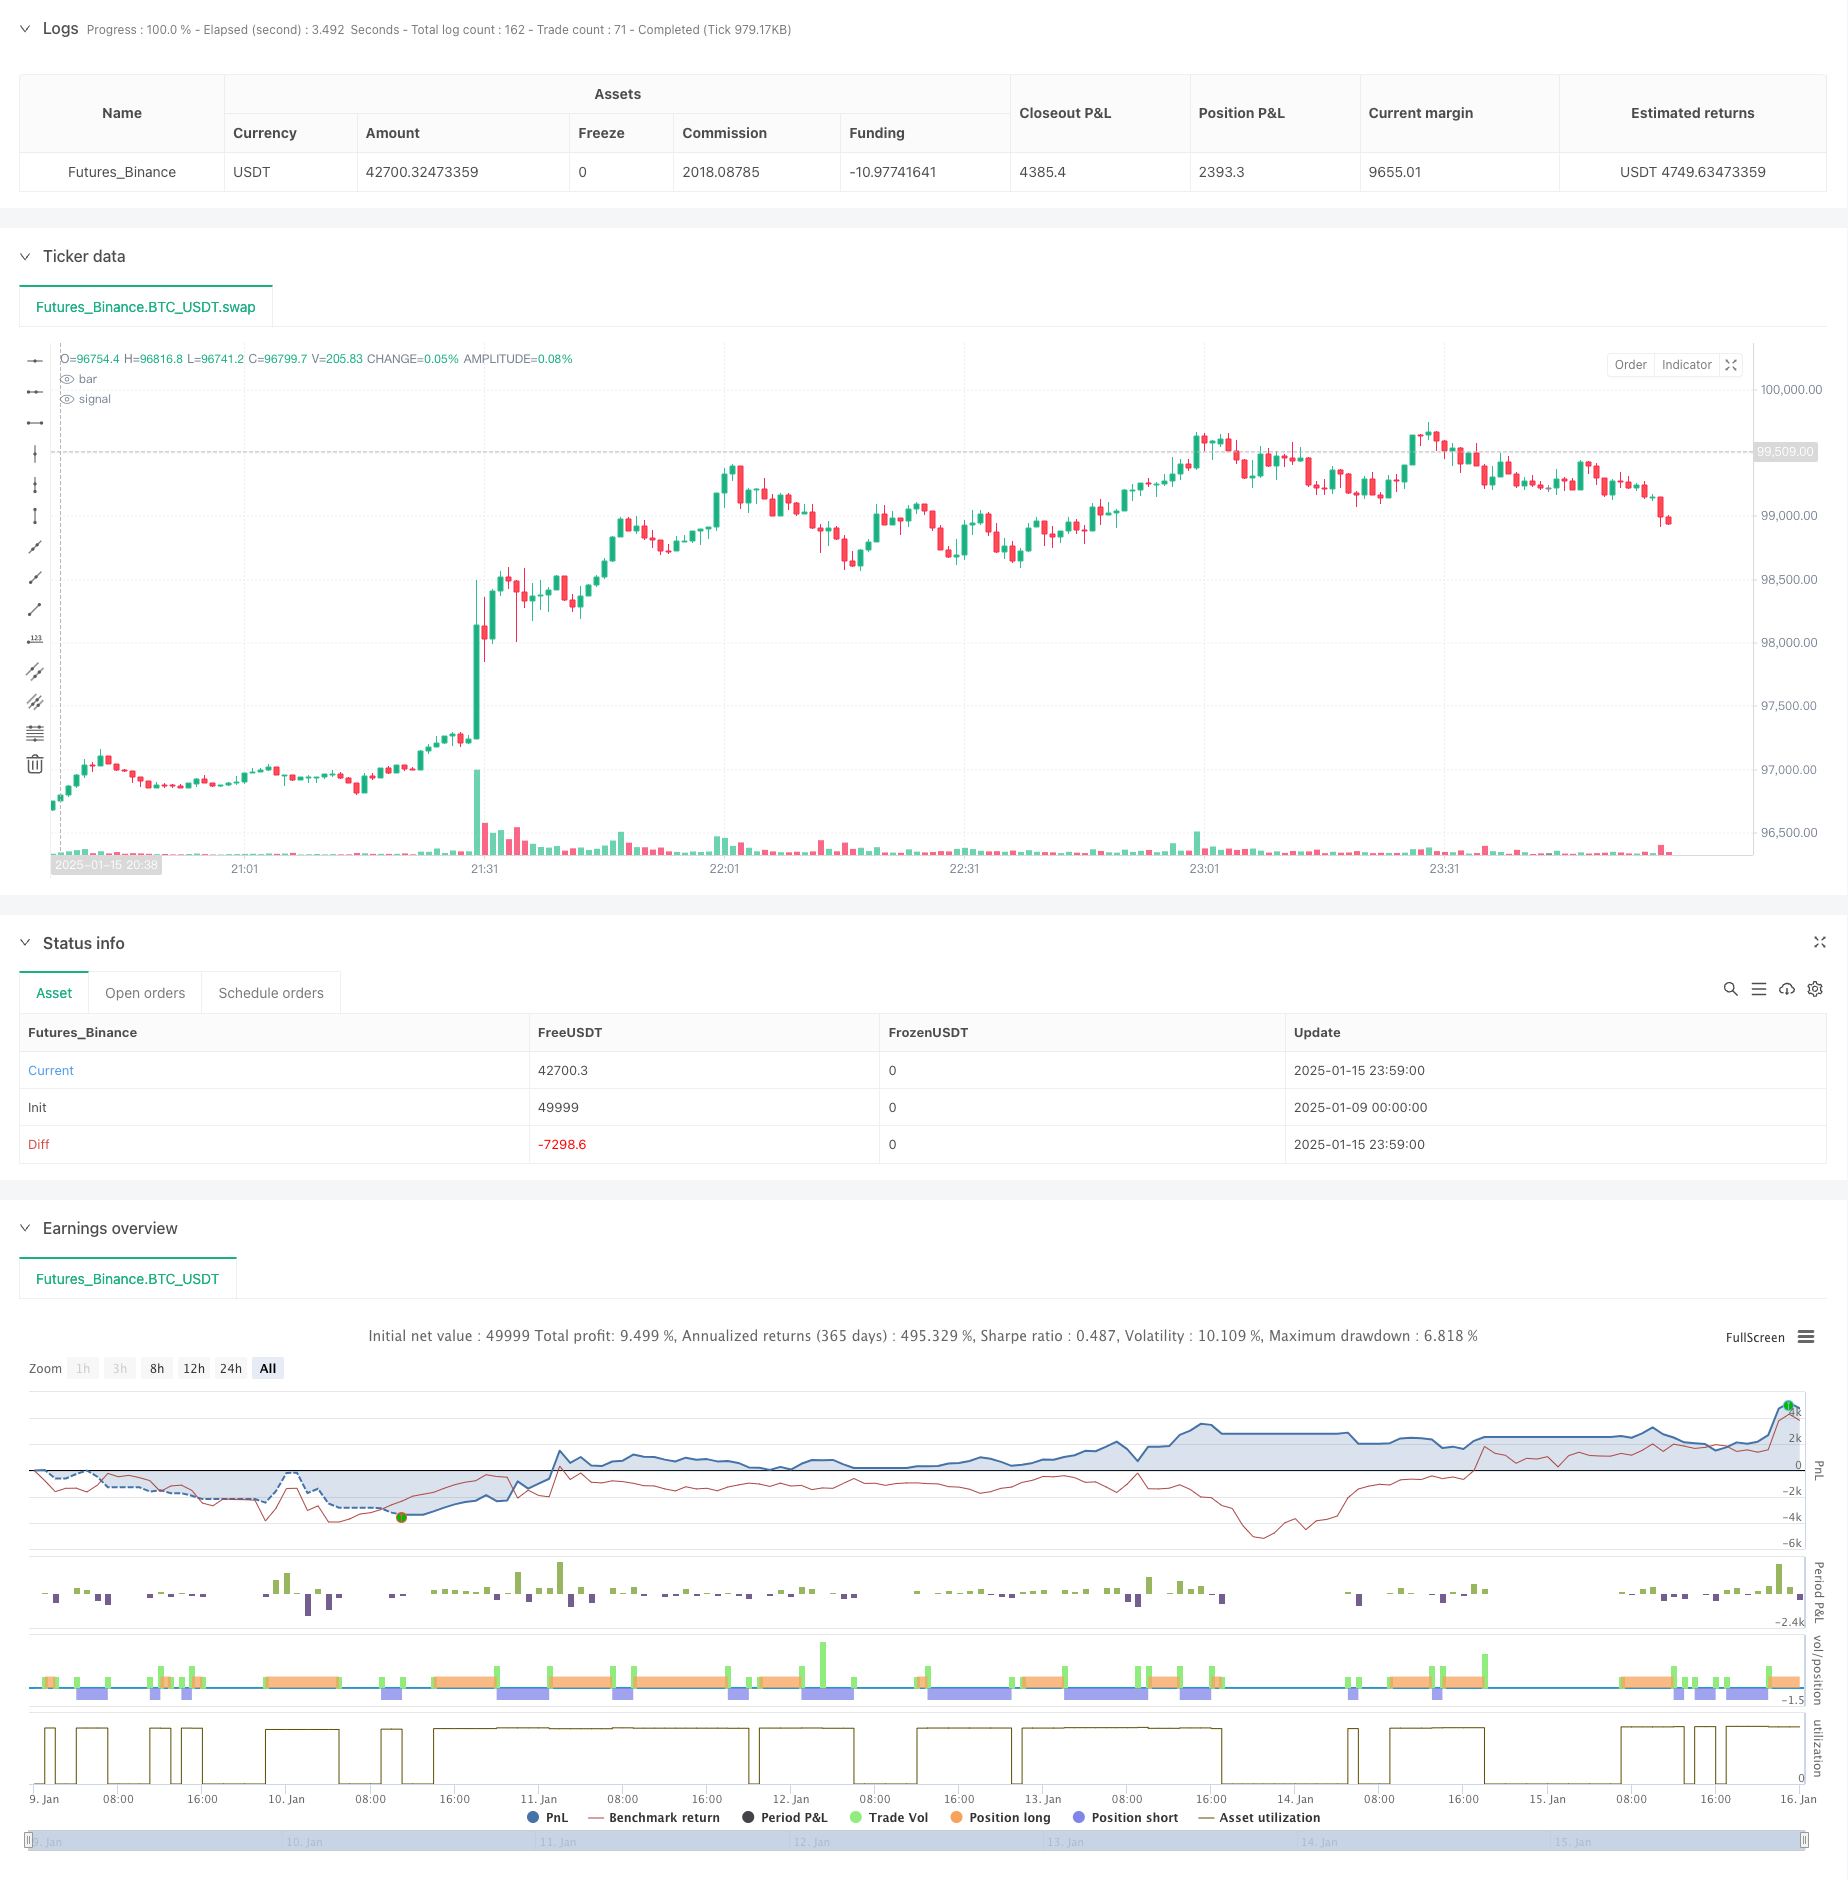
This strategy is an advanced trading system that combines Harmonic Patterns with the Williams Percent Range (WPR) indicator. It identifies harmonic formations (such as Gartley, Bat, Crab, and Butterfly patterns) in the market and uses WPR’s overbought/oversold levels to determine trade entry and exit points. The strategy employs multiple confirmation mechanisms, utilizing the synergy of technical indicators to enhance trading accuracy and reliability.
Strategy Principles
The core logic includes several key components: 1. Harmonic Pattern Recognition: Uses price pivot points to identify potential harmonic formations by analyzing the relationships between highs and lows. 2. Williams %R Calculation: Employs a custom period for calculating WPR, analyzing relationships between high, low, and closing prices to determine market conditions. 3. Entry Conditions: - Long Entry: When a bullish harmonic pattern appears and WPR is in oversold territory - Short Entry: When a bearish harmonic pattern appears and WPR is in overbought territory 4. Risk Management: Implements dynamic stop-loss based on recent lows/highs and sets take-profit levels using risk-reward ratios.
Strategy Advantages
- Multi-dimensional Analysis: Combines pattern analysis with momentum indicators for more reliable trading signals.
- Robust Risk Control: Uses dynamic stop-loss and risk-reward based take-profit settings to effectively control risk per trade.
- High Adaptability: Can be adapted to different market environments and instruments through parameter optimization.
- Signal Confirmation Mechanism: Reduces false signals through dual confirmation using harmonic patterns and WPR.
Strategy Risks
- Pattern Recognition Risk: Simplified harmonic pattern recognition may lead to misidentification of some formations.
- Parameter Sensitivity: Multiple parameters require careful optimization, as improper settings can affect strategy performance.
- Market Environment Dependency: May underperform in highly volatile or ranging markets.
- Signal Lag: Technical indicator-based signals may have inherent lag.
Strategy Optimization Directions
- Enhanced Pattern Recognition:
- Add stricter harmonic ratio validation
- Incorporate price structure analysis for improved pattern identification
- Signal Filtering:
- Add trend filters
- Consider volatility indicators for market environment adaptation
- Risk Management Optimization:
- Implement dynamic risk-reward ratio adjustments
- Add volatility-based position sizing
Summary
This strategy builds a comprehensive trading system by combining harmonic patterns with the Williams %R indicator. Its strengths lie in its multi-dimensional analysis approach and robust risk control mechanisms, though attention must be paid to parameter optimization and market environment adaptation. Through the suggested optimization directions, the strategy’s stability and reliability can be further enhanced.
/*backtest
start: 2025-01-09 00:00:00
end: 2025-01-16 00:00:00
period: 1m
basePeriod: 1m
exchanges: [{"eid":"Futures_Binance","currency":"BTC_USDT","balance":49999}]
*/

//@version=5
strategy("Harmonic Pattern with WPR Backtest", overlay=true)

// === Inputs ===
patternLength = input.int(5, title="Pattern Length")
wprLength = input.int(14, title="WPR Length")
wprOverbought = input.float(-20, title="WPR Overbought Level")
wprOversold = input.float(-80, title="WPR Oversold Level")
riskRewardMultiplier = input.float(0.618, title="Take-Profit Risk/Reward Multiplier")
stopLossBuffer = input.float(0.005, title="Stop-Loss Buffer (%)")

// === Manual Calculation of William Percent Range (WPR) ===
highestHigh = ta.highest(high, wprLength)
lowestLow = ta.lowest(low, wprLength)
wpr = ((highestHigh - close) / (highestHigh - lowestLow)) * -100

// === Harmonic Pattern Detection (Simplified Approximation) ===
// Calculate price pivots
pivotHigh = ta.pivothigh(high, patternLength, patternLength)
pivotLow = ta.pivotlow(low, patternLength, patternLength)

// Detect Bullish and Bearish Harmonic Patterns
bullishPattern = pivotLow and close > ta.lowest(close, patternLength)  // Simplified detection for bullish patterns
bearishPattern = pivotHigh and close < ta.highest(close, patternLength)  // Simplified detection for bearish patterns

// === Entry Conditions ===
longCondition = bullishPattern and wpr < wprOversold
shortCondition = bearishPattern and wpr > wprOverbought

// === Stop-Loss and Take-Profit Levels ===
longEntryPrice = close
longSL = ta.valuewhen(longCondition, low, 0) * (1 - stopLossBuffer)  // Stop-loss for long trades
longTP = longEntryPrice * (1 + riskRewardMultiplier)  // Take-profit for long trades

shortEntryPrice = close
shortSL = ta.valuewhen(shortCondition, high, 0) * (1 + stopLossBuffer)  // Stop-loss for short trades
shortTP = shortEntryPrice * (1 - riskRewardMultiplier)  // Take-profit for short trades

// === Backtesting Logic ===
// Long Trade
if longCondition
    strategy.entry("Long", strategy.long)
    strategy.exit("Long Exit", "Long", stop=longSL, limit=longTP)

// Short Trade
if shortCondition
    strategy.entry("Short", strategy.short)
    strategy.exit("Short Exit", "Short", stop=shortSL, limit=shortTP)

// === Visualization ===
bgcolor(longCondition ? color.new(color.green, 90) : na, title="Long Entry Signal")
bgcolor(shortCondition ? color.new(color.red, 90) : na, title="Short Entry Signal")
- Risk-Reward Ratio Optimized Strategy Based on Moving Average Crossover
- Dynamic Risk-Managed Exponential Moving Average Crossover Strategy
- Dual EMA Crossover Strategy with Smart Risk-Reward Control
- Adaptive Channel Breakout Strategy with Dynamic Support and Resistance Trading System
- Enhanced Dual Pivot Point Reversal Trading Strategy
- Adaptive Range Trading System Based on Dual RSI Indicators
- Multi-MA Trend Intensity Trading Strategy - A Flexible Smart Trading System Based on MA Deviation
- Advanced MACD Crossover Trading Strategy with Adaptive Risk Management
- Multi-Indicator Crossover Momentum Trading Strategy with Optimized Take Profit and Stop Loss System
- Multi-Period Bollinger Bands Trend Breakout Strategy with Volatility Risk Control Model
- Dynamic Dual-Indicator Momentum Trend Quantitative Strategy System
- Multi-Dimensional Trend Analysis with ATR-Based Dynamic Stop Management Strategy
- Adaptive Bollinger Bands Mean-Reversion Trading Strategy
- Advanced Multi-Indicator Trend Confirmation Trading Strategy
- Dual Moving Average-RSI Multi-Signal Trend Trading Strategy
- Adaptive Trend Following and Multi-Confirmation Trading Strategy
- Dynamic EMA System Combined with RSI Momentum Indicator for Optimized Intraday Trading Strategy
- Multi-Technical Indicator Crossover Momentum Trend Following Strategy
- Dynamic Stop-Loss Adjustment Elephant Bar Trend Following Strategy
- Dual-Period RSI Trend Momentum Strategy with Pyramiding Position Management System
- EMA Trend with Round Number Breakout Trading Strategy
- Dynamic RSI Quantitative Trading Strategy with Multiple Moving Average Crossover
- Dynamic Trend RSI Indicator Crossing Strategy
- Multi-Dimensional KNN Algorithm with Volume-Price Candlestick Pattern Trading Strategy
- Dual Crossover Trend Following Strategy: EMA and MACD Synergistic Trading System
- SMA-Based Intelligent Trailing Stop Strategy with Intraday Pattern Recognition
- Adaptive Multi-Strategy Dynamic Switching System: A Quantitative Trading Strategy Combining Trend Following and Range Oscillation
- Advanced Multi-Indicator Multi-Dimensional Trend Cross Quantitative Strategy
- Multi-Factor Regression and Dynamic Price Band Quantitative Trading System
- Multi-Indicator Dynamic Trend Detection and Risk Management Trading Strategy