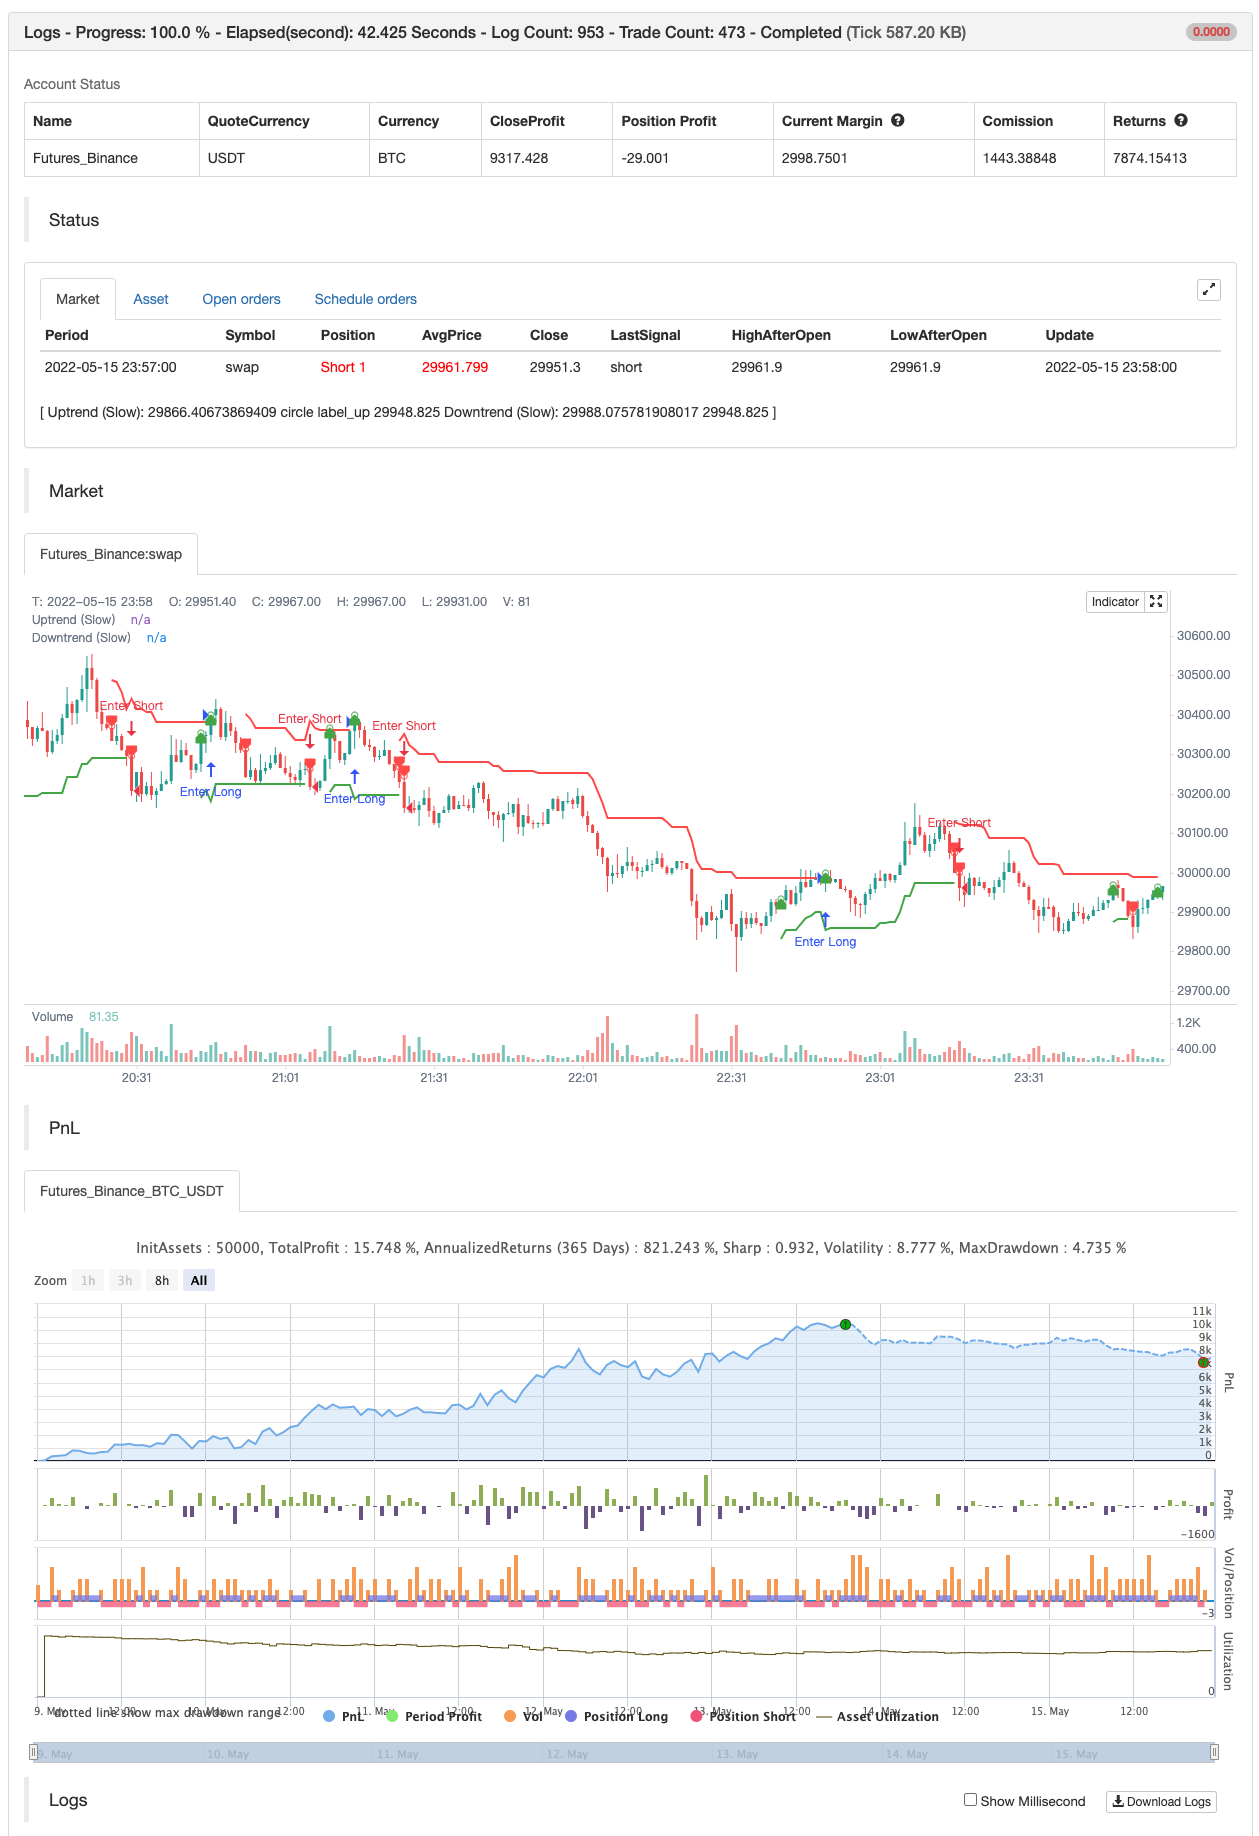
अवधारणा दोहरी सुपरट्रेंड
लेखक:चाओझांग, दिनांकः 2022-05-17 14:40:40टैगःएसएमएएटीआर
सरल सुपरट्रेंड संकेतक जो आपको एक ही स्क्रिप्ट पर दो सुपरट्रेंड प्रदर्शित करने का विकल्प देता है और साथ ही अतिरिक्त अनुकूलन सुविधाएं। आय शार्क से प्रेरित दोहरी सेटअप
बैकटेस्ट

/*backtest
start: 2022-05-09 00:00:00
end: 2022-05-15 23:59:00
period: 1m
basePeriod: 1m
exchanges: [{"eid":"Futures_Binance","currency":"BTC_USDT"}]
*/

//@version=5
indicator(title='Concept Dual SuperTrend', shorttitle='ConceptDST', overlay=true, format=format.price, precision=2, timeframe='')

src = input(hl2, title='Source')
multiplier = input.float(title='ATR Multiplier (Fast)', step=0.1, defval=2)
multiplier2 = input.float(title='ATR Multiplier (Slow)', step=0.1, defval=3)
periods = input(title='ATR Period (Fast)', defval=10)
periods2 = input(title='ATR Period (Slow)', defval=10)
transp_st = input.float(title='Line Transparency', step=1, minval=0, maxval=100, defval=70)
transp_hl = input.float(title='Shading Transparency', step=1, minval=0, maxval=100, defval=90)
changeATR = input(title='Change ATR Calculation Method?', defval=true)
highlighting = input(title='Show Shading? (Fast)', defval=true)
highlighting2 = input(title='Show Shading? (Slow)', defval=true)
showlabels = input(title='Show Buy/Sell Labels?', defval=true)


//------------------------------------------------

// Calculations (Fast)
atrA = ta.sma(ta.tr, periods)
atr = changeATR ? ta.atr(periods) : atrA
up = src - multiplier * atr
upA = nz(up[1], up)
up := close[1] > upA ? math.max(up, upA) : up
dn = src + multiplier * atr
dnA = nz(dn[1], dn)
dn := close[1] < dnA ? math.min(dn, dnA) : dn

// Trend (Fast)
trend = 1
trend := nz(trend[1], trend)
trend := trend == -1 and close > dnA ? 1 : trend == 1 and close < upA ? -1 : trend

upPlot = plot(trend == 1 ? up : na, title='Uptrend (Slow)', style=plot.style_linebr, linewidth=2, color=color.new(color.green, transp_st))
buySignal = trend == 1 and trend[1] == -1
plotshape(buySignal ? up : na, title='Uptrend Start (Slow)', location=location.absolute, style=shape.circle, size=size.tiny, color=color.new(color.green, transp_st))
plotshape(buySignal and showlabels ? up : na, title='Buy', text='Buy', location=location.absolute, style=shape.labelup, size=size.tiny, color=color.new(color.green, 0), textcolor=color.new(color.white, 0))

dnPlot = plot(trend == 1 ? na : dn, title='Downtrend (Slow)', style=plot.style_linebr, linewidth=2, color=color.new(color.red, transp_st))
sellSignal = trend == -1 and trend[1] == 1
plotshape(sellSignal ? dn : na, title='Downtrend Start (Slow)', location=location.absolute, style=shape.circle, size=size.tiny, color=color.new(color.red, transp_st))
plotshape(sellSignal and showlabels ? dn : na, title='Sell', text='Sell', location=location.absolute, style=shape.labeldown, size=size.tiny, color=color.new(color.red, 0), textcolor=color.new(color.white, 0))

mPlot = plot(ohlc4, title='', style=plot.style_circles, linewidth=0, color=na)
longFillColor = highlighting ? trend == 1 ? color.green : color.black : color.black
shortFillColor = highlighting ? trend == -1 ? color.red : color.black : color.black
fill(mPlot, upPlot, title='Uptrend Shading (Slow)', color=color.new(longFillColor, transp_hl))
fill(mPlot, dnPlot, title='Downtrend Shading (Slow)', color=color.new(shortFillColor, transp_hl))

//------------------------------------------------

// Calculations (Slow)
atrA2 = ta.sma(ta.tr, periods2)
atr2 = changeATR ? ta.atr(periods2) : atrA2
up2 = src - multiplier2 * atr2
upA2 = nz(up2[1], up2)
up2 := close[1] > upA2 ? math.max(up2, upA2) : up2
dn2 = src + multiplier2 * atr2
dnA2 = nz(dn2[1], dn2)
dn2 := close[1] < dnA2 ? math.min(dn2, dnA2) : dn2

// Trend (Slow)
trend2 = 1
trend2 := nz(trend2[1], trend2)
trend2 := trend2 == -1 and close > dnA2 ? 1 : trend2 == 1 and close < upA2 ? -1 : trend2

upPlot2 = plot(trend2 == 1 ? up2 : na, title='Uptrend (Slow)', style=plot.style_linebr, linewidth=2, color=color.new(color.green, transp_st))
buySignal2 = trend2 == 1 and trend2[1] == -1
plotshape(buySignal2 ? up2 : na, title='Uptrend Start (Slow)', location=location.absolute, style=shape.circle, size=size.tiny, color=color.new(color.green, transp_st))
plotshape(buySignal2 and showlabels ? up2 : na, title='Buy', text='Buy', location=location.absolute, style=shape.labelup, size=size.tiny, color=color.new(color.green, 0), textcolor=color.new(color.white, 0))

dnPlot2 = plot(trend2 == 1 ? na : dn2, title='Downtrend (Slow)', style=plot.style_linebr, linewidth=2, color=color.new(color.red, transp_st))
sellSignal2 = trend2 == -1 and trend2[1] == 1
plotshape(sellSignal2 ? dn2 : na, title='Downtrend Start (Slow)', location=location.absolute, style=shape.circle, size=size.tiny, color=color.new(color.red, transp_st))
plotshape(sellSignal2 and showlabels ? dn2 : na, title='Sell', text='Sell', location=location.absolute, style=shape.labeldown, size=size.tiny, color=color.new(color.red, 0), textcolor=color.new(color.white, 0))

mPlot2 = plot(ohlc4, title='', style=plot.style_circles, linewidth=0, color=na)
longFillColor2 = highlighting2 ? trend2 == 1 ? color.green : color.black : color.black
shortFillColor2 = highlighting2 ? trend2 == -1 ? color.red : color.black : color.black
fill(mPlot2, upPlot2, title='Uptrend Shading (Slow)', color=color.new(longFillColor2, transp_hl))
fill(mPlot2, dnPlot2, title='Downtrend Shading (Slow)', color=color.new(shortFillColor2, transp_hl))


if buySignal2
    strategy.entry("Enter Long", strategy.long)
else if sellSignal2
    strategy.entry("Enter Short", strategy.short)
संबंधित
- एटीआर स्टॉप-लॉस सिस्टम के साथ बहु-एसएमए समर्थन स्तर झूठी ब्रेकआउट रणनीति
- एटीआर और वॉल्यूम के संयोजन की रणनीति के बाद गतिशील सिग्नल लाइन ट्रेंड
- अल्फाट्रेंड
- जोखिम नियंत्रण के साथ दोहरी चलती औसत रिवर्स रणनीति
- इचिमोकू क्लाउड और एटीआर रणनीति
- गतिशील अस्थिरता फ़िल्टर के साथ बहु-अवधि चलती औसत क्रॉसओवर रणनीति
- पंक्ति संकेतक का अनुसरण करें
- सुपरट्रेंड+4चल रहा है
- दिन के भीतर स्केलेबल अस्थिरता ट्रेडिंग रणनीति
- एटीआर औसत ब्रेकआउट रणनीति
अधिक
- फुकुइज़ रुझान
- जॉनी के बॉट
- एसएसएल हाइब्रिड
- झूमर से बाहर निकलना
- रिज़ोट्टो
- ईएमए क्लाउड इंट्राडे रणनीति
- पिवोट पॉइंट सुपरट्रेंड
- सुपरट्रेंड+4चल रहा है
- गति-आधारित ज़िगज़ैग
- VuManChu Cipher B + Divergences रणनीति
- सुपर स्केलर
- बैकटेस्टिंग- सूचक
- ट्रेंडिलियस
- एसएमए बीटीसी हत्यारा
- एमएल अलर्ट टेम्पलेट
- ब्रेक के साथ फिबोनाची प्रगति
- आरएसआई एमटीएफ ओबी+ओ
- फुकुइज़ ऑक्टा-ईएमए + इचिमोकू
- सीसीआई एमटीएफ ओबी+ओ
- स्मार्ट एमएसीडी