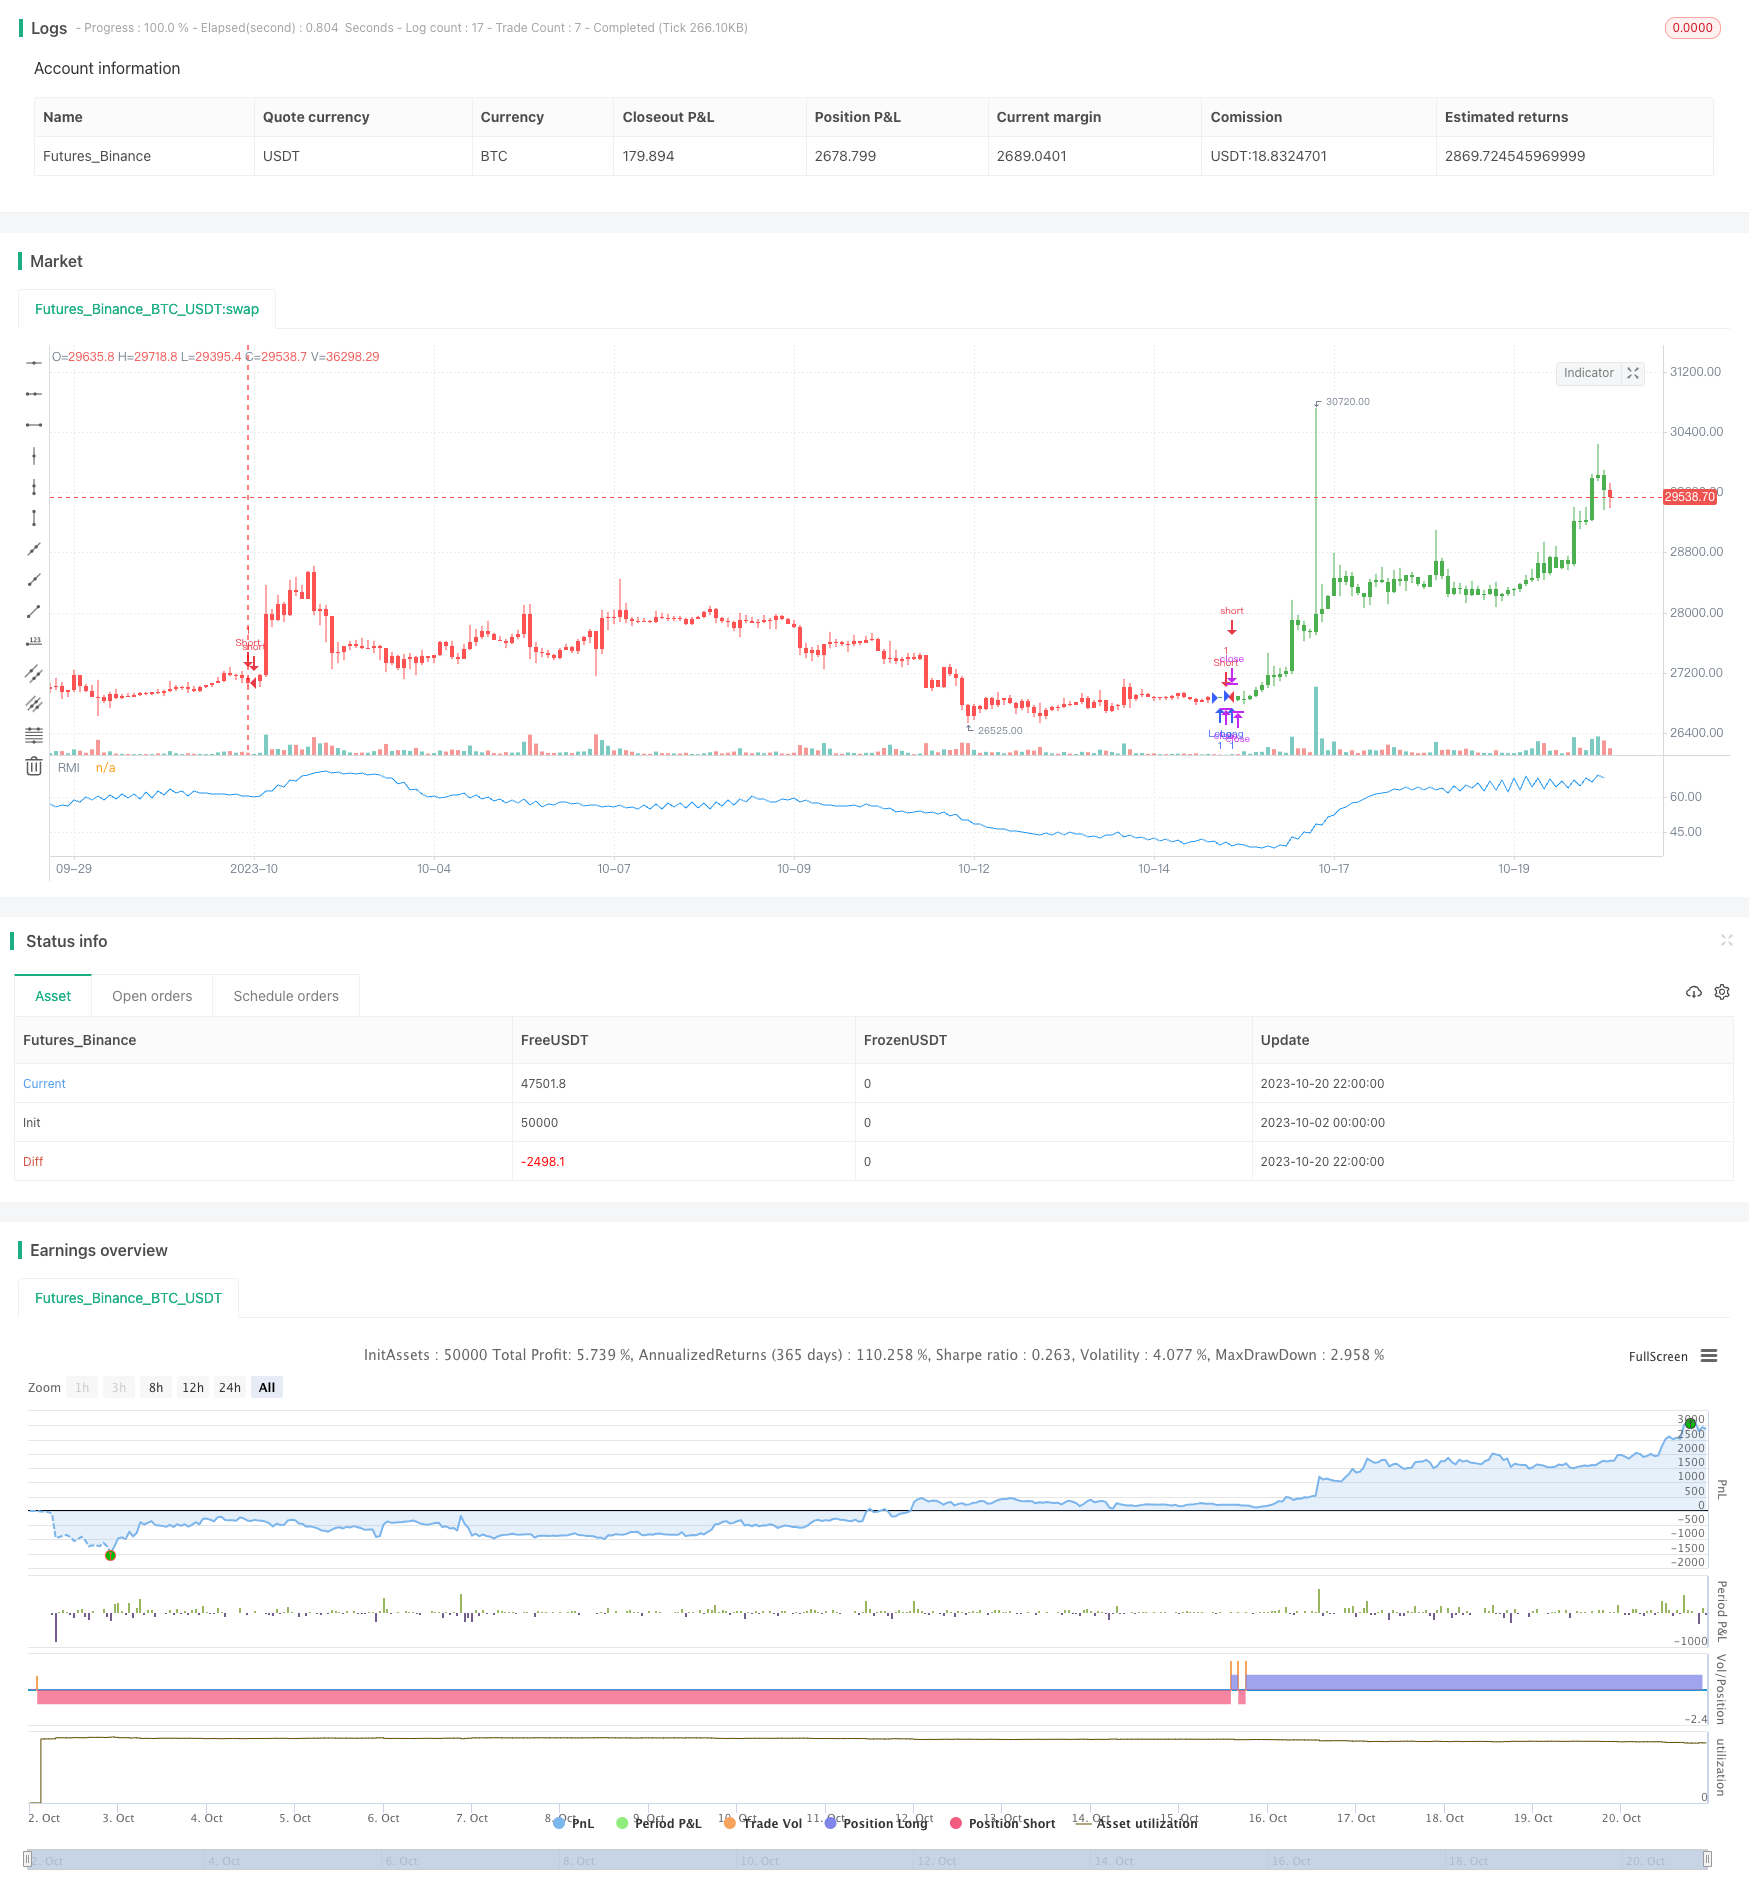
सापेक्ष गति सूचकांक रणनीति
लेखक:चाओझांग, दिनांक: 2023-11-02 17:21:45टैगः

अवलोकन
सापेक्ष गति सूचकांक (आरएमआई) रणनीति गति सूचकांक के आधार पर एक बेहतर संस्करण है। यह यह निर्धारित करने के लिए एक अवधि में मूल्य गति की गणना करता है कि क्या बाजार ओवरबॉट या ओवरसोल्ड है, ताकि उलट अवसरों को पकड़ सकें।
रणनीति तर्क
आरएमआई की गणना का सूत्र इस प्रकार है:
xMom = xPrice - xPrice[Length]  // Price change over Length periods
xMU = If xMom >= 0: previous xMU minus xMU/Length plus xMom; else: previous xMU
xMD = If xMom <= 0: previous xMD minus xMD/Length plus absolute value of xMom; else: 0
RM = xMU / xMD
RMI = 100 * (RM / (1 + RM))
सबसे पहले लंबाई अवधि में मूल्य परिवर्तन xMom की गणना करें। यदि xMom>=0, जिसका अर्थ है कि मूल्य बढ़ता है, तो इसे xMU में जमा करें; यदि xMom<0, जिसका अर्थ है कि मूल्य गिरता है, तो इसके पूर्ण मूल्य को xMD में जमा करें। RM xMU और xMD के बीच अनुपात है, जो उतार-चढ़ाव की गति का प्रतिनिधित्व करता है। RMI RM को 0-100 की सीमा में सामान्य करता है।
जब आरएमआई SellZone की सीमा से अधिक होता है, तो बाजार ओवरबॉट होता है, शॉर्ट हो जाता है। जब आरएमआई BuyZone से कम होता है, तो बाजार ओवरसोल्ड होता है, लॉन्ग हो जाता है।
लाभ
- आरएसआई की तुलना में आरएमआई अधिक संवेदनशील होता है और इससे पहले रिवर्स अवसरों को पकड़ सकता है।
- आरएमआई उतार-चढ़ाव की गति को मापता है, जो समेकन से कम प्रभावित होता है।
- गति के आधार पर, आरएमआई ओवरबॉट/ओवरसोल्ड स्थिति को बेहतर ढंग से निर्धारित कर सकता है।
जोखिम
- अन्य उलट रणनीति की तरह, आरएमआई में मजबूत रुझानों द्वारा रोके जाने का खतरा है। लंबे संकेतों का उल्लंघन हो सकता है।
- आरएमआई मापदंडों को विभिन्न उत्पादों के लिए अनुकूलित करने की आवश्यकता है, अन्यथा परिणाम खराब हो सकते हैं।
- अधिक खरीदे/बेचे जाने की सीमाओं को उचित रूप से निर्धारित किया जाना चाहिए, अन्यथा बहुत सारे झूठे संकेत हो सकते हैं।
स्टॉप लॉस को बढ़ाकर, मापदंडों को अनुकूलित करके, ट्रेंड रणनीतियों के साथ जोड़कर आदि जोखिमों को कम किया जा सकता है।
सुधार
आरएमआई रणनीति में निम्नलिखित पहलुओं से सुधार किया जा सकता हैः
- अधिकतम वापसी के लिए लंबाई पैरामीटर अनुकूलित करें.
- झूठे संकेतों को कम करने के लिए ओवरबॉट/ओवरसोल्ड सीमाओं को अनुकूलित करें।
- एकल हानि को नियंत्रित करने के लिए स्टॉप लॉस जोड़ें.
- जीतने की दर बढ़ाने के लिए ट्रेंड फॉलो या मूविंग एवरेज रणनीतियों के साथ संयोजन करें।
- स्थिरता में सुधार के लिए उत्पाद की विशेषताओं के आधार पर उपयुक्त ट्रेडिंग सत्रों का चयन करें।
निष्कर्ष
आरएमआई रणनीति मूल्य गति परिवर्तन को मापकर अल्पकालिक पुलबैक अवसरों पर कब्जा करती है। आरएसआई की तुलना में, आरएमआई समेकन के लिए अधिक संवेदनशील और मजबूत है। लेकिन बंद होने के जोखिम मौजूद हैं। प्रदर्शन को अधिकतम करने के लिए मापदंडों को अनुकूलित और प्रवृत्ति रणनीतियों के साथ संयुक्त करने की आवश्यकता है।
/*backtest
start: 2023-10-02 00:00:00
end: 2023-10-21 00:00:00
period: 2h
basePeriod: 15m
exchanges: [{"eid":"Futures_Binance","currency":"BTC_USDT"}]
*/

//@version=2
////////////////////////////////////////////////////////////
//  Copyright by HPotter v1.0 19/10/2017
// The Relative Momentum Index (RMI) was developed by Roger Altman. Impressed
// with the Relative Strength Index's sensitivity to the number of look-back
// periods, yet frustrated with it's inconsistent oscillation between defined
// overbought and oversold levels, Mr. Altman added a momentum component to the RSI.
// As mentioned, the RMI is a variation of the RSI indicator. Instead of counting
// up and down days from close to close as the RSI does, the RMI counts up and down
// days from the close relative to the close x-days ago where x is not necessarily
// 1 as required by the RSI). So as the name of the indicator reflects, "momentum" is
// substituted for "strength".
//
// You can change long to short in the Input Settings
// WARNING:
// - For purpose educate only
// - This script to change bars colors.
////////////////////////////////////////////////////////////
strategy(title="Relative Momentum Index", shorttitle="RMI")
xPrice = close
Length = input(20, minval=1)
BuyZone = input(40, minval=1)
SellZone = input(70, minval=1)
reverse = input(false, title="Trade reverse")
// hline(0, color=gray, linestyle=dashed)
// hline(SellZone, color=red, linestyle=line)
// hline(BuyZone, color=green, linestyle=line)
xMom = xPrice - xPrice[Length]
xMU = iff(xMom >= 0, nz(xMU[1], 1) - (nz(xMU[1],1) / Length) + xMom, nz(xMU[1], 1))
xMD = iff(xMom <= 0, nz(xMD[1], 1) - (nz(xMD[1],1) / Length) + abs(xMom), nz(xMD[1], 0))
RM = xMU / xMD
nRes = 100 * (RM / (1+RM))
pos = iff(nRes < BuyZone, 1,
	   iff(nRes > SellZone, -1, nz(pos[1], 0)))
possig = iff(reverse and pos == 1, -1,
          iff(reverse and pos == -1, 1, pos))
if (possig == 1)
    strategy.entry("Long", strategy.long)
if (possig == -1)
    strategy.entry("Short", strategy.short)
barcolor(possig == -1 ? red: possig == 1 ? green : blue )
plot(nRes, color=blue, title="RMI")
- ट्रेंड ब्रेकआउट मूविंग एवरेज ट्रैकिंग रणनीति
- वॉल्यूम ऑसिलेटर आधारित ट्रेंड ट्रैकिंग रणनीति
- सुपरट्रेंड और फिशर ट्रांसफॉर्म पर आधारित दीर्घकालिक रणनीति का अनुसरण करने वाली प्रवृत्ति
- दोहरी गोल्डन क्रॉस रिवर्सल ट्रेडिंग रणनीति
- फिबोनाची ने ट्रेडिंग रणनीति स्क्रिप्ट को वापस ले लिया
- आरएसआई-बीबी मोमेंटम ब्रेकआउट रणनीति
- ब्रेकआउट बैंड फिक्स्ड स्टॉप लॉस रणनीति
- आरएसआई और सुपरट्रेंड आधारित द्विदिशात्मक ट्रेडिंग रणनीति
- ईएमए 13 48 ट्रेंड फॉलोिंग स्ट्रेटेजी
- विलियम्स संचय/वितरण (विलियम्स एडी) रणनीति
- डबल बॉक्स ट्रेंड फॉलोइंग सिस्टम
- स्टॉक ट्रेडिंग के लिए विस्तारित चलती औसत सीमा के साथ मार्टिंगेल रणनीति
- बैल और भालू संतुलन रणनीति
- ओमा और अपोलो दोहरी रेल व्यापार रणनीति
- दोहरी चलती औसत क्रॉसओवर रणनीति
- दोहरी संकेत प्रवृत्ति ट्रैकिंग रणनीति
- एसएमए रणनीति के बाद का रुझान
- शेर के दरार संतुलन रणनीति
- अनुकूली एटीआर मूविंग एवरेज ट्रेडिंग रणनीति
- दो-दिशात्मक रिवर्स रणनीति