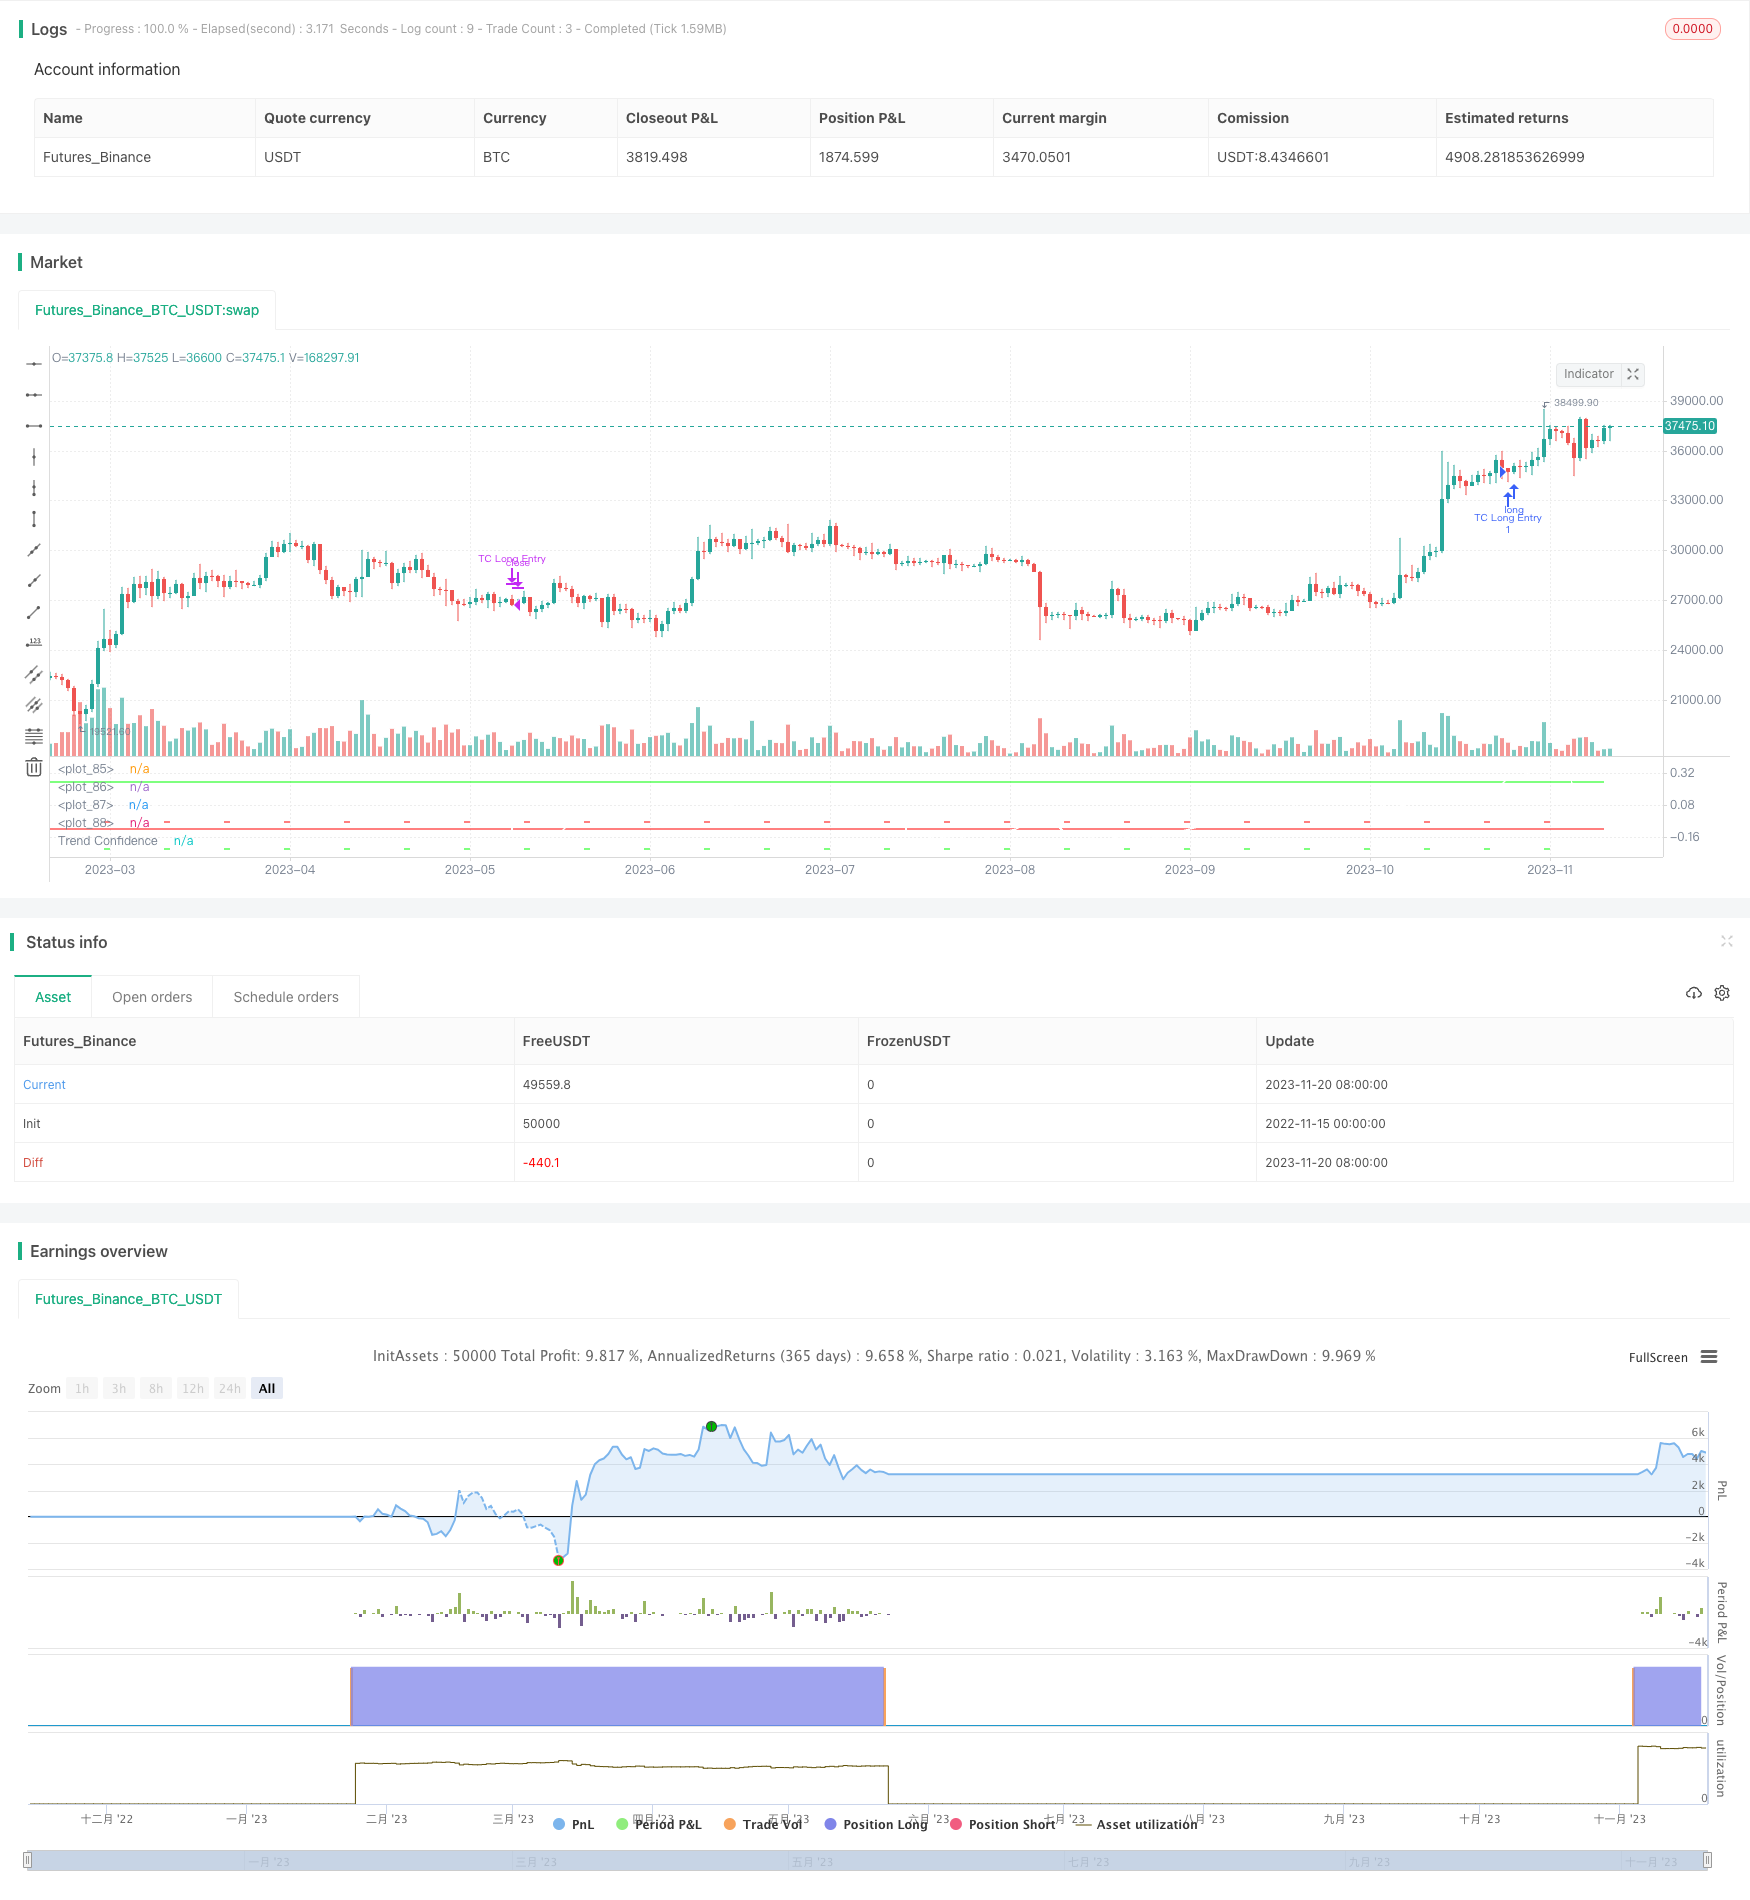
प्रवृत्ति के आधार पर ट्रेंड फॉलो करने वाली रणनीति
लेखक:चाओझांग, दिनांकः 2023-11-22 15:50:07टैगः

अवलोकन
इस रणनीति का मुख्य विचार एक प्रवृत्ति के बाद की रणनीति को लागू करना है जो यथासंभव सटीक है। यह पिछले बंद होने की कीमतों की एक निश्चित संख्या के
रणनीतिक सिद्धांत
यह रणनीति सामान्य रैखिक प्रतिगमन का उपयोग करके पिछले N समापन कीमतों के रैखिक फिट की गणना करती है, समापन कीमतों से विचलन की ढलान k और मानक विचलन σ प्राप्त करती है। फिर प्रवृत्ति विश्वास को k/σ के रूप में परिभाषित किया जाता है।
जब रुझान आत्मविश्वास
इस प्रकार यह जंगली मूल्य आंदोलनों से संकेतों को फ़िल्टर कर सकता है जो एक स्पष्ट रैखिक प्रवृत्ति का पालन नहीं करते हैं।
लाभ विश्लेषण
यह रणनीति सांख्यिकी में रुझान के अनुसरण और रैखिक प्रतिगमन विधियों को जोड़ती है, जो अल्पकालिक मूल्य उतार-चढ़ाव का पालन करने से बच सकती है और केवल दीर्घकालिक रुझानों का पालन कर सकती है, इस प्रकार कम व्यापार आवृत्ति और उच्च जीत दर प्राप्त होती है।
रणनीति में पैरामीटर ट्यूनिंग के लिए बड़ा स्थान है और पैरामीटर को समायोजित करके विभिन्न उत्पादों और समय सीमाओं के लिए अनुकूलित किया जा सकता है, जिससे अच्छी सामान्यीकरण क्षमता प्राप्त होती है।
जोखिम विश्लेषण
रणनीति में फंसने का खतरा है। जब महत्वपूर्ण रुझान उलटता है तो यह बड़े नुकसान पैदा करेगा। इसके अलावा, अनुचित पैरामीटर सेटिंग्स से ओवरट्रेडिंग या अच्छे ट्रेडिंग अवसरों को याद करने का भी कारण बन सकता है।
डाउनसाइड जोखिम को नियंत्रित करने के लिए स्टॉप लॉस सेट किया जा सकता है। साथ ही, ओवरफिटिंग से बचने के लिए मापदंडों के चयन का सावधानीपूर्वक मूल्यांकन किया जाना चाहिए।
अनुकूलन दिशाएँ
इस रणनीति को निम्नलिखित पहलुओं में और अधिक अनुकूलित किया जा सकता हैः
-
मुनाफे को लॉक करने और जोखिमों को नियंत्रित करने के लिए स्टॉप लॉस/टेक प्रॉफिट लॉजिक जोड़ें
-
गतिशील पैरामीटर समायोजन के लिए अनुकूलन अनुकूलन मॉड्यूल जोड़ें
-
ट्रेंड रिवर्समेंट पॉइंट्स को निर्धारित करने और जीत दर में और सुधार करने के लिए मशीन लर्निंग मॉडल जोड़ें
-
सामान्यीकरण में सुधार के लिए विभिन्न उत्पादों और समय सीमाओं पर अनुकूलन क्षमता का परीक्षण करें
निष्कर्ष
आम तौर पर, यह जोखिम नियंत्रण के साथ एक दीर्घकालिक प्रवृत्ति अनुसरण रणनीति है। यह शोर व्यापार संकेतों को फ़िल्टर करने के लिए प्रवृत्ति अनुसरण और रैखिक प्रतिगमन विधियों को जोड़ती है। पैरामीटर ट्यूनिंग के माध्यम से, यह विभिन्न उत्पादों और समय सीमाओं के लिए अच्छी तरह से अनुकूलित हो सकता है, और गहन अनुसंधान और सुधार के लायक एक प्रभावी रणनीति है।
/*backtest
start: 2022-11-15 00:00:00
end: 2023-11-21 00:00:00
period: 1d
basePeriod: 1h
exchanges: [{"eid":"Futures_Binance","currency":"BTC_USDT"}]
*/

// This source code is subject to the terms of the Mozilla Public License 2.0 at https://mozilla.org/MPL/2.0/
// © carefulCamel61097

// ################################################################################################

// "This is a trend following strategy that performed very well on the past 5 years"
// "Intended to be used on BTC-USDT, 4hr timeframe"

// "A factor 2 Leverage can be added by changing Order Size to 200% of equity"
// "Higher leverage is not recommended due to big drawdowns"

// "Also seems to work on 1D timeframe, although ideal parameters may be different"
// "Also seems to work on ETH-USDT and some other altcoins, although ideal parameters are different"

// ################################################################################################

//@version=5
strategy("Trend Following based on Trend Confidence", overlay=false )

// Inputs

source      = input(close)

since       = input(timestamp('2000-01-01'), title='Start trading interval')
till        = input(timestamp('2030-01-01'), title='End trading interval')

length      = input(30, title='Length')

longs_on    = input.bool(true, title='Longs')
shorts_on   = input.bool(true, title='Shorts')

// Parameters for best performance 2018 - 2022
// long_entry  = input.float(0.26, step=0.01, title='Long entry threshold')
// long_exit   = input.float(-0.10, step=0.01, title='Long exit threshold')
// short_entry = input.float(-0.24, step=0.01, title='Short entry threshold')
// short_exit  = input.float(-0.04, step=0.01, title='Short exit threshold')

long_entry  = input.float(0.25, step=0.01, title='Long entry threshold')
long_exit   = input.float(-0.10, step=0.01, title='Long exit threshold')
short_entry = input.float(-0.25, step=0.01, title='Short entry threshold')
short_exit  = input.float(-0.05, step=0.01, title='Short exit threshold')

stop_loss   = input.float(10, step=1, title='Stop loss (percentage)') / 100

// Trend Confidence

linreg = ta.linreg(source, length, 0)
linreg_p = ta.linreg(source, length, 0+1)

x = bar_index
slope = linreg - linreg_p
intercept = linreg - x*slope
deviationSum = 0.0
for i = 0 to length-1
    deviationSum := deviationSum + math.pow(source[i]-(slope*(x-i)+intercept), 2)
deviation = math.sqrt(deviationSum/(length))

slope_perc = slope / source[0]
deviation_perc = deviation / source[0]
trend_confidence = slope_perc / deviation_perc

// Strategy

in_interval = true

sl_long = strategy.position_avg_price * (1 - stop_loss)
sl_short = strategy.position_avg_price * (1 + stop_loss)

if in_interval and longs_on and ta.crossover(trend_confidence, long_entry)
    strategy.entry("TC Long Entry", strategy.long)
    strategy.exit("TC Long Exit", stop=sl_long)
if in_interval and longs_on and ta.crossunder(trend_confidence, long_exit)
    strategy.close("TC Long Entry")

if in_interval and shorts_on and ta.crossunder(trend_confidence, short_entry)
    strategy.entry("TC Short Entry", strategy.short)
    strategy.exit("TC Short Exit", stop=sl_short)
if in_interval and shorts_on and ta.crossover(trend_confidence, short_exit)
    strategy.close("TC Short Entry")

// Plots

plot(trend_confidence, "Trend Confidence", color.rgb(255, 255, 255))

plot(long_entry, "", color.rgb(0, 255, 0), linewidth=1)
plot(long_exit, "", color.rgb(255, 0, 0), linewidth=1)
plot(short_entry, "", color=bar_index % 10 == 0 ? color.rgb(0, 255, 0) : #00000000, linewidth=1)
plot(short_exit, "", color=bar_index % 10 == 0 ? color.rgb(255, 0, 0) : #00000000, linewidth=1)
- आधुनिक लैगुएरे रूपांतरण सापेक्ष शक्ति सूचकांक अनुकूलन रणनीति
- दोहरी चलती औसत क्रॉसओवर ट्रेंड रणनीति
- बोलिंगर बैंड ट्रेंड चेसर
- चलती औसत क्रॉसओवर रणनीति
- काइरो रणनीति
- स्टोकैस्टिक और सीसीआई पर आधारित रणनीति के बाद की प्रवृत्ति
- डीपीडी-आरएसआई-बीबी मात्रात्मक रणनीति
- दोहरी चलती औसत क्रॉसओवर रणनीति
- रिवर्स ओपनिंग एग्लोविंग रणनीति
- कई तकनीकी संकेतक गति ब्रेकआउट रणनीति
- निचले हिस्से को पकड़ने की रणनीति
- एसएमए आधारित दोहरी धक्का रणनीति
- GetString गति सफलता रणनीति
- द्वि-ट्रैक प्रणाली गति व्यापार रणनीति
- क्रॉस पीरियड ब्रेकथ्रू सिस्टम
- दोहरी प्रवृत्ति रेखाएं बुद्धिमान ट्रैकिंग बीटीसी निवेश रणनीति
- आरएसआई और टी3 संकेतकों पर आधारित पीएमएक्स ब्रेकआउट रणनीति
- आरएसआई डबल क्रॉस रिवर्सल रणनीति
- 123 रिवर्स मूविंग एवरेज कन्वर्जेंस डिवर्जेंस संयोजन रणनीति
- हेकिन आशी हाईलो चैनल डायनेमिक मूविंग एवरेज ट्रेडिंग रणनीति