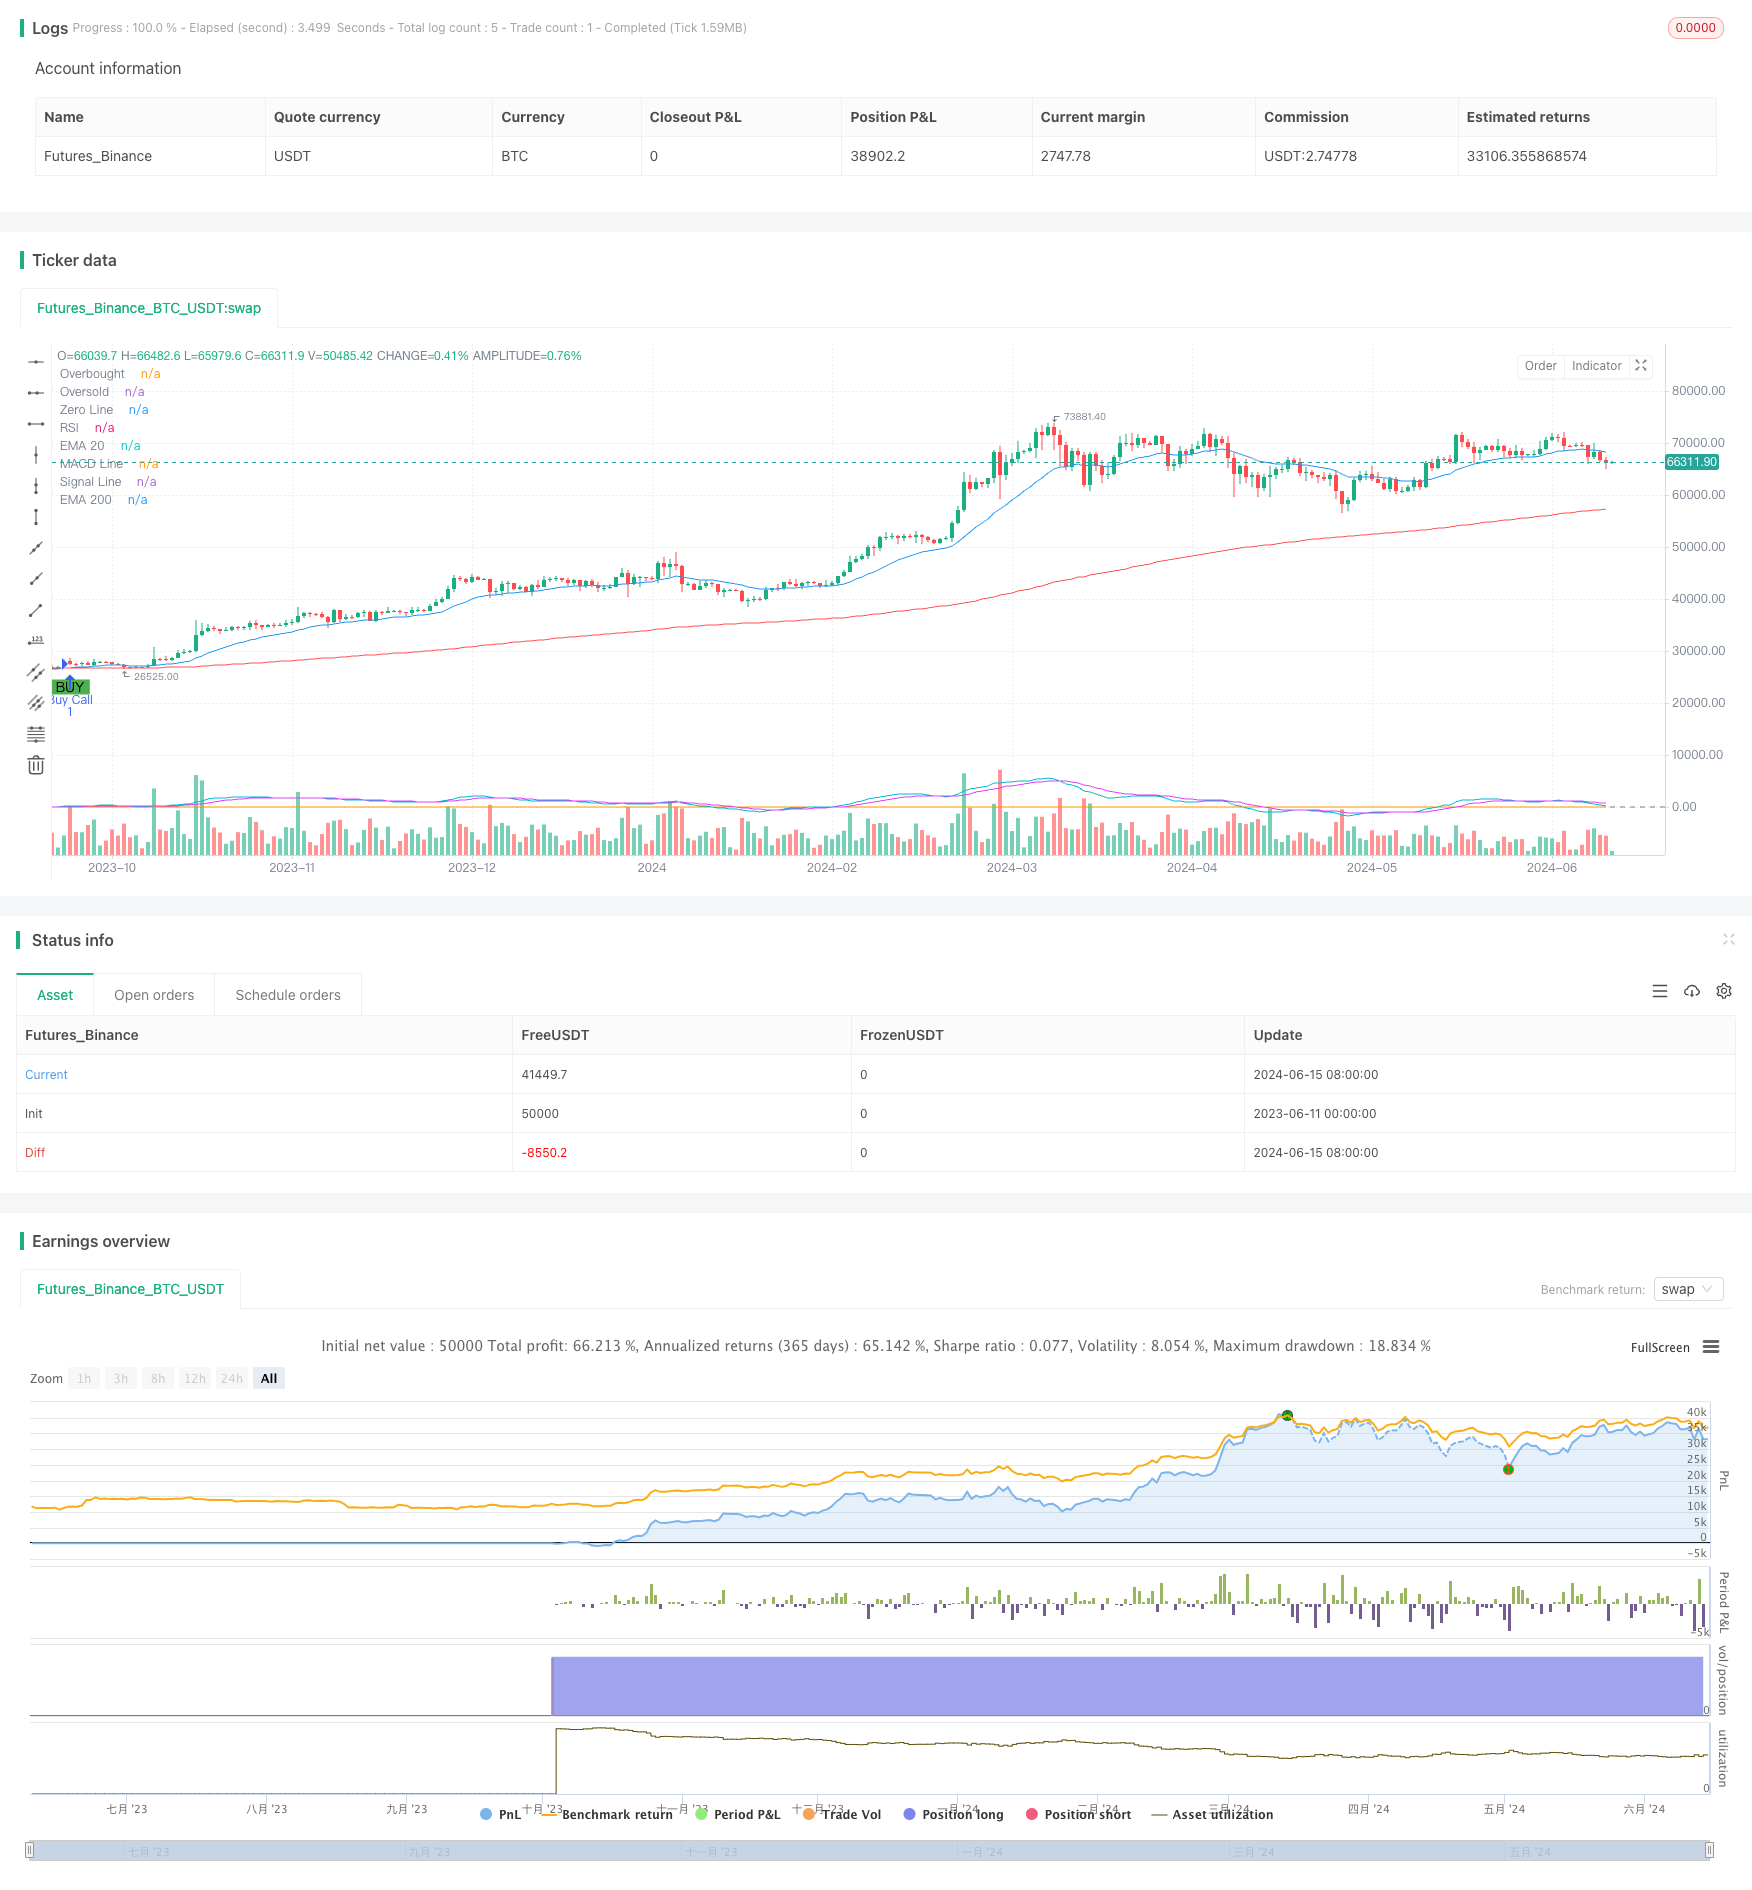
अवलोकन
यह रणनीति 20 और 200 दिन के सूचकांक चलती औसत (EMA) के क्रॉस सिग्नल पर आधारित है और इसे अपेक्षाकृत कमजोर संकेतकों (RSI) और चलती औसत समापन और फैलाव के संकेतकों (MACD) के साथ संयोजन में पुष्टि की जाती है, जिससे खरीद और बेचने के संकेत मिलते हैं। साथ ही, यह रणनीति गतिशील स्टॉप-लॉस और स्थिर लक्ष्य-लाभ के तरीकों का उपयोग करती है ताकि ट्रेडिंग जोखिम का प्रबंधन किया जा सके और मुनाफे को लॉक किया जा सके।
रणनीति सिद्धांत
- 20 और 200 दिन ईएमए की गणना करें, जब 20 दिन ईएमए पर 200 दिन ईएमए पार किया जाता है, तो एक खरीद संकेत उत्पन्न होता है; जब 20 दिन ईएमए के नीचे 200 दिन ईएमए पार किया जाता है, तो एक बिक्री संकेत उत्पन्न होता है।
- ईएमए क्रॉस सिग्नल की पुष्टि करने के लिए आरएसआई और एमएसीडी का उपयोग करते हुए, खरीद केवल तभी निष्पादित की जाती है जब आरएसआई 50 से ऊपर हो और एमएसीडी लाइन सिग्नल लाइन से ऊपर हो; बिक्री केवल तभी निष्पादित की जाती है जब आरएसआई 50 से नीचे हो और एमएसीडी लाइन सिग्नल लाइन से नीचे हो।
- एक निश्चित लक्ष्य रिटर्न दर (जैसे 20%) और एक प्रारंभिक स्टॉप लॉस दर (जैसे 10%) निर्धारित करें।
- जब होल्डिंग लाभ लक्ष्य रिटर्न दर तक पहुंचता है, तो स्टॉप लॉस को वर्तमान मूल्य के 10% से नीचे बढ़ाकर गतिशील स्टॉप लॉस प्राप्त करें।
- जब कीमत गतिशील स्टॉप-लॉस कीमत को छूती है, तो प्वाइंट मुनाफा कमाता है।
रणनीतिक लाभ
- ट्रेडिंग सिग्नल की विश्वसनीयता को बढ़ाने के लिए कई तकनीकी संकेतकों के संयोजन के साथ।
- गतिशील स्टॉप-लॉस विधि का उपयोग करें, लाभ को लॉक करते हुए, कीमत को कुछ वापसी की जगह दें, और समय से पहले बंद होने से बचें।
- एक निश्चित लक्ष्य रिटर्न दर निर्धारित करना जो जोखिम को नियंत्रित करने और स्थिर रिटर्न प्राप्त करने में मदद करता है।
रणनीतिक जोखिम
- ईएमए क्रॉस सिग्नल में अक्सर झूठे सिग्नल हो सकते हैं, जिससे लेनदेन की लागत बढ़ जाती है।
- इस रणनीति का उपयोग अस्थिर बाजारों में लगातार घाटे के लिए किया जा सकता है।
- निश्चित लक्षित रिटर्न और स्टॉप लॉस दरों को अलग-अलग बाजार स्थितियों के लिए अनुकूलित नहीं किया जा सकता है और बाजार की अस्थिरता के आधार पर उन्हें समायोजित करने की आवश्यकता होती है।
रणनीति अनुकूलन दिशा
- सिग्नल की सटीकता और विश्वसनीयता बढ़ाने के लिए अधिक तकनीकी या बाजार भावना के संकेतकों को पेश करना।
- बाजार की अस्थिरता और परिसंपत्ति विशेषताओं के अनुसार गतिशील रूप से समायोजित करने के लिए अनुकूलित लक्ष्य रिटर्न और स्टॉप लॉस दरों का उपयोग करना।
- बाजार की प्रवृत्ति और उतार-चढ़ाव की अवधि के साथ, विभिन्न बाजार स्थितियों में विभिन्न पैरामीटर सेटिंग्स का उपयोग करना।
संक्षेप
ईएमए क्रॉस सिग्नल के साथ आरएसआई और एमएसीडी की पुष्टि के साथ-साथ गतिशील स्टॉपलॉस और फिक्स्ड टारगेट रिटर्न के लिए एक जोखिम प्रबंधन विधि के माध्यम से रणनीति, ट्रेंडिंग बाजार में स्थिर लाभप्रदता की उम्मीद करती है। लेकिन अस्थिर बाजारों में, रणनीति को अक्सर व्यापार और लगातार नुकसान के जोखिम का सामना करना पड़ सकता है। इसलिए, रणनीति की अनुकूलन और स्थिरता को बढ़ाने के लिए आगे अनुकूलन और सुधार की आवश्यकता है।
/*backtest
start: 2023-06-11 00:00:00
end: 2024-06-16 00:00:00
period: 1d
basePeriod: 1h
exchanges: [{"eid":"Futures_Binance","currency":"BTC_USDT"}]
*/

//@version=5
strategy("EMA Crossover Strategy with RSI and MACD Confirmation and Dynamic Trailing Stop Loss", overlay=true)

// Calculate EMAs
ema20 = ta.ema(close, 20)
ema200 = ta.ema(close, 200)

// Calculate RSI
rsi = ta.rsi(close, 14)

// Calculate MACD
[macdLine, signalLine, _] = ta.macd(close, 12, 26, 9)

// Plot EMAs, RSI, and MACD on the chart
plot(ema20, color=color.blue, title="EMA 20")
plot(ema200, color=color.red, title="EMA 200")
hline(70, "Overbought", color=color.red)
hline(30, "Oversold", color=color.green)
plot(rsi, title="RSI", color=color.orange)
hline(0, "Zero Line", color=color.gray)
plot(macdLine, title="MACD Line", color=color.aqua)
plot(signalLine, title="Signal Line", color=color.fuchsia)

// Strategy parameters
targetProfitPercent = 20
trailingStopIncrement = 10

// Strategy variables
var float initialStopLevel = na
var float trailingStopLevel = na

// Strategy rules with RSI and MACD confirmation
longCondition = ta.crossover(ema20, ema200) and rsi > 50 and macdLine > signalLine
shortCondition = ta.crossunder(ema20, ema200) and rsi < 50 and macdLine < signalLine

// Execute trades
if (longCondition)
    strategy.entry("Buy Call", strategy.long)
    initialStopLevel := strategy.position_avg_price * (1 - 0.10) // Initial stop-loss at 10% below entry price

if (shortCondition)
    strategy.entry("Buy Put", strategy.short)

// Calculate profit and loss targets
takeProfit = strategy.position_avg_price * (1 + targetProfitPercent / 100) // 20% profit target

// Update trailing stop loss
if (strategy.opentrades > 0)
    if (strategy.position_size > 0) // Long position
        if (strategy.netprofit >= takeProfit)
            // Update stop-loss based on profit increments
            if (trailingStopLevel == na)
                trailingStopLevel := strategy.position_avg_price * (1 - 0.10) // Initial trailing stop at 10% below entry price
            else
                if (strategy.position_avg_price * (1 - 0.10) > trailingStopLevel)
                    trailingStopLevel := strategy.position_avg_price * (1 - 0.10) // Increase stop-loss to 10% below current price

        // Apply trailing stop loss
        strategy.exit("Take Profit", "Buy Call", stop=trailingStopLevel)

// Plot buy and sell signals on the chart
plotshape(series=longCondition, title="Buy Signal", location=location.belowbar, color=color.green, style=shape.labelup, text="BUY")
plotshape(series=shortCondition, title="Sell Signal", location=location.abovebar, color=color.red, style=shape.labeldown, text="SELL")