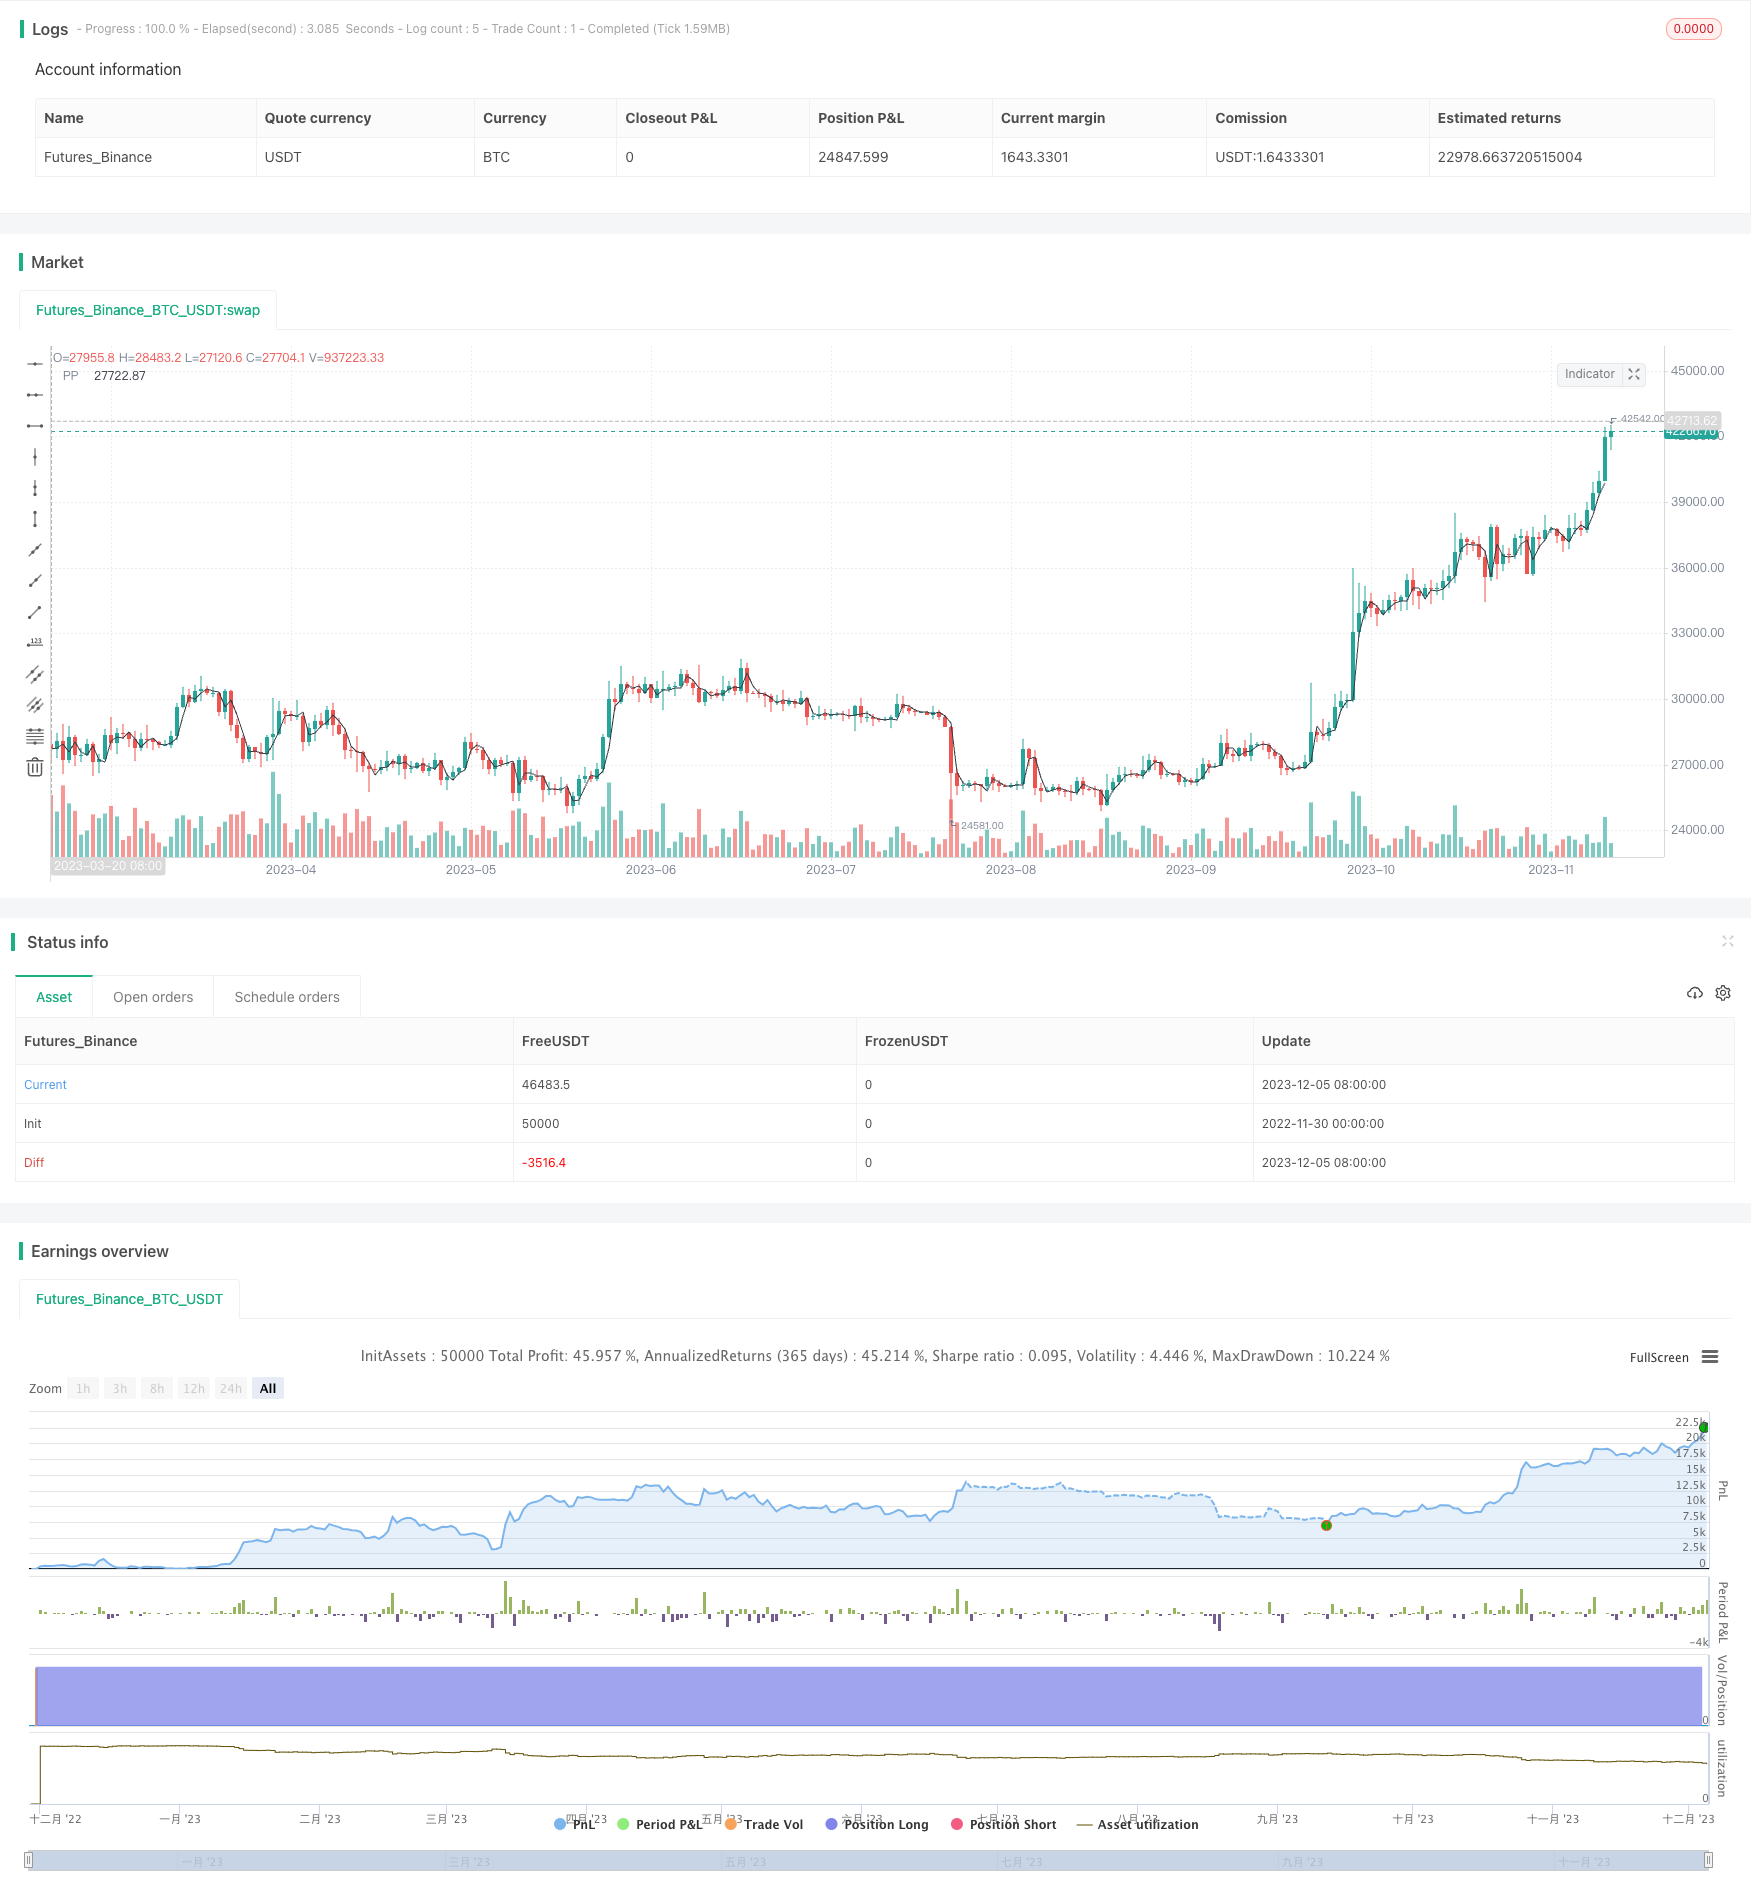
Strategi poin penting perdagangan intraday

Ringkasan
Ini adalah strategi titik kritis dalam perdagangan harian India, yang menggunakan harga buka, harga tertinggi, harga terendah, dan harga penutupan untuk menghitung titik-titik dukungan dan resistensi utama, dan melakukan perdagangan ketika harga terobosan terjadi di titik-titik ini.
Prinsip Strategi
- Hitung harga tertinggi, terendah, dan penutupan hari sebelumnya
- Perhitungkan titik dukungan utama S1, titik resistensi R1 dan titik kritis PP berdasarkan rumus
- Ketika harga menembus titik-titik penting ini, masuklah ke posisi jual atau jual
- Setting Stop Loss Withdrawal Mechanism
Rumus untuk menghitung titik kritis utama adalah sebagai berikut:
PP = (最高价+最低价+收盘价)/3
R1 = 2*PP - 最低价
S1 = 2*PP - 最高价
Analisis Keunggulan
- Menggunakan titik-titik kunci untuk memberikan peluang terobosan dengan probabilitas tinggi untuk meningkatkan peluang keuntungan
- Titik kunci mudah ditentukan, aturan transaksi jelas
- Stop loss mudah diatur, pengendalian risiko efektif
Analisis risiko
- Hal ini dikarenakan adanya risiko terjadinya penembusan palsu di titik-titik penting yang mengakibatkan kerugian.
- Keberkesanan titik-titik penting perlu diverifikasi, tidak selalu efektif.
- Stop loss yang tidak tepat dapat memperbesar kerugian
Solusi untuk Mengatasi Risiko:
- combining with other indicators to filter false breakouts
- backtesting to validate strategy over long timeframes
- optimize stop loss placement
Arah optimasi
- Kombinasi dengan indikator teknis lainnya untuk memfilter sinyal penembusan palsu
- Optimalisasi parameter untuk varietas yang berbeda
- Dinamika penyesuaian stop loss
Meringkaskan
Strategi ini secara keseluruhan relatif sederhana dan mudah untuk memverifikasi keefektifan melalui data historis. Sebagai strategi perdagangan intraday, ia menggunakan titik-titik kunci untuk memberikan peluang tinggi untuk terobosan, yang dapat memberikan hasil yang baik. Namun, karena ketergantungan pada titik-titik kunci, ada juga risiko terobosan palsu, yang perlu dioptimalkan lebih lanjut untuk mengurangi.
/*backtest
start: 2022-11-30 00:00:00
end: 2023-12-06 00:00:00
period: 1d
basePeriod: 1h
exchanges: [{"eid":"Futures_Binance","currency":"BTC_USDT"}]
*/

// This source code is subject to the terms of the Mozilla Public License 2.0 at https://mozilla.org/MPL/2.0/
// © arameshraju
//Reference credit goes to All


//@version=4
strategy("ARR-Pivote-India-Stategy",shorttitle="ARR-PP-Ind", overlay=true)

// This source code is subject to the terms of the Mozilla Public License 2.0 at https://mozilla.org/MPL/2.0/
// © arameshraju
//User Input
showPrevDayHighLow = input(false, title="Show previous day's High & Low(PDH/PDL)", type=input.bool)
showPivoteLine = input(true, title="Show Pivot Point(PP)", type=input.bool)
showPivoteR1Line = input(false, title="Show Pivot Point Resistance (R1)", type=input.bool)
showPivoteS1Line = input(false, title="Show Pivot Point Support (S1)", type=input.bool)
tradeLong = input(true, title="Trade on Long Entry", type=input.bool)
tradeShort = input(false, title="Trade on Short Entry", type=input.bool)
maxLoss = input(0.5, title="Max Loss on one Trade", type=input.float)
tradeOn=input(title="Trade base Level", type=input.string,
     options=["PP", "PDH", "PDL","R1","S1"], defval="PP")

sessSpec = input("0915-1530", title="Session time", type=input.session)

// Defaults
// Colors
cColor = color.black
rColor = color.red
sColor = color.green

// Line style & Transparency
lStyle = plot.style_line
lTransp = 35

// Get High & Low
getSeries(_e, _timeFrame) => security(syminfo.tickerid, _timeFrame, _e, lookahead=barmerge.lookahead_on)

is_newbar(res, sess) =>
    t = time(res, sess)
    na(t[1]) and not na(t) or t[1] < t

newbar = is_newbar("375", sessSpec)
// Today's Session Start timestamp
y = year(timenow)
m = month(timenow)
d = dayofmonth(timenow)

// Start & End time for Today
start = timestamp(y, m, d, 09, 15)
end = start + 86400000


PrevDayHigh = getSeries(high[1], 'D')
PrevDayLow = getSeries(low[1], 'D')
PrevDayClose = getSeries(close[1], 'D')

PivoteLine=(PrevDayHigh+PrevDayLow+PrevDayClose) /3
PivoteR1=(PivoteLine*2) -PrevDayLow

PivoteS1=(PivoteLine*2) -PrevDayHigh

orbPrevDayOpen = getSeries(open[1], 'D')
orbPrevDayClose = getSeries(close[1], 'D')

// //Preview Day High line
// _pdh = line.new(start, PrevDayHigh, end, PrevDayHigh, xloc.bar_time, color=color.red, style=line.style_solid, width=2)
// line.delete(_pdh[1])
// _pdl = line.new(start, PrevDayLow, end, PrevDayLow, xloc.bar_time, color=color.green, style=line.style_solid, width=2)
// line.delete(_pdl[1])
// _Pp = line.new(start, PrevDayLow, end, PrevDayLow, xloc.bar_time, color=color.green, style=line.style_dashed, width=2)
// line.delete(_Pp[1])


// //Previous Day Low Line
// l_pdh = label.new(start, PrevDayHigh, text="PD", xloc=xloc.bar_time, textcolor=rColor, style=label.style_none)
// label.delete(l_pdh[1])
// l_pdl = label.new(start, PrevDayLow, text="PD", xloc=xloc.bar_time, textcolor=sColor, style=label.style_none)
// label.delete(l_pdl[1])

// //Pivote Line

// l_pp = label.new(start, PivoteLine, text="PP", xloc=xloc.bar_time, textcolor=color.black, style=label.style_none)
// label.delete(l_pp[1])
// l_R1 = label.new(start, PivoteR1, text="R1", xloc=xloc.bar_time, textcolor=color.fuchsia, style=label.style_none)
// label.delete(l_pp[1])
// l_SR = label.new(start, PivoteS1, text="S2", xloc=xloc.bar_time, textcolor=color.navy, style=label.style_none)
// label.delete(l_pp[1])


plot(showPrevDayHighLow?PrevDayHigh:na , title=' PDH', color=rColor)
plot(showPrevDayHighLow?PrevDayLow:na, title=' PDL', color=sColor)
plot(showPivoteLine?PivoteLine:na, title=' PP', color=color.black)
plot(showPivoteR1Line?PivoteR1:na, title=' R1', color=color.fuchsia)
plot(showPivoteS1Line?PivoteS1:na, title=' S1', color=color.navy)

// Today's Session Start timestamp
// Start & End time for Today
//endTime = timestamp(t, m, d, 15, 00)

tradeEventPrice= if string("PDH")==tradeOn
    PrevDayHigh
else if string("PDL")==tradeOn
    PrevDayLow
else if string("R1")==tradeOn
    PivoteR1
else if string("S1")==tradeOn
    PivoteS1
else
    PivoteLine


//tradeEventPrice=PrevDayHigh

if (open < tradeEventPrice) and ( close >tradeEventPrice ) and ( hour < 13 ) and tradeLong
	strategy.entry("buy", strategy.long, 1, when=strategy.position_size <= 0)

if (open > tradeEventPrice) and ( close <tradeEventPrice ) and ( hour < 13 ) and  tradeShort
	strategy.entry("Sell", strategy.short, 1, when=strategy.position_size <= 0)

mxloss=orbPrevDayClose*maxLoss

strategy.exit("exit", "buy",  loss = mxloss)
strategy.exit("exit", "Sell",  loss = mxloss)


strategy.close_all(when =   hour == 15   , comment = "close all entries")