Strategi Perdagangan Kuantitatif FNGU Berdasarkan Bollinger Bands dan RSI
Penulis:ChaoZhang, Tanggal: 2024-01-29 14:53:47Tag:

Gambaran umum
Strategi ini disebut
Logika Strategi
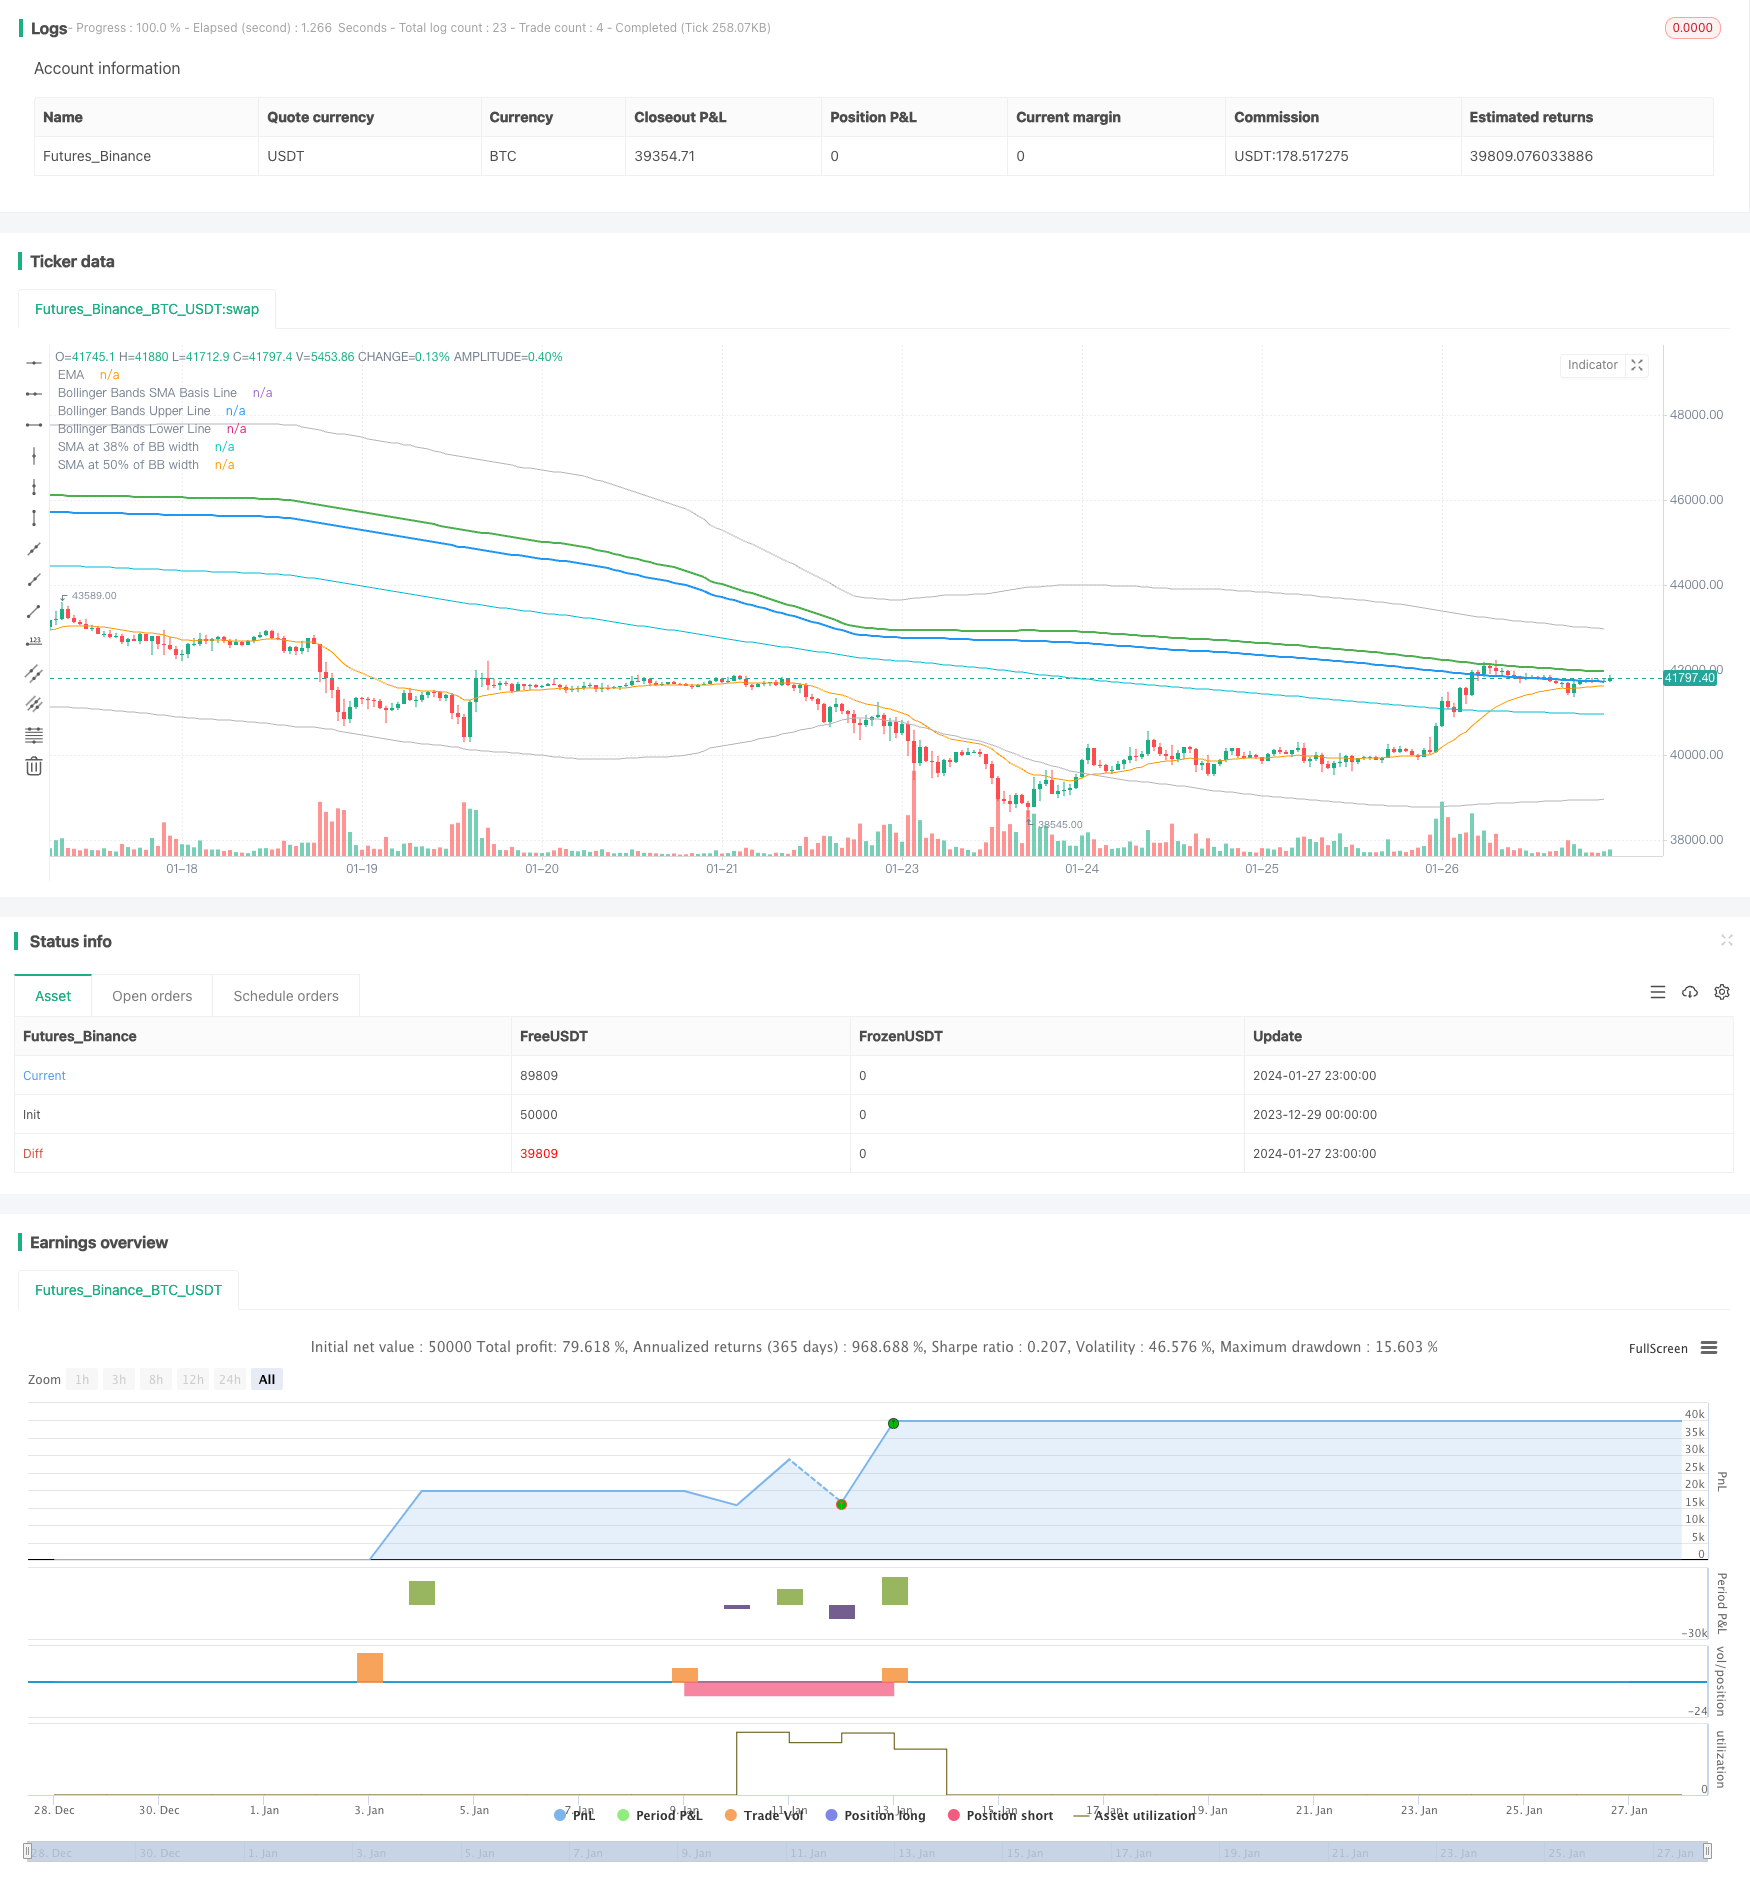
Logika inti dari strategi ini didasarkan pada kombinasi Bollinger Bands dan indikator RSI.
Pertama, Bollinger Bands berisi tiga garis: garis tengah, garis atas dan garis bawah. Garis tengah adalah rata-rata bergerak sederhana n hari, sementara garis atas dan garis bawah adalah k kali deviasi standar di atas dan di bawah garis tengah. Ketika harga mencapai atau menyentuh garis atas atau bawah, itu menunjukkan saham berada dalam keadaan overbought atau oversold.
Dalam strategi ini, durasi periode garis tengah Bollinger Bands adalah 235 hari, dan nilai parameter k adalah 2. Ini menghasilkan sinyal beli ketika harga turun di bawah garis bawah Bollinger atau melintasi di atas garis tengah, dan sinyal jual ketika harga naik di atas garis atas Bollinger.
Kedua, indikator RSI mencerminkan tingkat overbought/oversold saham. RSI di atas 70 menunjukkan status overbought, sementara di bawah 30 status oversold. Panjang periode parameter untuk RSI dalam strategi ini adalah 2.
Dalam strategi ini, Bollinger Bands dan indikator RSI digunakan bersama: Sinyal beli dihasilkan ketika RSI menembus level oversold sementara harga menyentuh atau jatuh di bawah garis bawah Bollinger. Sinyal jual dihasilkan ketika RSI pecah dari level overbought sementara harga naik di atas garis atas Bollinger.
Keuntungan dari Strategi
Strategi ini memiliki keuntungan berikut:
- Menggabungkan Bollinger Bands dan RSI membuat sinyal beli/jual lebih akurat dan dapat diandalkan.
- Bollinger Bands mengidentifikasi zona harga overbought/oversold, sementara RSI menyaring sinyal palsu.
- Ini hanya melakukan perdagangan panjang, tidak perlu mempertimbangkan risiko shorting.
- Parameter yang dioptimalkan membuatnya cocok khusus untuk stok FNGU yang sangat volatile.
- Ini menerapkan stop loss otomatis untuk mengurangi risiko kerugian.
- Realisasi pengkodean sederhana dan jelas, mudah dimengerti dan dimodifikasi.
Risiko dan Solusi
Ada juga beberapa risiko yang terkait dengan strategi ini:
- Kedua Bollinger Band dan RSI dapat menghasilkan sinyal palsu, dengan mudah menyebabkan overfit. Parameter dapat disesuaikan atau lebih banyak filter ditambahkan.
- FNGU sendiri memiliki volatilitas tinggi. pengaturan stop loss yang tidak tepat dapat meningkatkan kerugian. rentang stop loss harus diperluas.
- Strategi ini hanya berlaku untuk saham yang sangat fluktuatif seperti FNGU daripada yang lain. Parameter perlu disesuaikan untuk saham yang berbeda.
- Meskipun dioptimalkan, parameter dapat menjadi usang dengan perubahan pasar, yang membutuhkan pemantauan dan optimalisasi yang berkelanjutan.
Arahan untuk Optimasi Strategi
Ada beberapa arah untuk lebih mengoptimalkan strategi ini:
- Tambahkan indikator teknis lainnya seperti KDJ dan MACD untuk menghasilkan sinyal yang lebih akurat.
- Mengoptimalkan parameter Bollinger Bands dan RSI untuk menyesuaikan lebih banyak jenis saham.
- Masukkan model pembelajaran mesin untuk membantu pengambilan keputusan dengan lebih banyak data.
- Mengimplementasikan perdagangan inter-periodik menggunakan data jangka waktu yang lebih tinggi.
- Gabungkan analisis sentimen menggunakan data media sosial untuk menghasilkan sinyal perdagangan.
- Mengembangkan sistem backtesting kuantitatif untuk cepat menguji pengaturan parameter yang berbeda.
Kesimpulan
Ini adalah strategi jangka panjang yang sangat cocok untuk saham yang sangat fluktuatif seperti FNGU. Dengan menggabungkan Bollinger Bands dan RSI, ini menghasilkan sinyal perdagangan di sekitar tingkat harga overbought / oversold, yang bertujuan untuk menangkap peluang pembalikan harga. Masih ada ruang besar untuk optimasi untuk memperluas penerapannya dan meningkatkan kinerja.
/*backtest
start: 2023-12-29 00:00:00
end: 2024-01-28 00:00:00
period: 1h
basePeriod: 15m
exchanges: [{"eid":"Futures_Binance","currency":"BTC_USDT"}]
*/

//@version=4
strategy("Bollinger + RSI + EMA, Double Strategy Long-Only (by EMKM)", shorttitle="1Min Killer", overlay=true)

///////////// RSI
RSIlength = input(2, title="RSI Period Length") // Adjusted RSI period length
RSIoverSold = 50
RSIoverBought = 50
price = close
vrsi = rsi(price, RSIlength)

///////////// Bollinger Bands
BBlength = input(235, minval=1, title="Bollinger Period Length") // Adjusted Bollinger period length
BBmult = 2
BBbasis = sma(price, BBlength)
BBdev = BBmult * stdev(price, BBlength)
BBupper = BBbasis + BBdev
BBlower = BBbasis - BBdev
BBtarget38 = BBbasis + 0.38 * BBdev  // Line at 38% of Bollinger Band width
BBtarget50 = BBbasis + 0.50 * BBdev  // Line at 50% of Bollinger Band width

///////////// EMA
emaLength = input(20, title="EMA Period Length")
ema = ema(close, emaLength)

source = close
buyEntry = crossover(source, BBlower) or (close < BBlower and close > BBbasis) or (low < BBlower and close > BBbasis) // Add condition for low touching Bollinger Band
sellEntry = crossunder(source, BBupper)

///////////// Plotting
plot(BBbasis, color=color.aqua, title="Bollinger Bands SMA Basis Line")
plot(BBupper, color=color.silver, title="Bollinger Bands Upper Line")
plot(BBlower, color=color.silver, title="Bollinger Bands Lower Line")
plot(BBtarget38, color=color.blue, linewidth=2, title="SMA at 38% of BB width")  // Line at 38%
plot(BBtarget50, color=color.green, linewidth=2, title="SMA at 50% of BB width")  // Line at 50%
plot(ema, color=color.orange, title="EMA")  // Plot EMA

///////////// RSI + Bollinger Bands Strategy
longCondition = crossover(vrsi, RSIoverSold) and buyEntry
sellCondition = crossunder(vrsi, RSIoverBought) and close > BBupper

close_long = close > BBbasis
close_short = close < BBbasis

if (not na(vrsi))
    if longCondition
        strategy.entry("Buy", strategy.long, qty=10, stop=BBlower, comment="Buy")
    else
        strategy.cancel(id="Buy")

    if close_long
        strategy.close("Buy")

if (sellCondition)
    strategy.entry("Sell", strategy.short, qty=10, stop=BBupper, comment="Sell")
else
    strategy.cancel(id="Sell")

if close_short
    strategy.close("Sell")
- Strategi Penutupan Lilin EMA
- EMA Crossover Quantitative Trading Strategy Strategi perdagangan kuantitatif
- Strategi Stop-Loss Moving Average yang Dinamis
- Kembali rata-rata dengan strategi masuk secara bertahap
- Strategi Pelacakan Harga Rata-rata Dinamis
- Fraktal Williams Dikombinasikan dengan Indikator ZZ untuk Strategi Perdagangan Kuantitatif
- Strategi Trading Tren Berbagai Faktor
- Strategi perdagangan lintas rata-rata bergerak ganda
- Tren berdasarkan volume mengikuti strategi perdagangan
- Strategi pembalikan titik penting
- Bollinger Bands RSI Strategi OBV
- Strategi P-Signal Reversal
- RSI Alligator Trend Strategi
- Strategi FX harian Berdasarkan Moving Average dan Williams Indicator
- Strategi Perdagangan Breakout Saluran Rata-rata yang Bergerak
- Strategi Stochastic Rata-rata Bergerak Ganda
- Strategi Penembusan Saluran Donchian
- Strategi Pelacakan Tren Rata-rata Bergerak
- RSI Indikator Grid Trading Strategy
- PPO Sensitivitas Harga Momentum Strategi Perdagangan Berarah Double Bottom