Strategi Perdagangan Pembalikan Channel Breakout

Ringkasan
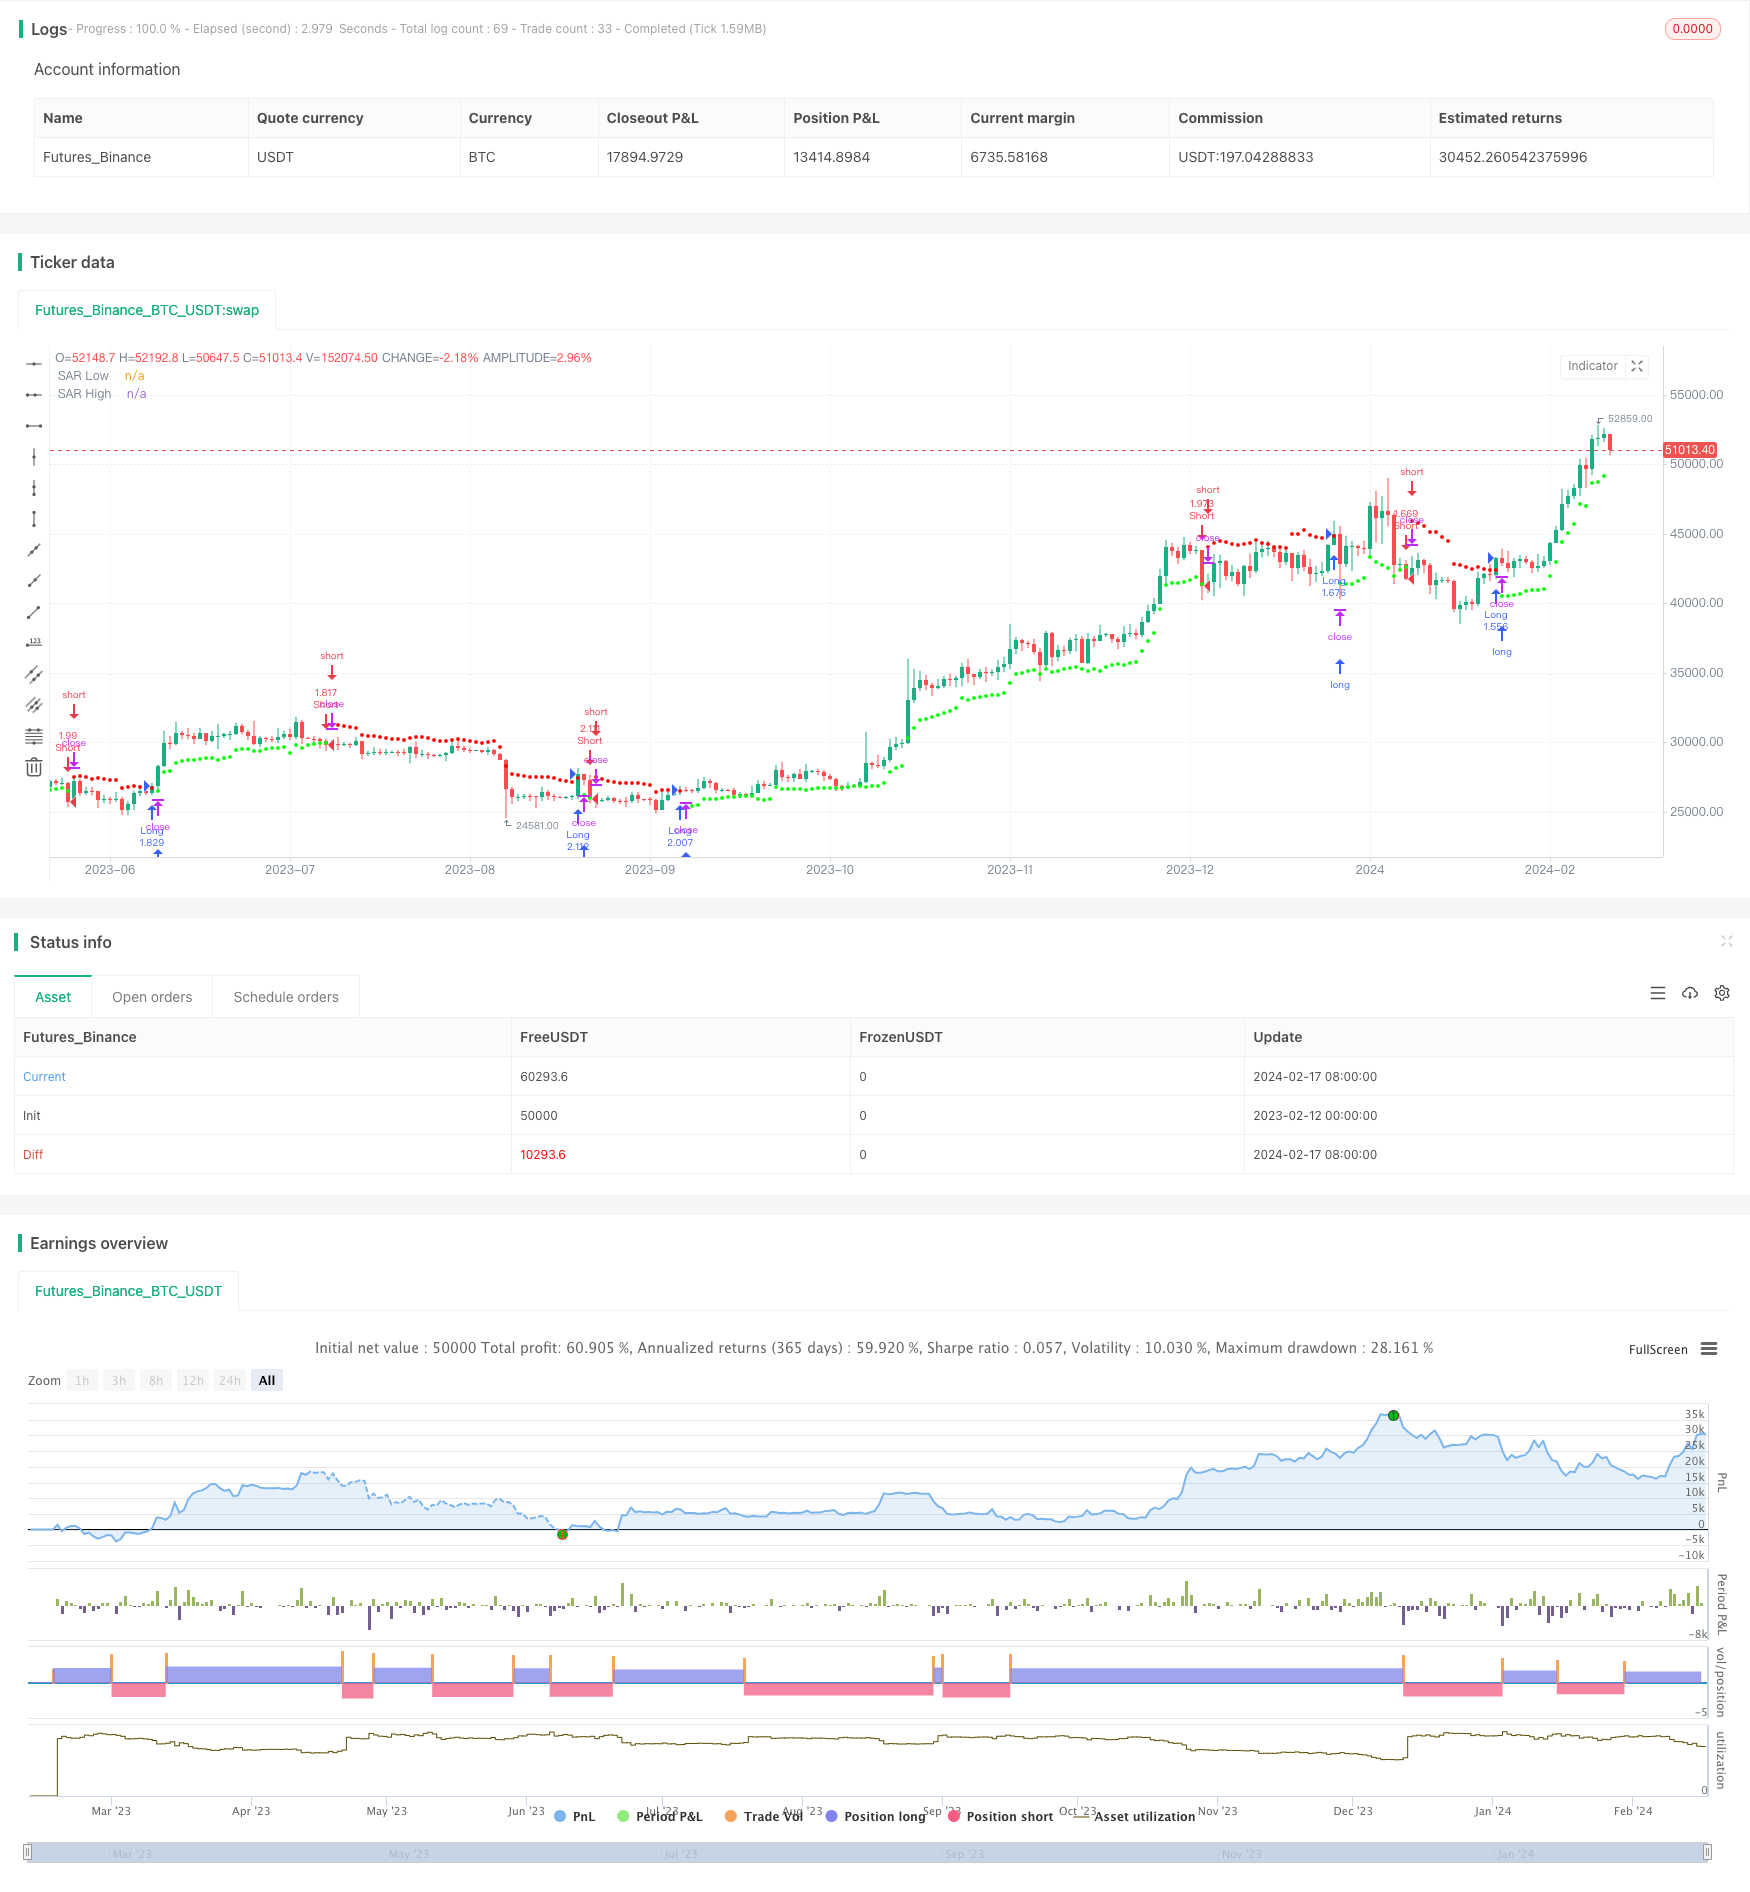
Strategi perdagangan berbalik saluran adalah strategi perdagangan berbalik yang melacak titik berhenti bergerak dari saluran harga. Ini menggunakan metode rata-rata bergerak berbobot untuk menghitung saluran harga dan membangun posisi overhead atau kosong ketika harga melewati saluran.
Prinsip Strategi
Strategi ini pertama-tama menggunakan indikator Wilder Average True Range (ATR) untuk menghitung volatilitas harga. Kemudian, berdasarkan nilai ATR, menghitung konstanta rentang rata-rata (ARC). ARC adalah setengah dari lebar saluran harga.
Secara khusus, pertama-tama menghitung ATR dari garis N-root K yang paling dekat. Kemudian kalikan ATR dengan faktor untuk mendapatkan ARC. Kalikan ARC dengan faktor yang dapat mengontrol lebar saluran.
Keunggulan Strategis
- Adaptive channel digunakan untuk menghitung volatilitas harga dan melacak perubahan pasar.
- Perdagangan reverse, cocok untuk pasar reverse
- Stop Loss Mobile, yang dapat mengunci keuntungan dan mengendalikan risiko
Risiko Strategis
- Perdagangan berbalik mudah ditiru, parameter perlu disesuaikan
- Peluang untuk menutup posisi di pasar yang sangat bergejolak
- Parameter yang salah menyebabkan terlalu banyak transaksi
Solusi:
- Optimalkan siklus ATR dan faktor ARC untuk membuat lebar saluran masuk akal
- Filter Indikator Trending Bersama Waktu
- Meningkatkan siklus ATR, mengurangi frekuensi transaksi
Arah optimasi strategi
- Optimalkan siklus ATR dan faktor ARC
- Meningkatkan kondisi untuk membuka posisi, misalnya dengan indikator MACD
- Meningkatkan strategi stop loss
Meringkaskan
Strategi perdagangan reversal terobosan saluran menggunakan saluran untuk melacak perubahan harga, membangun posisi reversal ketika fluktuasi meningkat, dan mengatur stop loss yang beradaptasi dengan stop loss bergerak. Strategi ini berlaku untuk pasar penutupan yang berbalik, dengan asumsi penilaian titik balik yang akurat, dapat memperoleh pengembalian investasi yang baik. Namun, perlu berhati-hati untuk mencegah stop loss terlalu longgar dan optimasi parameter.
/*backtest
start: 2023-02-12 00:00:00
end: 2024-02-18 00:00:00
period: 1d
basePeriod: 1h
exchanges: [{"eid":"Futures_Binance","currency":"BTC_USDT"}]
*/

//@version=3
//@author=LucF

// Volatility System [LucF]
// v1.0, 2019.04.14

// The Volatility System was created by Welles Wilder.
// It first appeared in his seminal masterpiece "New Concepts in Technical Trading Systems" (1978).
// He describes it on pp.23-26, in the chapter discussing the first presentation ever of the "Volatility Index",
// which later became known as ATR.
// Performance of the strategy usually increases with the time frame.
// Tuning of ATR length and, especially, the ARC factor, is key.

// This code runs as a strategy, which cannot generate alerts.
// If you want to use the alerts it must be converted to an indicator.
// To do so:
//      1. Swap the following 2 lines by commenting the first and uncommenting the second.
//      2. Comment out the last 4 lines containing the strategy() calls.
//      3. Save.
strategy(title="Volatility System by Wilder [LucF]", shorttitle="Volatility System [Strat]", overlay=true, precision=8, pyramiding=0, initial_capital=100000, default_qty_type=strategy.percent_of_equity, default_qty_value=100, commission_type=strategy.commission.percent, commission_value=0.1)
// study("Volatility System by Wilder [LucF]", shorttitle="Volatility System", precision=8, overlay=true)

// -------------- Colors
MyGreenRaw = color(#00FF00,0),      MyGreenMedium = color(#00FF00,50),  MyGreenDark = color(#00FF00,75),    MyGreenDarkDark = color(#00FF00,92)
MyRedRaw = color(#FF0000,0),        MyRedMedium = color(#FF0000,30),    MyRedDark = color(#FF0000,75),      MyRedDarkDark = color(#FF0000,90)

// -------------- Inputs
LongsOnly = input(false,"Longs only")
ShortsOnly = input(false,"Shorts only")
AtrLength = input(9, "ATR length", minval=2)
ArcFactor = input(1.8, "ARC factor", minval=0, type=float,step=0.1)
ShowSAR = input(false, "Show all SARs (Stop & Reverse)")
HideSAR = input(false, "Hide all SARs")
ShowTriggers = input(false, "Show Entry/Exit triggers")
ShowTradedBackground = input(false, "Show Traded Background")

FromYear  = input(defval = 2000,    title = "From Year", minval = 1900)
FromMonth = input(defval = 1,      title = "From Month", minval = 1, maxval = 12)
FromDay   = input(defval = 1,       title = "From Day", minval = 1, maxval = 31)
ToYear    = input(defval = 9999,    title = "To Year", minval = 1900)
ToMonth   = input(defval = 1,       title = "To Month", minval = 1, maxval = 12)
ToDay     = input(defval = 1,       title = "To Day", minval = 1, maxval = 31)

// -------------- Date range filtering
FromDate = timestamp(FromYear, FromMonth, FromDay, 00, 00)
ToDate = timestamp(ToYear, ToMonth, ToDay, 23, 59)
TradeDateIsAllowed() => true

// -------------- Calculate Stop & Reverse (SAR) points using Average Range Constant (ARC)
Arc   = atr(AtrLength)*ArcFactor
SarLo = highest(close, AtrLength)-Arc
SarHi = lowest(close, AtrLength)+Arc

// -------------- Entries/Exits
InLong = false
InShort = false
EnterLong = TradeDateIsAllowed() and not InLong[1] and crossover(close, SarHi[1])
EnterShort = TradeDateIsAllowed() and not InShort[1] and crossunder(close, SarLo[1])
InLong := (InLong[1] and not EnterShort[1]) or (EnterLong[1] and not ShortsOnly)
InShort := (InShort[1] and not EnterLong[1]) or (EnterShort[1] and not LongsOnly)

// -------------- Plots
// SAR points
plot( not HideSAR and ((InShort or EnterLong) or ShowSAR)? SarHi:na, color=MyRedMedium, style=circles, linewidth=2, title="SAR High")
plot( not HideSAR and ((InLong or EnterShort) or ShowSAR)? SarLo:na, color=MyGreenMedium, style=circles, linewidth=2, title="SAR Low")
// Entry/Exit markers
plotshape( ShowTriggers and not ShortsOnly and EnterLong, style=shape.triangleup, location=location.belowbar, color=MyGreenRaw, size=size.small, text="")
plotshape( ShowTriggers and not LongsOnly and EnterShort, style=shape.triangledown, location=location.abovebar, color=MyRedRaw, size=size.small, text="")
// Exits when printing only longs or shorts
plotshape( ShowTriggers and ShortsOnly and InShort[1] and EnterLong, style=shape.triangleup, location=location.belowbar, color=MyRedMedium, transp=70, size=size.small, text="")
plotshape( ShowTriggers and LongsOnly and InLong[1] and EnterShort, style=shape.triangledown, location=location.abovebar, color=MyGreenMedium, transp=70, size=size.small, text="")
// Background
bgcolor( color=ShowTradedBackground? InLong and not ShortsOnly?MyGreenDarkDark: InShort and not LongsOnly? MyRedDarkDark:na:na)

// ---------- Alerts
alertcondition( EnterLong or EnterShort, title="1. Reverse", message="Reverse")
alertcondition( EnterLong, title="2. Long", message="Long")
alertcondition( EnterShort, title="3. Short", message="Short")

// ---------- Strategy reversals
strategy.entry("Long", strategy.long, when=EnterLong and not ShortsOnly)
strategy.entry("Short", strategy.short, when=EnterShort  and not LongsOnly)
strategy.close("Short", when=EnterLong and ShortsOnly)
strategy.close("Long", when=EnterShort and LongsOnly)