概述
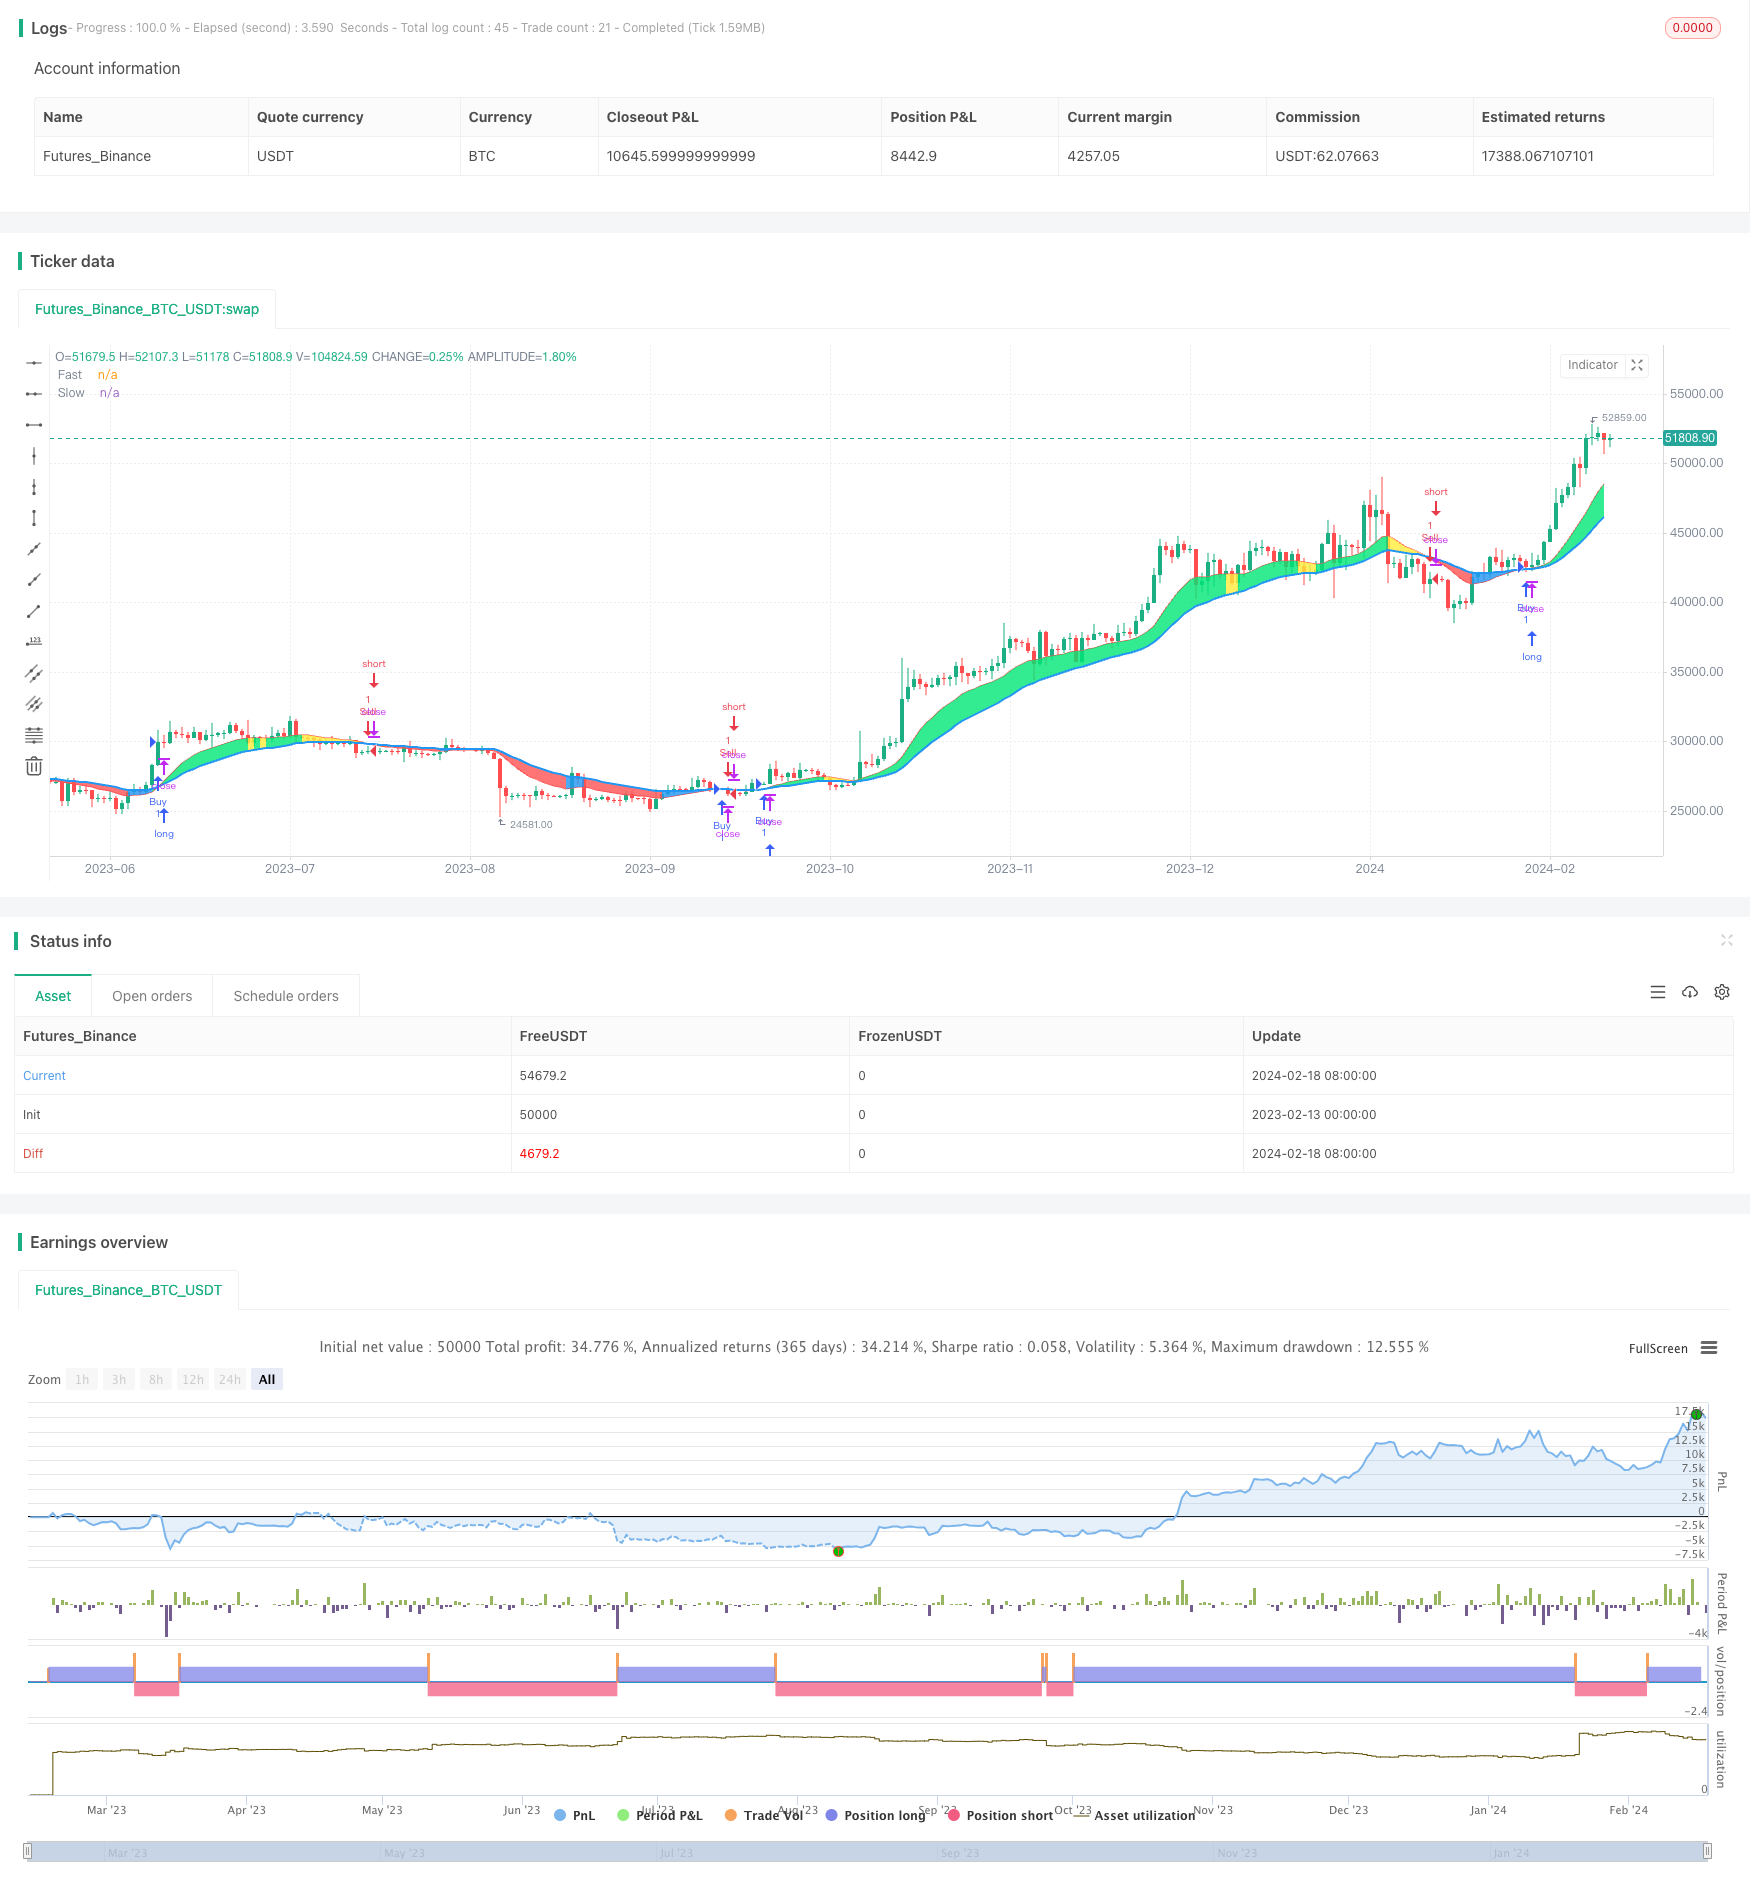
CDC动作区域[TS交易者]策略是基于CDC动作区域指标改编而成的一个量化交易策略。该策略利用快速移动平均线和慢速移动平均线的交叉作为买入和卖出信号。当快速移动平均线上穿慢速移动平均线时为买入信号,当快速移动平均线下穿慢速移动平均线时为卖出信号。
策略原理
该策略的核心指标是快速移动平均线和慢速移动平均线。策略首先计算价格的算术平均价,然后根据用户设定的周期长度,计算出快速移动平均线和慢速移动平均线。当快速移动平均线上穿慢速移动平均线时,被视为牛市信号;当快速移动平均线下穿慢速移动平均线时,被视为熊市信号。
在确定市场趋势后,策略进一步判断当前收盘价与移动平均线的关系。如果是牛市,并且收盘价高于快速移动平均线,则为强势买入信号;如果是熊市,并且收盘价低于快速移动平均线,则为强势卖出信号。
根据这些买入和卖出信号,策略可以进行自动化交易。当触发买入信号时,进行长仓开仓;当触发卖出信号时,平仓长仓或开仓做空。
优势分析
该策略具有以下优势:
- 使用移动平均线作为基础指标,理论基础稳固,易于理解;
- 结合两个移动平均线,可以有效过滤市场噪音,识别市场趋势;
- 结合收盘价与移动平均线的关系,可以确定较强的买入卖出时机;
- 策略逻辑简单清晰,容易实现自动化交易;
- 可根据市场调整移动平均线周期,适应不同行情。
风险分析
该策略也存在一些风险:
- 移动平均线存在滞后性,可能错过短线机会;
- 趋势反转时,可能带来较大亏损;
- 回测数据与实盘存在差异,实盘效果可能有所下降。
针对这些风险,可以通过组合其他指标确定入场时机,或适当缩短移动平均线周期来减少滞后性等方法来优化。
优化方向
该策略可以从以下几个方面进行优化:
- 优化移动平均线周期,适应市场变化;
- 增加成交量等指标过滤假突破;
- 结合其他指标识别趋势反转;
- 添加止损策略控制亏损。
总结
总的来说,CDC动作区域[TS交易者]策略利用双移动平均线交叉实现了一个较为简单实用的量化交易策略。该策略有着易于理解、实施的优点,同时也存在一些可优化的空间。通过不断测试和优化,该策略可以成为一个值得长期持有的稳定策略。
策略源码
/*backtest
start: 2023-02-13 00:00:00
end: 2024-02-19 00:00:00
period: 1d
basePeriod: 1h
exchanges: [{"eid":"Futures_Binance","currency":"BTC_USDT"}]
*/

//@version=4
strategy("CDC Action Zone [TS Trader]", overlay=true)

// CDC ActionZone V2 29 Sep 2016
// CDC ActionZone is based on a simple 2MA and is most suitable for use with medium volatility market
// 11 Nov 2016 : Ported to Trading View with minor UI enhancement

src = input(title="Data Array", type=input.source, defval=ohlc4)
prd1 = input(title="Short MA period", type=input.integer, defval=12)
prd2 = input(title="Long MA period", type=input.integer, defval=26)

AP = ema(src, 2)
Fast = ema(AP, prd1)
Slow = ema(AP, prd2)

// === INPUT BACKTEST RANGE ===
FromYear = input(defval = 2019, title = "From Year", minval = 2009)
FromMonth = input(defval = 1, title = "From Month", minval = 1, maxval = 12)
FromDay = input(defval = 1, title = "From Day", minval = 1, maxval = 31)
ToYear = input(defval = 9999, title = "To Year", minval = 2009)
ToMonth = input(defval = 12, title = "To Month", minval = 1, maxval = 12)
ToDay = input(defval = 31, title = "To Day", minval = 1, maxval = 31)

// === FUNCTION EXAMPLE ===
start = timestamp(FromYear, FromMonth, FromDay, 00, 00)  // backtest start window
finish = timestamp(ToYear, ToMonth, ToDay, 23, 59)        // backtest finish window
window() => true
Bullish = Fast > Slow
Bearish = Fast < Slow

Green = Bullish and AP > Fast
Red = Bearish and AP < Fast
Yellow = Bullish and AP < Fast
Blue = Bearish and AP > Fast

//Long Signal
Buy = Green and Green[1] == 0
Sell = Red and Red[1] == 0

//Short Signal
Short = Red and Red[1] == 0
Cover = Red[1] and Red == 0

//Plot
l1 = plot(Fast, "Fast", linewidth=1, color=color.red)
l2 = plot(Slow, "Slow", linewidth=2, color=color.blue)
bcolor = Green ? color.lime : Red ? color.red : Yellow ? color.yellow : Blue ? color.blue : color.white
barcolor(color=bcolor)
fill(l1, l2, bcolor)

strategy.entry("Buy", strategy.long, when=window() and Buy)
strategy.entry("Sell", strategy.short, when=window() and Sell)
strategy.close("Buy", when=window() and Sell)
strategy.close("Sell", when=window() and Buy)