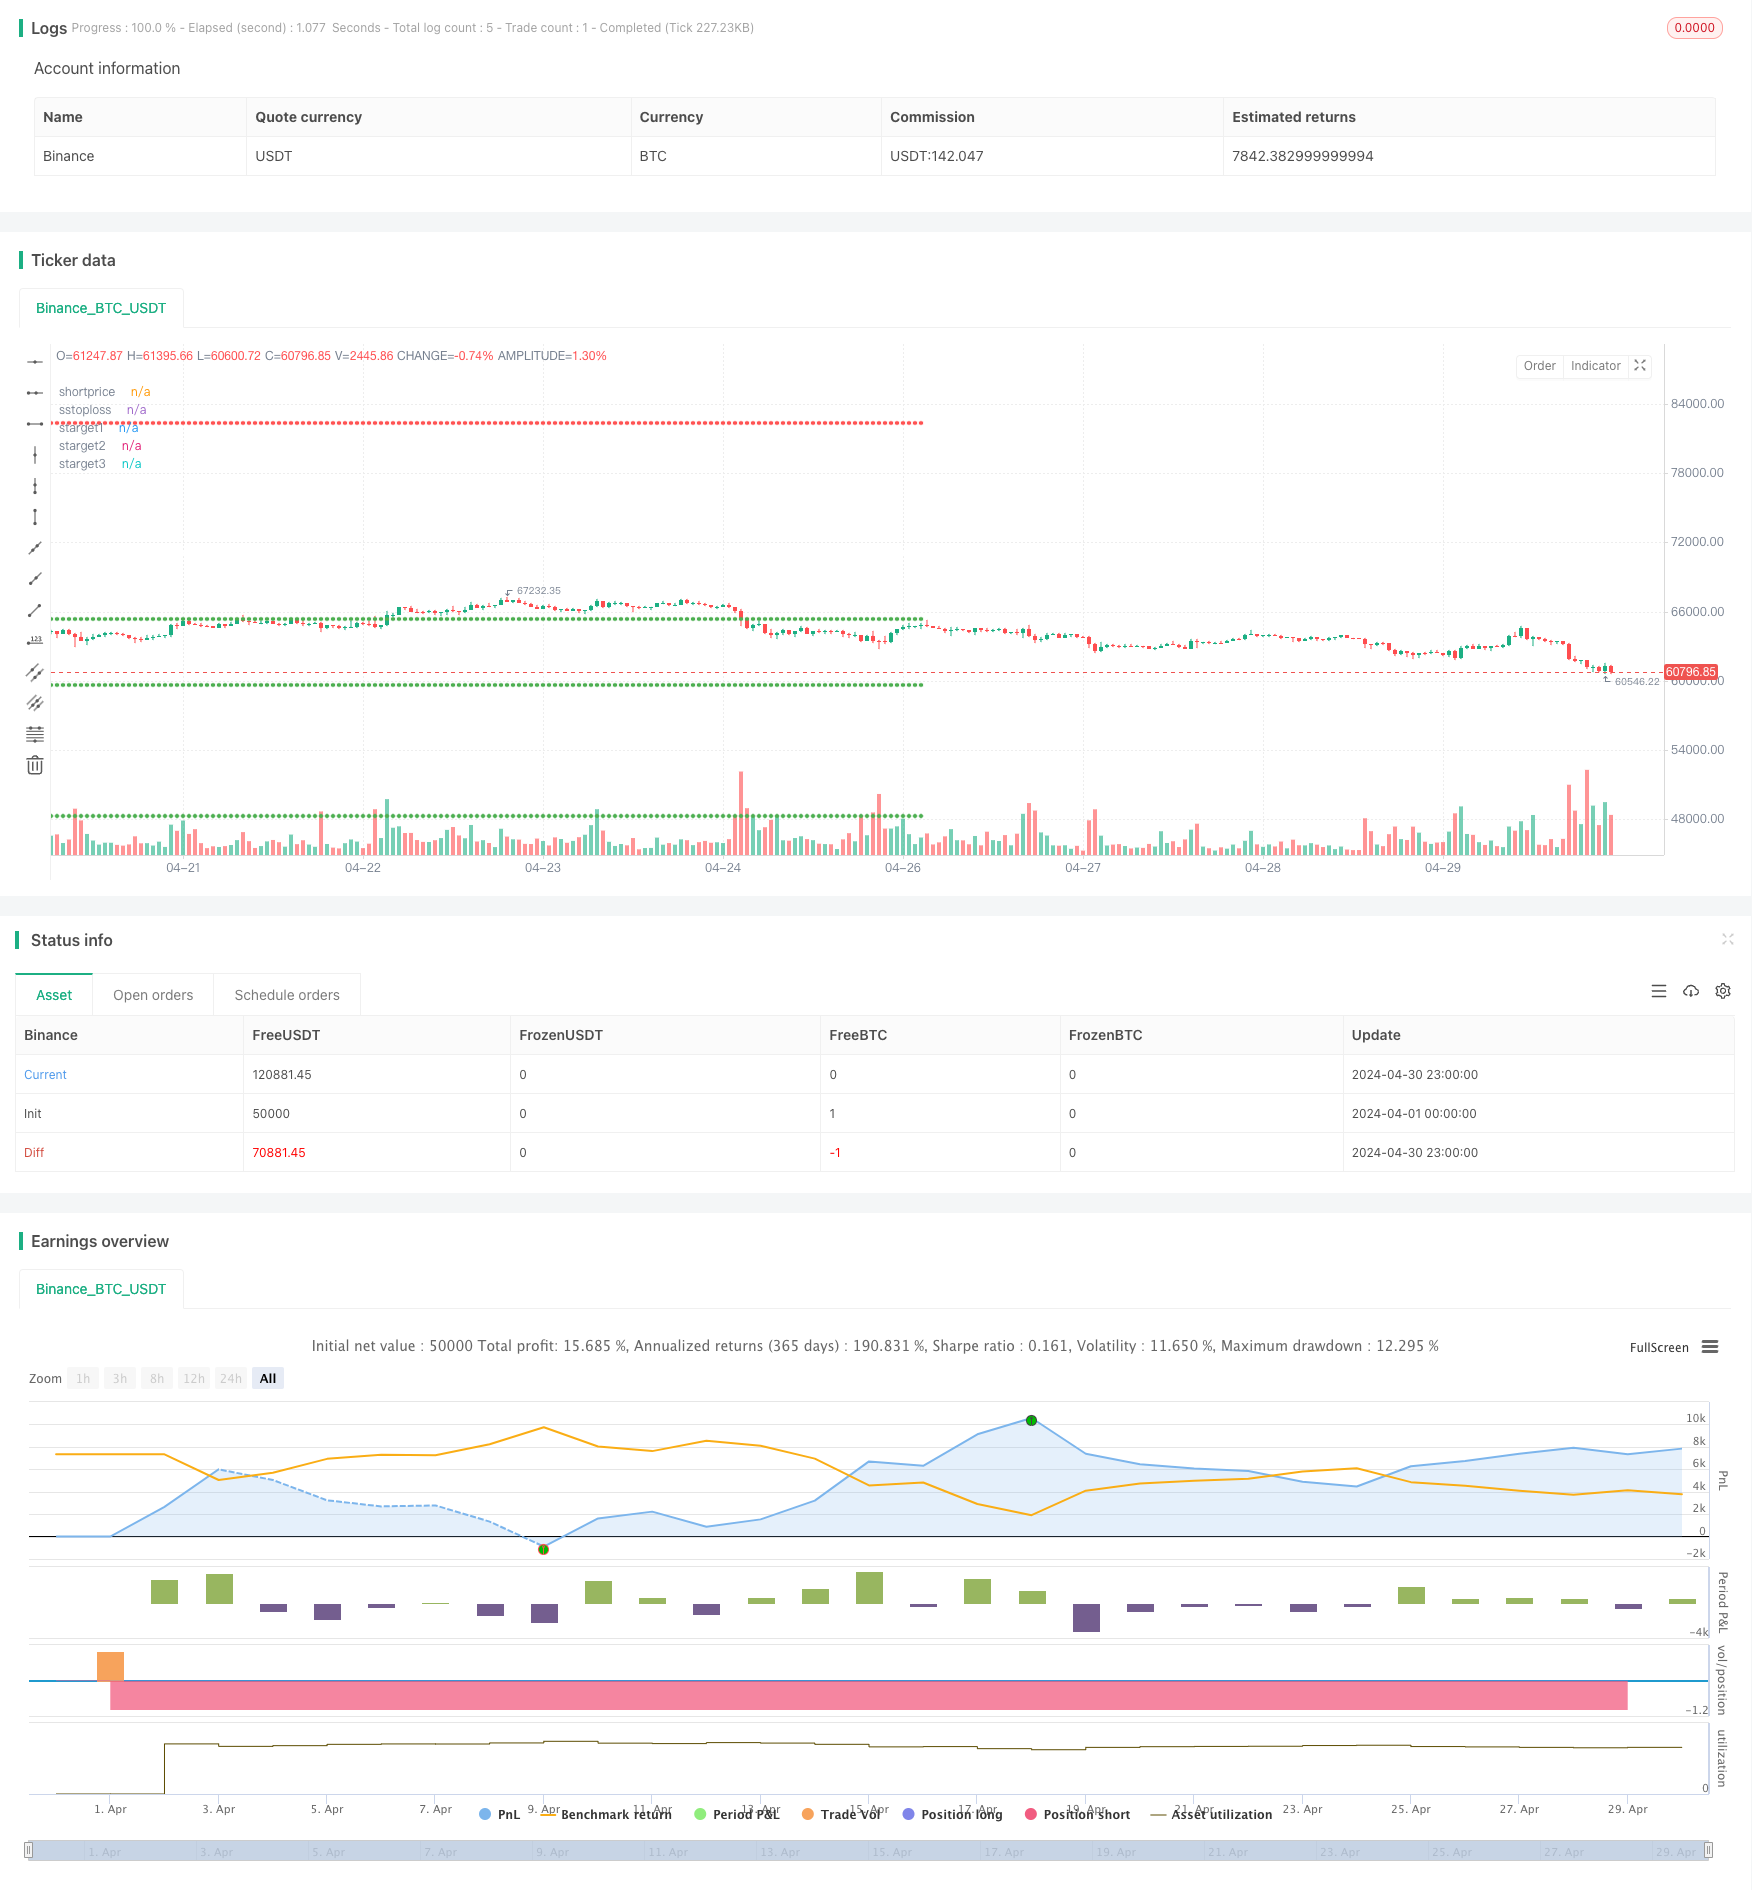
Ringkasan
Strategi kuantitatif ini terutama menggunakan sinyal silang dari indikator SAR parallax ((PSAR) dan rata-rata bergerak indeks ((EMA), yang dikombinasikan dengan beberapa kondisi khusus, untuk menghasilkan sinyal beli dan jual. Gagasan utama strategi ini adalah: ketika PSAR dari bawah menerobos EMA dan memenuhi kondisi tertentu menghasilkan sinyal beli; ketika PSAR dari atas menembus EMA dan memenuhi kondisi tertentu menghasilkan sinyal jual.
Prinsip Strategi
- Perhitungan indikator PSAR dan 30-siklus EMA
- Menilai hubungan silang antara PSAR dan EMA, dan menetapkan titik tanda yang sesuai
- Menggabungkan hubungan posisi PSAR dengan EMA, warna garis K dan lain-lain, untuk menentukan IGC (Ideal Green Candle) dan IRC (Ideal Red Candle)
- Munculnya IGC dan IRC untuk menilai sinyal beli dan jual
- Tetapkan stop stop dan stop loss, stop stop 8% dari harga beli, 16% dan 32% dari harga beli, stop loss 16% dari harga jual, stop loss 16% dari harga jual
- Melakukan pembelian, penjualan, atau posisi kosong berdasarkan waktu transaksi dan status kepemilikan
Keunggulan Strategis
- Kombinasi berbagai indikator dan kondisi meningkatkan keandalan sinyal
- Berbagai stop loss dan stop loss yang dapat digunakan untuk mengontrol risiko dan keuntungan secara fleksibel
- Adaptasi strategi yang ditingkatkan dengan mengatur kondisi filter untuk membeli dan menjual untuk kondisi pasar yang berbeda
- Kode modular yang mudah dipahami dan dimodifikasi
Risiko Strategis
- Pengaturan parameter strategi mungkin tidak cocok untuk semua situasi pasar dan perlu disesuaikan dengan situasi aktual
- Dalam pasar yang bergoyang, strategi ini dapat menyebabkan sinyal perdagangan yang sering terjadi, yang menyebabkan peningkatan biaya transaksi.
- Strategi ini kurang menilai tren pasar dan mungkin kehilangan peluang di pasar yang sedang tren
- Pengaturan stop loss mungkin tidak dapat sepenuhnya menghindari risiko yang ditimbulkan oleh situasi ekstrem
Arah optimasi strategi
- Memperkenalkan lebih banyak indikator teknis atau indikator sentimen pasar untuk meningkatkan akurasi dan keandalan sinyal
- Optimalkan pengaturan stop dan stop loss, pertimbangkan untuk memperkenalkan stop loss yang dinamis atau stop loss yang berbasis volatilitas
- Adaptasi strategi untuk kondisi pasar yang berbeda, pengaturan parameter dan aturan perdagangan yang berbeda
- Menambahkan modul pengelolaan dana, mengadaptasi posisi dan eksposur risiko secara dinamis berdasarkan faktor seperti saldo rasio ekuitas akun
Meringkaskan
Strategi kuantitatif ini didasarkan pada indikator PSAR dan EMA, menghasilkan sinyal beli dan jual melalui beberapa kondisi dan aturan yang dapat disesuaikan. Strategi ini memiliki beberapa fleksibilitas dan fleksibilitas, dan juga menetapkan stop loss untuk mengendalikan risiko. Namun, ada ruang untuk pengoptimalan dalam pengaturan parameter strategi dan pengendalian risiko. Secara keseluruhan, strategi ini dapat digunakan sebagai model dasar dan, dengan pengoptimalan dan perbaikan lebih lanjut, diharapkan menjadi strategi perdagangan yang solid.
/*backtest
start: 2024-04-01 00:00:00
end: 2024-04-30 23:59:59
period: 1h
basePeriod: 15m
exchanges: [{"eid":"Binance","currency":"BTC_USDT"}]
*/

// This Pine Script™ code is subject to the terms of the Mozilla Public License 2.0 at https://mozilla.org/MPL/2.0/
// © SwapnilRaykar

//@version=5
strategy("aj sir second project", overlay=true, margin_long=100, margin_short=100)

start=input("0915-1515","session time")
st11=time(timeframe.period,start)
st=st11>0
et= not st

psar=ta.sar(0.02,0.02,0.2)
emared=ta.ema(close,30)
//plot(psar,"psar",color.yellow,style = plot.style_cross)
//plot(emared,"emared",color.red)
var crodownflag=0
var croupflag=0

var igcflag=0

var ircflag=0

cdown1=ta.crossunder(psar,emared)  and not (psar<close and psar[1]>close[1])
cup1=ta.crossover(psar,emared) and not (psar>close and psar[1]<close[1])

cdown=ta.crossunder(psar,emared)
cup=ta.crossover(psar,emared)


green_candle=close>open
red_candle=close<open

if ta.crossunder(psar,emared) and crodownflag==0  and not (psar<close and psar[1]>close[1])
    crodownflag:=1
else if cdown and crodownflag==1
    crodownflag:=0


if crodownflag==1 and green_candle and igcflag==0
    igcflag:=1
else if cdown and igcflag==1
    igcflag:=0

//plot(igcflag,"igcflag",color.lime)

if ta.crossover(psar,emared) and croupflag==0 and not (psar>close and psar[1]<close[1])
    croupflag:=1
else if cdown and croupflag==1
    croupflag:=0

//plot(crodownflag,"crodownflag",color.white)
irc_cond=croupflag==1 or cup

if (croupflag==1 and red_candle and ircflag==0)
    ircflag:=1
else if cup and croupflag==1
    ircflag:=0

igc_candle1=(igcflag==1 and igcflag[1]==0) or (cdown1 and green_candle)
irc_candle1=(ircflag==1 and ircflag[1]==0) or (cup1 and red_candle)
///////////////////////////
dm=dayofmonth(time)
newday=dm!=dm[1]
dmc=dm==ta.valuewhen(bar_index==last_bar_index,dm,0)

///////////////////////////////////////////
var irc_there=0

if irc_candle1[1] and irc_there==0
    irc_there:=1
else if cdown and irc_there==1
    irc_there:=0

irc_candle=irc_candle1 and irc_there==0// and dmc

var igc_there=0

if igc_candle1[1] and igc_there==0
    igc_there:=1
else if cup and igc_there ==1
    igc_there:=0

igc_candle=igc_candle1 and igc_there==0// and dmc
/////////// to get rid of irc being valid even after crossdown
var valid_igc_low=0
var valid_irc_high=0

if irc_candle[1] and valid_irc_high==0
    valid_irc_high:=1
else if igc_candle and valid_irc_high==1
    valid_irc_high:=0

if igc_candle and valid_igc_low==0
    valid_igc_low:=1
else if irc_candle and valid_igc_low==1
    valid_igc_low:=0


igc_low=ta.valuewhen(igc_candle,low,0)
irc_high=ta.valuewhen(irc_candle,high,0)
//////////////////////////////
//plot(irc_high,"irc_high",color.red)

//plot(valid_irc_high,"valid_irc_high",color.purple)

buy12=ta.crossunder(close,igc_low) and valid_igc_low==1
buy1=buy12[1]

short12=ta.crossover(close,irc_high) and valid_irc_high==1
short1=short12[1]
//plotshape(short12,"short12",shape.arrowdown,color=color.purple)

// plotshape(igc_candle,"igc_candle",shape.arrowdown,color=color.green)
// plotshape(irc_candle,"irc_candle",shape.arrowdown,color=color.red)
//plotshape((psar<close and psar[1]>close[1]) ,"croup",shape.arrowdown,color=color.red)
//plotshape(cup ,"croup",shape.arrowdown,color=color.orange)

buyprice=ta.valuewhen(buy1 and strategy.position_size[1]==0,open,0)
shortprice=ta.valuewhen(short1 and strategy.position_size[1]==0,open,0)

btarget1=buyprice+(buyprice*0.08)
btarget2=buyprice+(buyprice*0.16)
btarget3=buyprice+(buyprice*0.32)
bstoploss=buyprice-(buyprice*0.16)

starget1=shortprice-(shortprice*0.08)
starget2=shortprice-(shortprice*0.16)
starget3=shortprice-(shortprice*0.32)
sstoploss=shortprice+(shortprice*0.16)

if buy12 and strategy.position_size==0 and st11
    strategy.entry("buy",strategy.long)

if strategy.position_size >0
    strategy.exit("sell",from_entry = "buy",stop=bstoploss,limit=btarget3)

if short12 and strategy.position_size==0 and st11
    strategy.entry("short",strategy.short)

if strategy.position_size<0
    strategy.exit("cover",from_entry = "short",stop = sstoploss,limit = starget3)

if et
    strategy.close_all(comment = "timeover")

plot(strategy.position_size>0?buyprice:na,"buyprice",color.white, style=plot.style_circles )
plot(strategy.position_size>0?bstoploss:na,"bstoploss",color.red, style=plot.style_circles )
plot(strategy.position_size>0?btarget1:na,"btarget1",color.green, style=plot.style_circles )
plot(strategy.position_size>0?btarget2:na,"btarget2",color.green, style=plot.style_circles )
plot(strategy.position_size>0?btarget3:na,"btarget3",color.green, style=plot.style_circles )

plot(strategy.position_size<0?shortprice:na,"shortprice",color.white, style=plot.style_circles )
plot(strategy.position_size<0?sstoploss:na,"sstoploss",color.red, style=plot.style_circles )
plot(strategy.position_size<0?starget1:na,"starget1",color.green, style=plot.style_circles )
plot(strategy.position_size<0?starget2:na,"starget2",color.green, style=plot.style_circles )
plot(strategy.position_size<0?starget3:na,"starget3",color.green, style=plot.style_circles )