Ringkasan
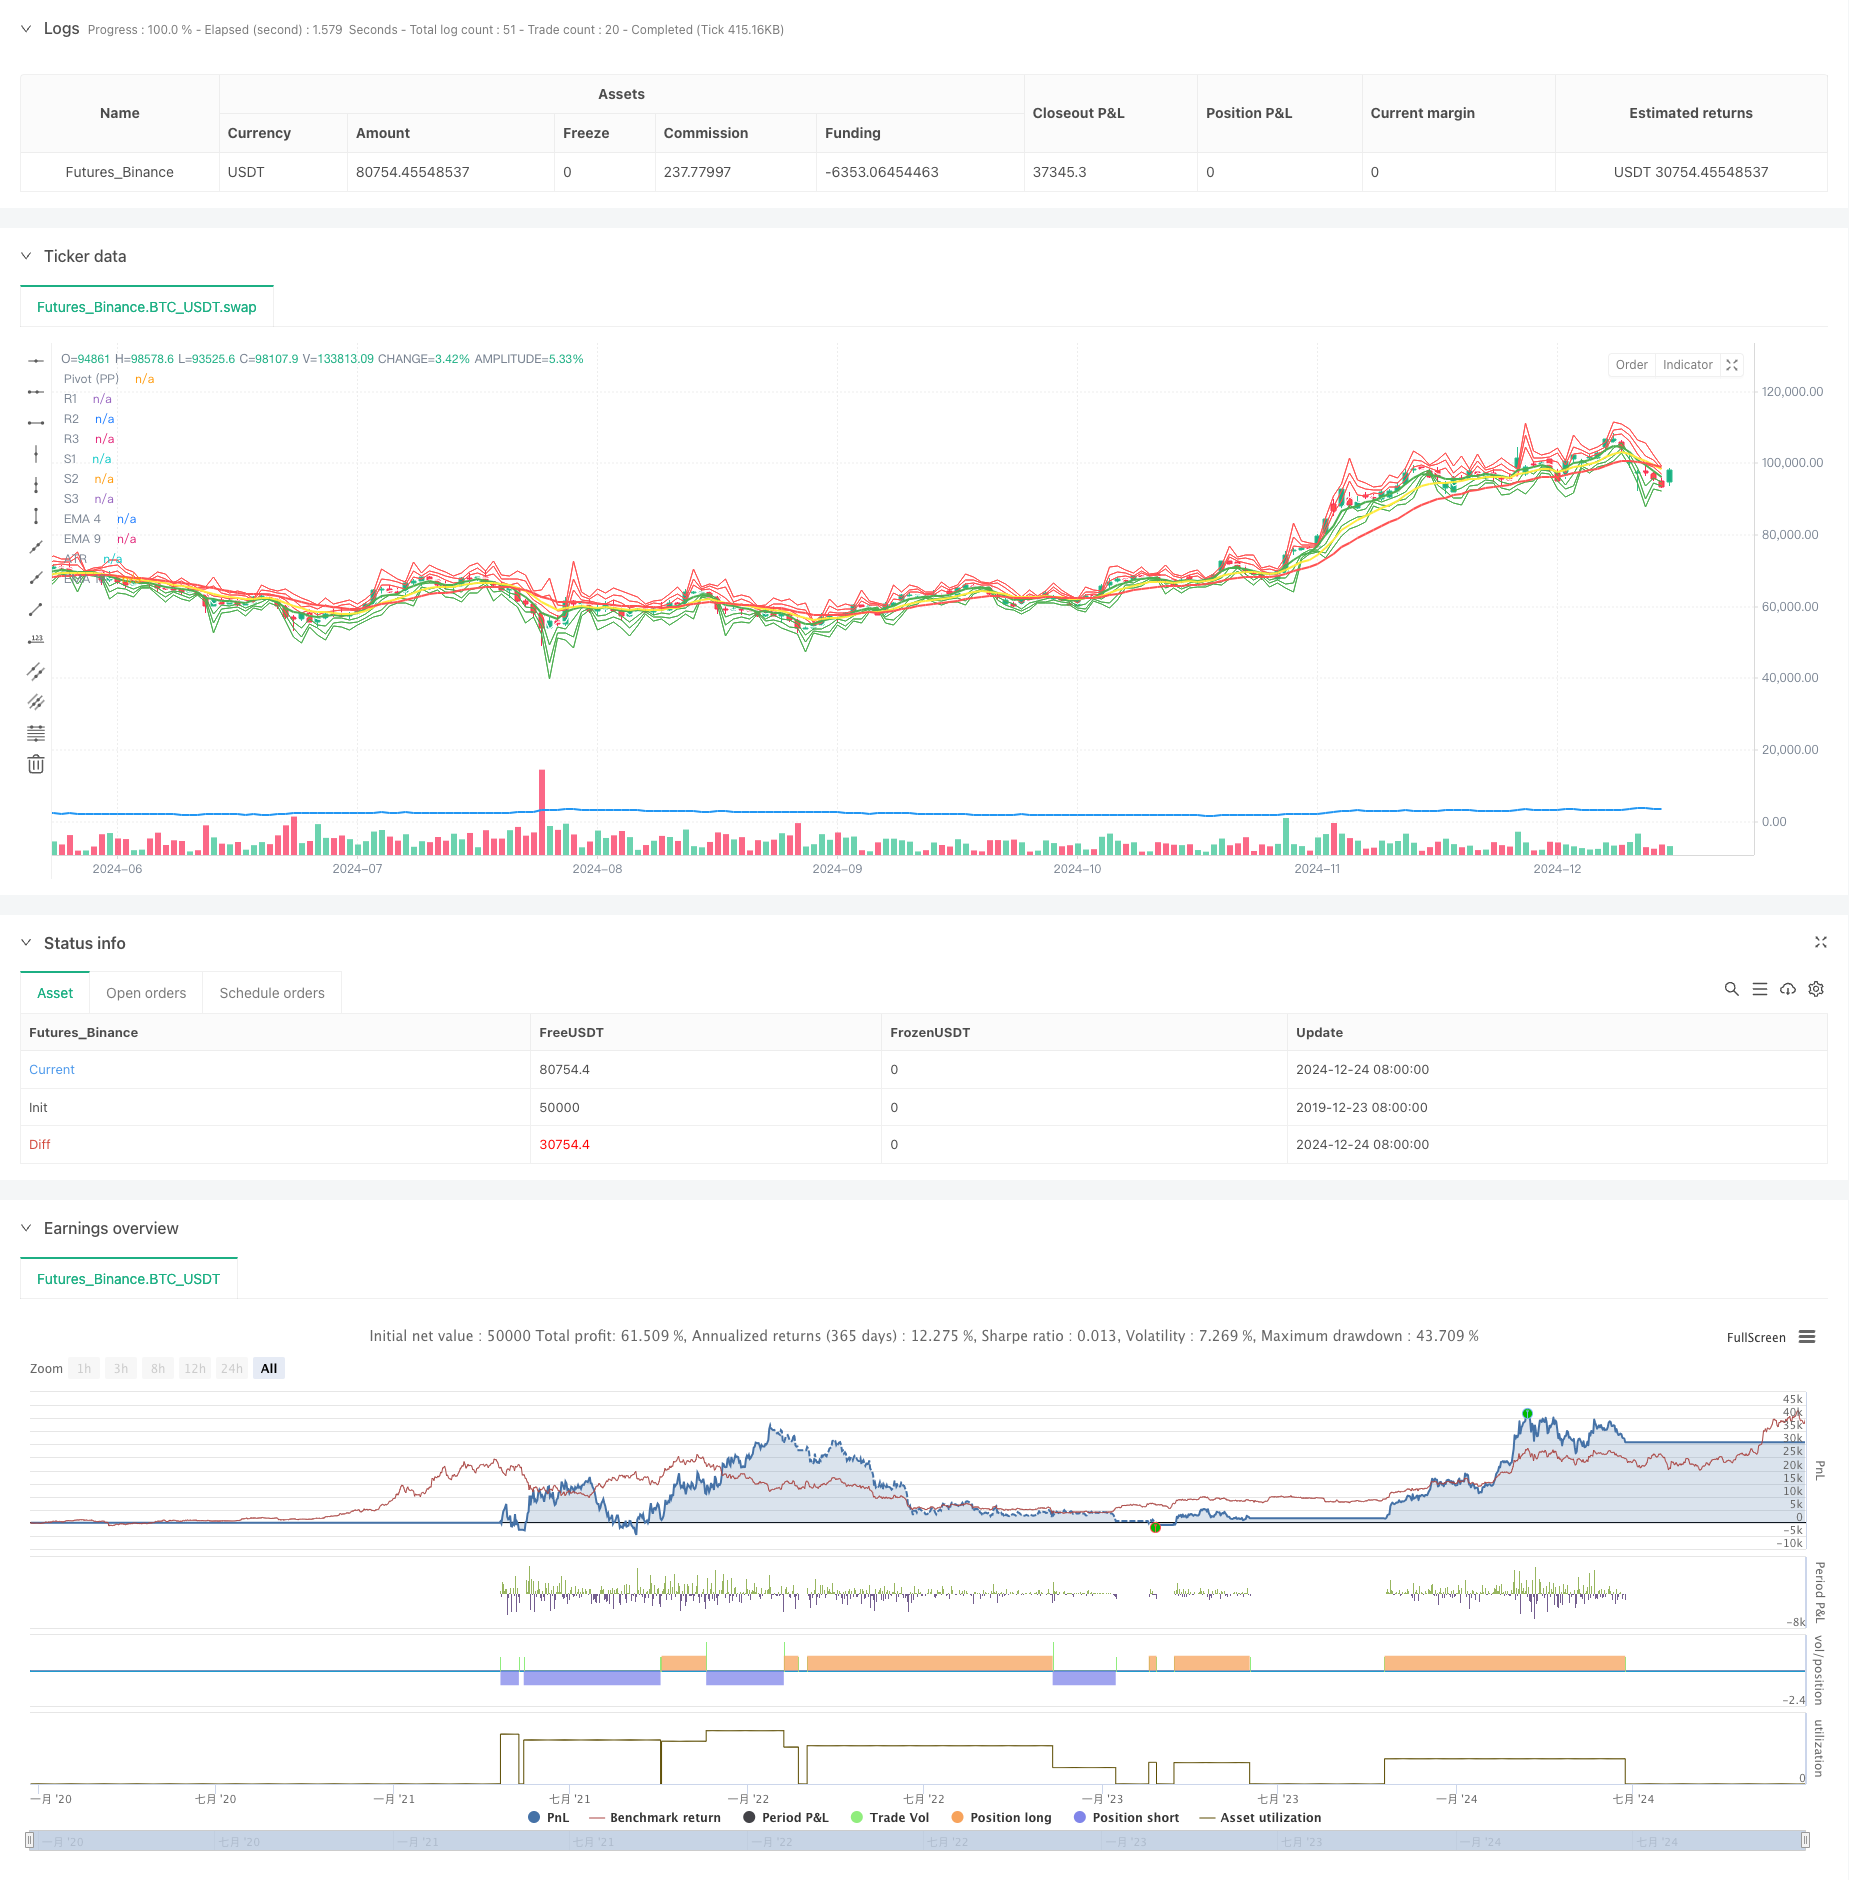
Strategi ini adalah sistem perdagangan komprehensif yang menggabungkan crossover moving average (EMA) multi-indeks, amplitudo real-time (ATR) dan resistance supporting pivot point (Pivot Points). Strategi ini menggunakan sinyal crossover EMA jangka pendek dengan EMA jangka menengah dan panjang, yang menggabungkan area ATR dan tingkat harga kunci untuk menangkap titik-titik pergeseran tren pasar, untuk menangkap waktu perdagangan yang tepat.
Prinsip Strategi
Strategi ini didasarkan pada analisis teknis dalam tiga dimensi:
- Identifikasi tren: Menggunakan EMA tiga periode 4, 9 dan 18 untuk mengkonfirmasi arah tren melalui EMA jangka pendek (fase 4) ke EMA jangka menengah (fase 9) dan EMA jangka panjang (fase 18).
- Rentang fluktuasi: pengenalan indikator ATR 14 periode untuk mengukur volatilitas pasar dan menetapkan ambang batas perdagangan yang dinamis.
- Resistensi Dukungan Harga: Dengan sistem perhitungan titik pivot harian (PPSignal), 7 tingkat harga kunci (PP, R1-R3, S1-S3) didirikan, memberikan referensi untuk perdagangan.
Aturan transaksi jelas:
- Berbagai kondisi: EMA4 naik melewati EMA9 dan EMA18, dan harga penutupan menembus jarak ATR di atas EMA9
- Kondisi kosong: EMA4 ke bawah melewati EMA9 dan EMA18, dan harga penutupan menembus jarak ATR di bawah EMA9
- Pengaturan Stop Loss: Dinamis melacak tingkat EMA4
Keunggulan Strategis
- Analisis multi-dimensi: menggabungkan tiga dimensi tren, fluktuasi dan struktur harga untuk meningkatkan keandalan sinyal
- Adaptasi dinamis: Strategi dapat beradaptasi dengan berbagai kondisi pasar melalui ATR dan resistance level dukungan dinamis
- Pengendalian risiko yang sempurna: Menggunakan mekanisme stop loss yang dinamis, dapat mengunci keuntungan dan mengendalikan risiko secara tepat waktu
- Sinyal konfirmasi cukup: Memerlukan resonansi beberapa indikator teknis untuk memicu transaksi, mengurangi risiko terobosan palsu
Risiko Strategis
- Risiko pasar yang bergoyang: kemungkinan munculnya sinyal palsu yang sering terjadi pada tahap penyusunan lateral
- Risiko keterlambatan: Rata-rata pergerakan itu sendiri memiliki keterlambatan, dan Anda mungkin kehilangan waktu masuk terbaik.
- Gap Risk: Jumping di siang hari dapat menyebabkan stop loss tidak berfungsi
- Sensitivitas parameter: kombinasi parameter yang berbeda dapat menghasilkan efek yang berbeda secara signifikan
Arah optimasi strategi
- Masukkan indikator lalu lintas: Tambahkan verifikasi lalu lintas saat konfirmasi sinyal silang
- Optimasi parameter dinamis: menyesuaikan parameter siklus EMA sesuai dengan fluktuasi pasar
- Perbaikan mekanisme penghentian kerugian: dapat dipertimbangkan dengan kombinasi pengaturan ATR untuk penghentian kerugian yang mengambang
- Filter kondisi pasar: Tambahkan indikator intensitas tren untuk membuka perdagangan selama tren kuat
- Filter waktu: fitur untuk periode waktu yang berbeda, mengatur waktu perdagangan yang optimal
Meringkaskan
Strategi ini membangun sistem perdagangan yang lebih lengkap melalui kolaborasi kolaborasi dari beberapa indikator teknis. Keunggulan inti dari strategi ini adalah mekanisme pengakuan sinyal multi-dimensi dan sistem kontrol risiko yang baik, tetapi masih memerlukan pengoptimalan parameter dan perbaikan sistem oleh pedagang sesuai dengan situasi pasar tertentu. Dengan arah optimasi yang disarankan, stabilitas dan keandalan strategi diharapkan dapat ditingkatkan lebih lanjut.
/*backtest
start: 2019-12-23 08:00:00
end: 2024-12-25 08:00:00
period: 1d
basePeriod: 1d
exchanges: [{"eid":"Futures_Binance","currency":"BTC_USDT"}]
*/

//@version=5
strategy("EMA Crossover + ATR + PPSignal", overlay=true)

//--------------------------------------------------------------------
// 1. Cálculo de EMAs y ATR
//--------------------------------------------------------------------
ema4      = ta.ema(close, 4)
ema9      = ta.ema(close, 9)
ema18     = ta.ema(close, 18)
atrLength = 14
atr       = ta.atr(atrLength)

//--------------------------------------------------------------------
// 2. Cálculo de Pivot Points diarios (PPSignal)
//    Tomamos datos del día anterior (timeframe D) para calcularlos
//--------------------------------------------------------------------
dayHigh  = request.security(syminfo.tickerid, "D", high[1])
dayLow   = request.security(syminfo.tickerid, "D", low[1])
dayClose = request.security(syminfo.tickerid, "D", close[1])

// Fórmula Pivot Points estándar
pp = (dayHigh + dayLow + dayClose) / 3.0
r1 = 2.0 * pp - dayLow
s1 = 2.0 * pp - dayHigh
r2 = pp + (r1 - s1)
s2 = pp - (r1 - s1)
r3 = dayHigh + 2.0 * (pp - dayLow)
s3 = dayLow - 2.0 * (dayHigh - pp)

//--------------------------------------------------------------------
// 3. Definir colores para las EMAs
//--------------------------------------------------------------------
col4  = color.green   // EMA 4
col9  = color.yellow  // EMA 9
col18 = color.red     // EMA 18

//--------------------------------------------------------------------
// 4. Dibujar indicadores en el gráfico
//--------------------------------------------------------------------

// EMAs
plot(ema4,  title="EMA 4",  color=col4,  linewidth=2)
plot(ema9,  title="EMA 9",  color=col9,  linewidth=2)
plot(ema18, title="EMA 18", color=col18, linewidth=2)

// ATR
plot(atr, title="ATR", color=color.blue, linewidth=2)

// Pivot Points (PPSignal)
plot(pp, title="Pivot (PP)", color=color.new(color.white, 0),  style=plot.style_line, linewidth=1)
plot(r1, title="R1",        color=color.new(color.red,   0),  style=plot.style_line, linewidth=1)
plot(r2, title="R2",        color=color.new(color.red,   0),  style=plot.style_line, linewidth=1)
plot(r3, title="R3",        color=color.new(color.red,   0),  style=plot.style_line, linewidth=1)
plot(s1, title="S1",        color=color.new(color.green, 0),  style=plot.style_line, linewidth=1)
plot(s2, title="S2",        color=color.new(color.green, 0),  style=plot.style_line, linewidth=1)
plot(s3, title="S3",        color=color.new(color.green, 0),  style=plot.style_line, linewidth=1)

//--------------------------------------------------------------------
// 5. Condiciones de cruce (EMA4 vs EMA9 y EMA18) y estrategia
//--------------------------------------------------------------------
crossedAbove = ta.crossover(ema4, ema9) and ta.crossover(ema4, ema18)
crossedBelow = ta.crossunder(ema4, ema9) and ta.crossunder(ema4, ema18)

// Señales de Buy y Sell basadas en cruces + condición con ATR
if crossedAbove and close > ema9 + atr
    strategy.entry("Buy", strategy.long)
    strategy.exit("Sell", "Buy", stop=ema4)

if crossedBelow and close < ema9 - atr
    strategy.entry("Sell", strategy.short)
    strategy.exit("Cover", "Sell", stop=ema4)