Ringkasan
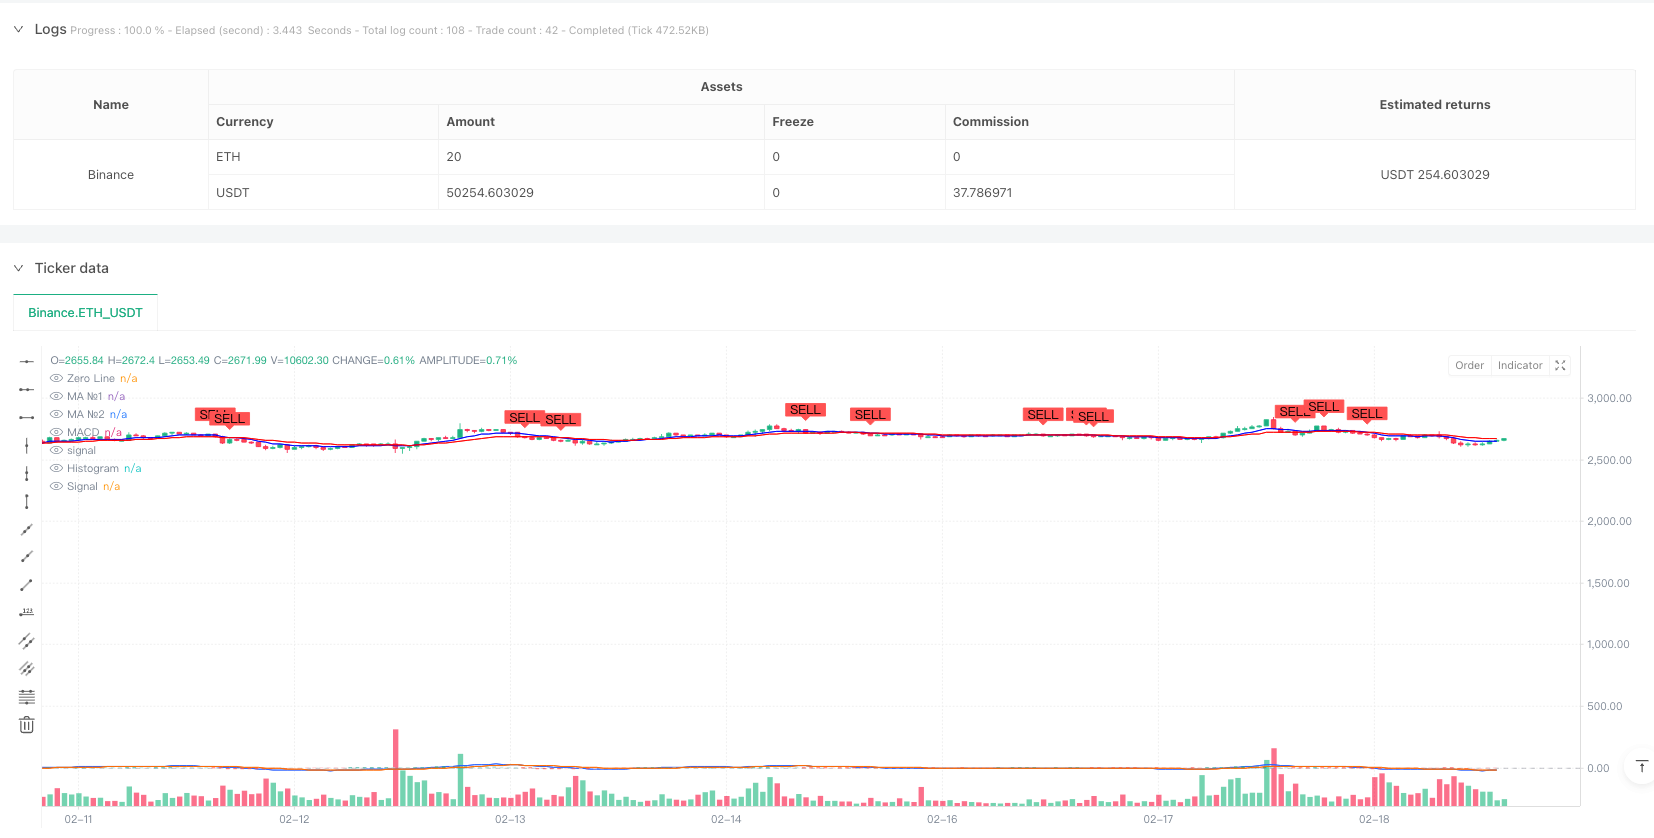
Strategi ini adalah sistem perdagangan yang menggabungkan pita rata-rata bergerak multi-periode dan indikator MACD. Strategi ini terutama digunakan untuk menentukan tren pasar dan waktu perdagangan melalui persilangan rata-rata bergerak jangka pendek dan jangka panjang dan sinyal dari indikator MACD. Strategi ini mengintegrasikan logika reset perdagangan intraday yang dapat secara efektif mencegah risiko semalam.
Prinsip Strategi
Logika inti dari strategi ini terdiri dari tiga bagian utama: sistem pita rata-rata bergerak, sistem indikator MACD, dan mekanisme reset perdagangan intraday. Pita rata-rata bergerak terdiri dari dua garis rata-rata dengan periode yang berbeda (9 dan 21), yang dapat dipilih dari berbagai jenis garis rata-rata termasuk SMA, EMA, SMMA, WMA, dan VWMA. Sistem MACD menggunakan pengaturan parameter 12/26/9 standar untuk menilai jumlah pergerakan tren masuk melalui sinyal diferensial garis cepat dan lambat, serta garis.
Keunggulan Strategis
- Keandalan ganda konfirmasi sinyal: Kombinasi dengan pelacakan tren dan indikator momentum, secara signifikan mengurangi risiko sinyal palsu
- Konfigurasi parameter yang fleksibel: mendukung berbagai jenis moving average yang dapat dioptimalkan sesuai dengan karakteristik pasar yang berbeda
- Pengendalian risiko yang sempurna: termasuk mekanisme reset perdagangan dalam sehari, efektif menghindari risiko semalam
- Efek visual yang menonjol: Integrasi tanda sinyal jual beli yang jelas dan tampilan strip rata untuk memudahkan keputusan perdagangan
Risiko Strategis
- Terbelakang pada perubahan tren: mungkin lebih lambat bereaksi pada saat pasar berubah dengan cepat karena menggunakan sistem linier
- Tidak berlaku untuk pasar bergoyang: sinyal palsu yang sering terjadi dalam pasar bergoyang horizontal
- Kesulitan mengoptimalkan parameter: parameter yang optimal dapat berbeda secara signifikan dalam lingkungan pasar yang berbeda
- Dampak penundaan eksekusi: Di pasar yang sangat bergejolak, sinyal mengkonfirmasi bahwa eksekusi sebenarnya mungkin memiliki perbedaan harga yang lebih besar
Arah optimasi strategi
- Memperkenalkan filter tingkat fluktuasi: disarankan untuk menambahkan ATR atau indikator tingkat fluktuasi untuk menyesuaikan sinyal yang memicu nilai ambang di lingkungan yang berfluktuasi tinggi
- Mekanisme konfirmasi sinyal yang dioptimalkan: dapat dipertimbangkan untuk meningkatkan konfirmasi volume atau konfirmasi bentuk harga, meningkatkan keandalan sinyal
- Manajemen risiko yang lebih baik: disarankan untuk menambahkan stop loss dan profit target yang dinamis, meningkatkan rasio risiko-keuntungan strategi
- Adaptasi pasar: Parameter dapat disesuaikan dengan dinamika pasar yang berbeda untuk meningkatkan adaptasi strategi
Meringkaskan
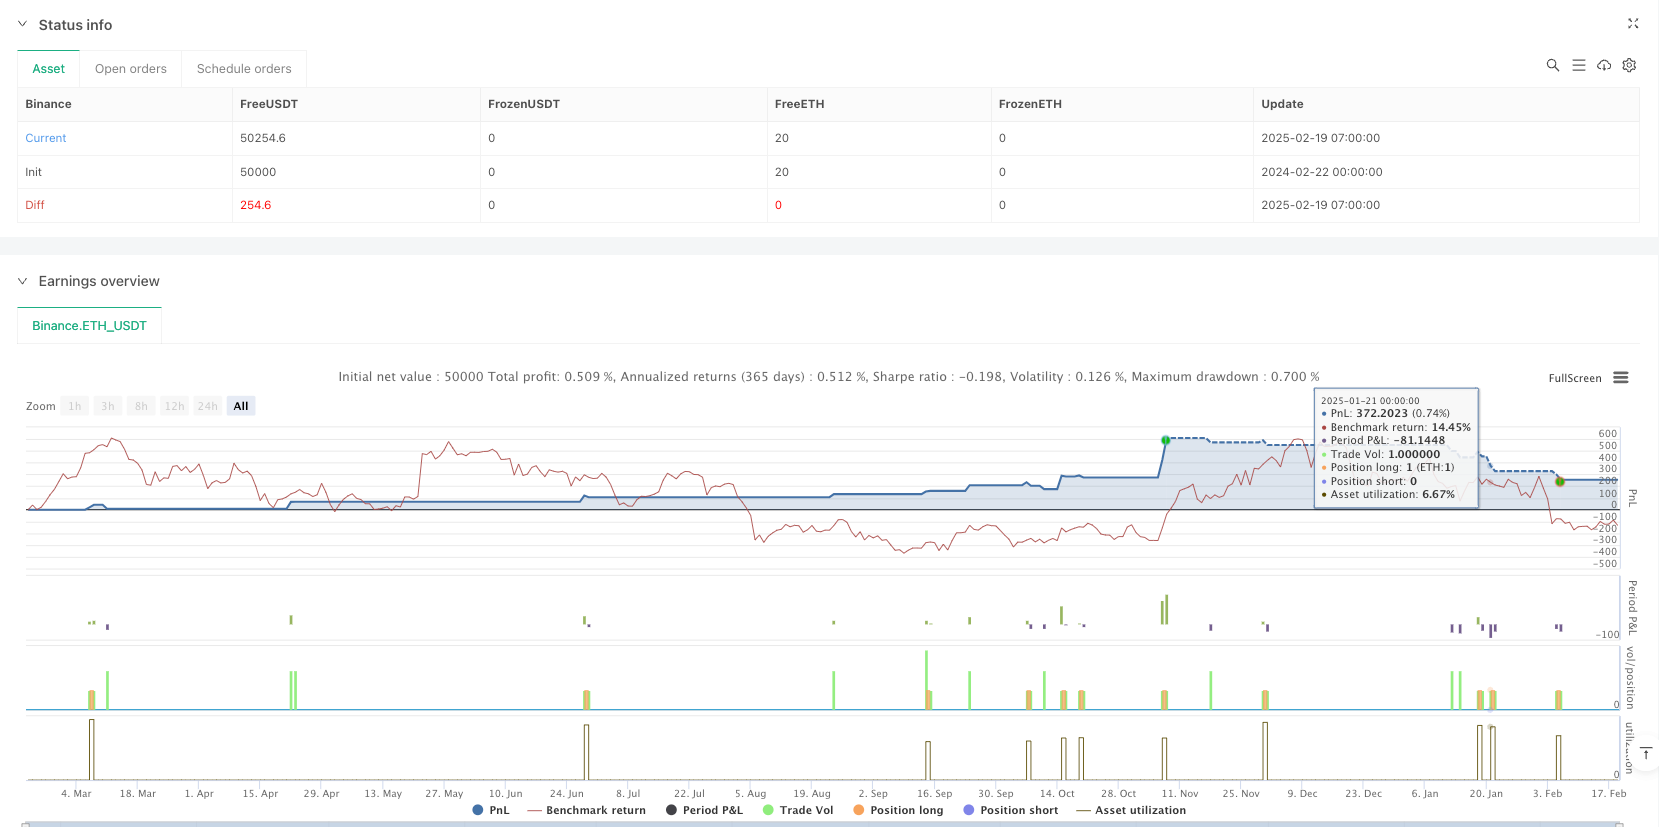
Strategi ini, dengan menggabungkan band rata-rata dan indikator MACD, membangun sistem perdagangan yang lebih baik. Meskipun ada risiko keterlambatan tertentu, dengan optimasi parameter dan manajemen risiko yang masuk akal, strategi ini dapat memberikan efek yang baik di pasar tren.
/*backtest
start: 2024-02-22 00:00:00
end: 2025-02-19 08:00:00
period: 1h
basePeriod: 1h
exchanges: [{"eid":"Binance","currency":"ETH_USDT"}]
*/

//@version=6
strategy("Daily MA Ribbon + MACD Crossover with Buy/Sell Signals", overlay=true)

// === Daily Reset Logic ===
var bool newDay = false  // Initialize newDay as a boolean variable
newDay := bool(ta.change(time("D")))  // Cast the result of ta.change to boolean

// === Moving Average Ribbon ===
ma(source, length, type) =>
    type == "SMA" ? ta.sma(source, length) :
     type == "EMA" ? ta.ema(source, length) :
     type == "SMMA (RMA)" ? ta.rma(source, length) :
     type == "WMA" ? ta.wma(source, length) :
     type == "VWMA" ? ta.vwma(source, length) :
     na

// MA1 (Short-term MA)
show_ma1   = input(true, "MA №1", inline="MA #1")
ma1_type   = input.string("EMA", "", inline="MA #1", options=["SMA", "EMA", "SMMA (RMA)", "WMA", "VWMA"])
ma1_source = input(close, "", inline="MA #1")
ma1_length = input.int(9, "", inline="MA #1", minval=1)  // Short-term MA (e.g., 9-period)
ma1_color  = input(color.blue, "", inline="MA #1")
ma1 = ma(ma1_source, ma1_length, ma1_type)
plot(show_ma1 ? ma1 : na, color = ma1_color, title="MA №1")

// MA2 (Long-term MA)
show_ma2   = input(true, "MA №2", inline="MA #2")
ma2_type   = input.string("EMA", "", inline="MA #2", options=["SMA", "EMA", "SMMA (RMA)", "WMA", "VWMA"])
ma2_source = input(close, "", inline="MA #2")
ma2_length = input.int(21, "", inline="MA #2", minval=1)  // Long-term MA (e.g., 21-period)
ma2_color  = input(color.red, "", inline="MA #2")
ma2 = ma(ma2_source, ma2_length, ma2_type)
plot(show_ma2 ? ma2 : na, color = ma2_color, title="MA №2")

// === MACD ===
fast_length = input(12, "Fast Length")
slow_length = input(26, "Slow Length")
signal_length = input.int(9, "Signal Smoothing", minval=1, maxval=50)
sma_source = input.string("EMA", "Oscillator MA Type", options=["SMA", "EMA"])
sma_signal = input.string("EMA", "Signal Line MA Type", options=["SMA", "EMA"])

// Calculate MACD
fast_ma = sma_source == "SMA" ? ta.sma(close, fast_length) : ta.ema(close, fast_length)
slow_ma = sma_source == "SMA" ? ta.sma(close, slow_length) : ta.ema(close, slow_length)
macd = fast_ma - slow_ma
signal = sma_signal == "SMA" ? ta.sma(macd, signal_length) : ta.ema(macd, signal_length)
hist = macd - signal

// Plot MACD
hline(0, "Zero Line", color = color.new(#787B86, 50))
plot(hist, title = "Histogram", style = plot.style_columns, color = (hist >= 0 ? (hist[1] < hist ? #26A69A : #B2DFDB) : (hist[1] < hist ? #FFCDD2 : #FF5252)))
plot(macd, title = "MACD", color = #2962FF)
plot(signal, title = "Signal", color = #FF6D00)

// === Buy/Sell Signal Logic ===
// Condition 1: MA1 (Short-term) crosses above MA2 (Long-term)
ma_crossover = ta.crossover(ma1, ma2)

// Condition 2: MACD line crosses above Signal line
macd_crossover = ta.crossover(macd, signal)

// Buy Signal: Both conditions must be true
buy_signal = ma_crossover and macd_crossover

// Sell Signal: MA1 crosses below MA2 or MACD crosses below Signal
sell_signal = ta.crossunder(ma1, ma2) or ta.crossunder(macd, signal)

// Reset signals at the start of each new day
if (newDay)
    buy_signal := false
    sell_signal := false

// Plot Buy/Sell Signals
plotshape(buy_signal, title="Buy Signal", location=location.belowbar, color=color.green, style=shape.labelup, text="BUY")
plotshape(sell_signal, title="Sell Signal", location=location.abovebar, color=color.red, style=shape.labeldown, text="SELL")

// Strategy Entry/Exit
if (buy_signal)
    strategy.entry("Buy", strategy.long)

if (sell_signal)
    strategy.close("Buy", comment="Sell")