4.2 JavaScript 言語で戦略的取引を実装する方法
作者: リン・ハーン優しさ作成日:2019年4月27日 11:53:15 更新日:概要
前回の記事では,JavaScript を使ってプログラムを書く際の基本的な文法と材料を含む基本的な知識を紹介しました. この記事では,実行可能な日中の定量的な取引戦略を達成するために,いくつかの一般的な戦略モジュールと技術指標と一緒に使用します.
戦略の導入
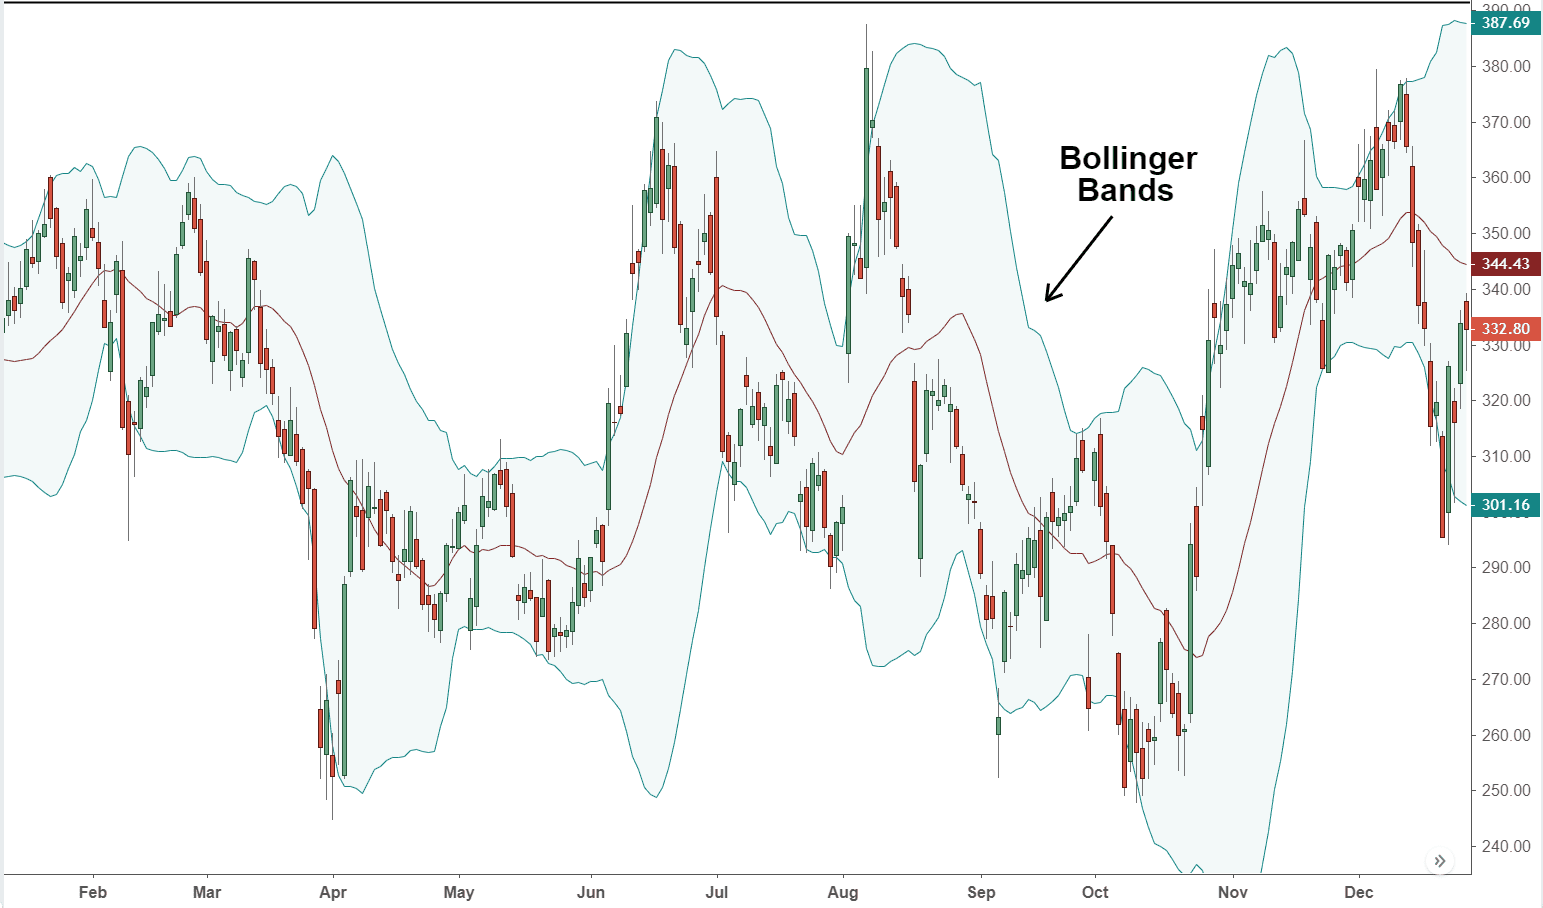
ボリンジャー帯 (Bollinger Band) は,1980年代にジョン・ボリンジャーによって発明された最も一般的に使用される技術指標の1つです.理論的には,価格は常に一定の値範囲の周りに変動します.ボリンジャー帯は,この理論的基盤に基づいており,
計算方法は,統計的原理を用いて,まず一段間の価格の"標準偏差"を計算し,次に移動平均の標準偏差の2倍を加算または減算して価格の"信頼区間"を見つけることです.基本型は3つの鉄道線 (中間鉄道,上鉄,下鉄) からなるストリップチャネルです.中間鉄道は平均価格であり,上鉄と下鉄はそれぞれ価格の圧力線とサポート線を表しています.以下のように:

標準偏差の概念により,ボリンジャー帯の幅は最近の価格変動に基づいて動的に調整される.変動が小さいとき,ボリンジャー帯は狭くなる.そうでなければ変動は大きくなり,ボリンジャー帯はより広いものになる.BOLLチャネルが狭いから広いに変化するとき,価格は徐々に平均に戻る.BOLLチャネルが広いから狭いに変化するとき,それは市場価格が変化し始めることを意味します.価格が上層線を越えた場合,それは購買力が強化されたことを意味します.価格が下層線を越えた場合,それは販売力が強化されたことを示します.
ボリンジャー・バンド指標計算方法
すべての技術指標の中で,ボリンジャー・バンド計算方法は最も複雑で,中央軌道 (MB),上軌道 (UP),下軌道 (DN) の計算を含む統計学における標準偏差の概念を導入しています.その計算方法は以下のとおりです:
-
中間レール = N 期間の単純な移動平均値
-
上部レール = 中部レール + K × N 時間の標準偏差
-
下列列 = 中間列 − K × N 時間段の標準偏差
function main( ) { // program entry
    while (true) { // enter the loop
        exchange.SetContactType('this_week'); // set contact type
        var records = exchange.GetRecods(); // get the k line array
        var boll = TA.B0LL(records, 50); // get the 50-cycle BOLL indicator array
        var top = boll[0]; // get the upper-rail BOLL indicator array
        var ma = boll[l]; // get the middle-rail BOLL indicator array
        var bottom = boll[2]; // get the lower-rail BOLL indicator array
        Log(top); // print the upper-rail BOLL indicator array to the log
        Log(ma); // print the middle-rail BOLL indicator array to the log
        Log(bottom);// print the lower-rail BOLL indicator array to the log
    }
}
戦略の論理
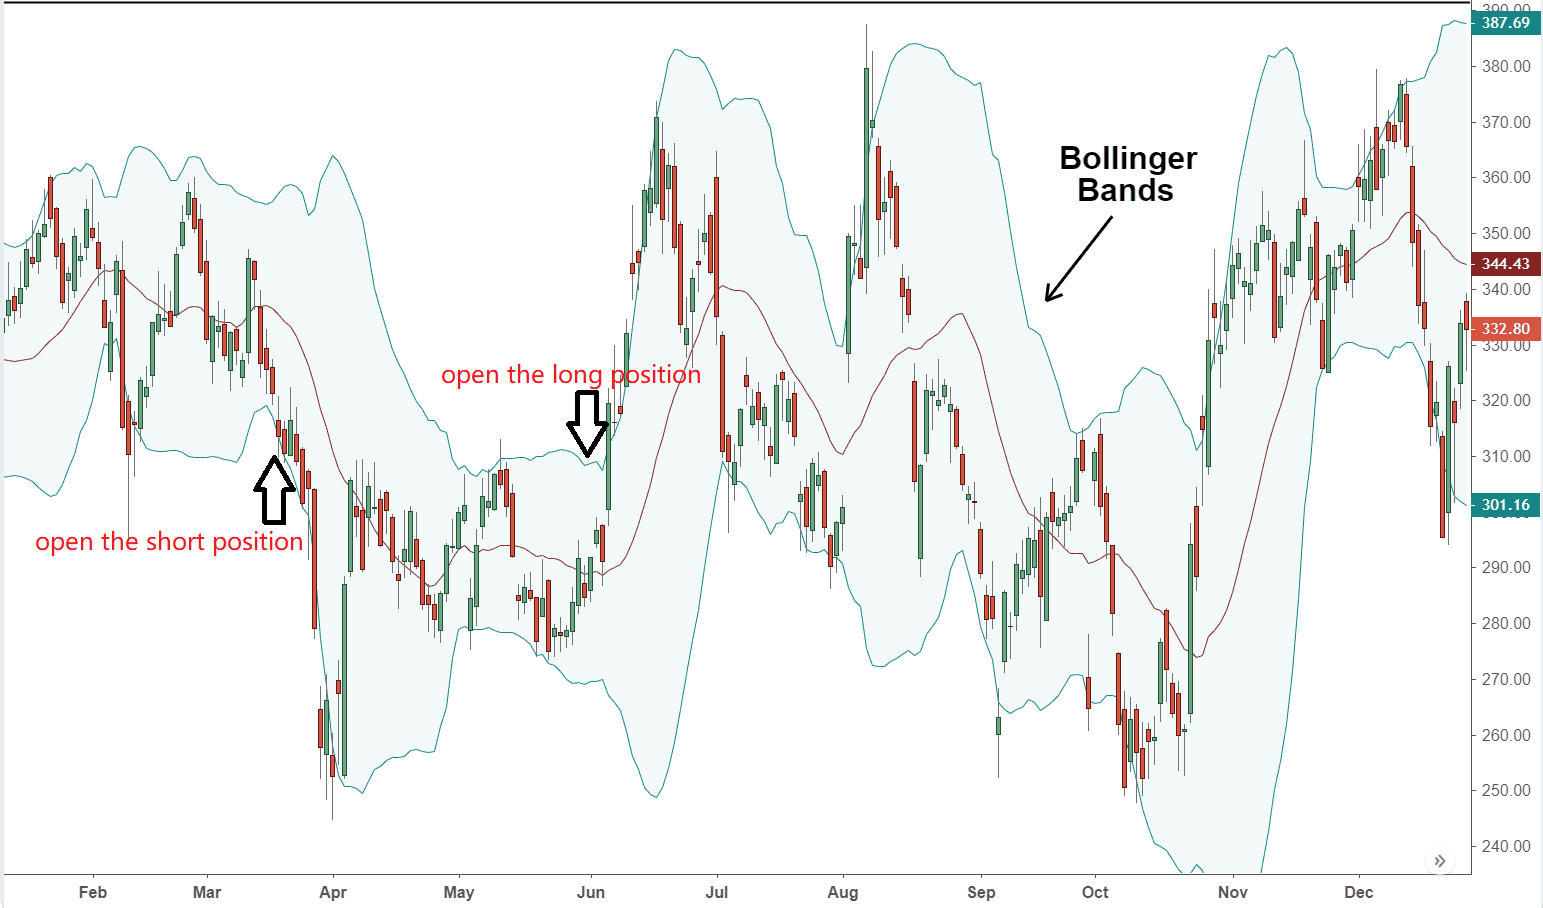
ボリンジャー帯は様々な方法で使用され,単独または他の指標と組み合わせて使用できます. このチュートリアルのセクションでは,最も簡単な方法で使用します. それは:価格が上部レールを破ると,ロングポジションを開きます.価格が下部レールを破ると,ショートポジションを開きます.

ロングポジションを開いた後,価格が再びボリンジャーバンドの中央線に戻ると,買い力の強さが弱くなったり,売り力の強さが強まったりすると考えます.
取引条件
-
ロング ポジション オープン: ポジションがない場合,閉じる価格が上レールより大きい場合.
-
ショートポジション: ポジションがない場合,閉じる価格が下線より低い場合.
-
ロングポジションを閉じる: ロングポジションを保持し,閉じる価格がミドルレールより低い場合,
-
ショートポジションを閉じる:ショートポジションを保持し,閉じる価格がミドルレールより大きい場合,
戦略コードの実施
戦略を達成するには,まず,どのデータが必要か検討する必要があります.どのAPIを通じて取得するか?次に,取引ロジックをどのように計算するか?最後に,どの方法でオーダーを配置するか? ステップごとに実行しましょう:
ステップ1:CTA戦略の枠組みを使用する
CTA戦略フレームワークと呼ばれるのは,FMZ Quantが公式に設計した標準フレームワークのセットです.このフレームワークを使用することで,些細なプログラミング問題を無視し,プログラミングの論理に直接焦点を当てることができます.例えば,このフレームワークを使用していない場合は,注文価格,注文種類,注文の引き下げなどを変更することを検討する必要があります.
function main() {
    $.CTA("this_week", function(st) {
        // write your strategy here
    })
}
上記は,FMZ Quant ツールを使用した CTA 戦略フレームワークです.これは固定コード形式で,すべての取引論理コードは行3から開始されます.使用中の多様性コードを変更する必要性に加えて,他の変更は必要ありません.
上記の取引品種コードは"this_week"で,週間のk線を用いて取引データを表す.
ステップ2:あらゆる種類のデータを取得
Bollinger Band インディケーターの上,中,下のレールと比較します. ストラテジカル・トレード・ロジックから,まず,現在のポジションの状態を得,
- K線データを取得する
K線数列で,ボリンジャー帯の指標を計算できます. これは次のように書ける:
function main() {
    $.CTA("this_week", function(st) {

        var r = st.records; // get the k line data
        if (r.length < 20) return; // filter the length of k line data
        var close = r[r.length - 2].Close; // get the previous k line closing price

    })
}
上記のように:
固定形式の K 線配列です
線5:K線の長さをフィルターします. ボリンジャーバンド指標を計算するパラメータは20なので,K線が20未満の場合は,ボリンジャーバンド指標を計算することはできません. ここでK線の長さをフィルターする必要があります. K線が20未満の場合は,直接返し,次のK線を待つことを続けます.
行6:取得したK線配列から,まず前回のK線のオブジェクトを取得し,このオブジェクトから閉じる価格を取得します.この配列の前期要素を取得し,これはこの配列の長さマイナス2 ((r[r.length-2]).
K線配列の要素はすべてオブジェクトで,オブジェクトには開口価格,最高値,最低値,閉値,取引量と時間が含まれています.
例えば,閉じる価格を得るには,属性名 (r[r.length-2].Close) の後に". "を追加するだけです.
- K線時間データを取得
これはイントラデイ戦略であるため,特定の時間前にすべてのポジションを閉じる必要があります ((ほとんどの暗号取引所は通常24/7開いています),したがって,現在のKラインが,取引を停止するか休憩するときに,特定の時間に近いかどうかを判断する必要があります. 閉じる時間Kラインに近い場合は,すべてのポジションを閉じる. そうでない場合は,戦略を継続します. コードは次のように書かれています:
function main() {
    $.CTA("this_week", function(st) {

        var r = st.records; // get the k line data
        if (r.length < 20) return; // filter the length of k line data
        var close = r[r.length - 2].Close; // get the previous k line closing price

        var time = new Date(r[r.length - 1].Time); // according the current k-line timestamp, create a time object
        var isClose = time.getHours() == 14 && time.getMinutes() == 45; // judging whether the current k-line is 14:45. this is just a example, you can specify any time you want during the 24 hours
    })
}
上記のように:
行8: K 行タイムスタンプ属性オブジェクトを取得し,それからタイムオブジェクト ((new Date (タイムスタンプ)) を作成します.
ライン9 時間オブジェクトに従って時間と分を計算し,現在のKラインの時間が14:45かどうかを決定します.
- 位置データを取得する
ポジション情報は定量的な取引戦略の非常に重要な条件です.取引条件が確立されたとき,ポジションの状態とポジションの数によってオーダーを出すかどうかを判断する必要があります.例えば,ロングポジションを開設するための条件が確立されたとき,ホールディングポジションがある場合はオーダーを入れません.ホールディングポジションがない場合は,次のようにオーダーを入れます.
function main() {
    $.CTA("this_week", function(st) {

        var r = st.records; // get the k line data
        if (r.length < 20) return; // filter the length of k line data
        var close = r[r.length - 2].Close; // get the previous k line closing price

        var time = new Date(r[r.length - 1].Time); // according the current k-line timestamp, create a time object
        var isClose = time.getHours() == 14 && time.getMinutes() == 45; // judging whether the current k-line is 14:45. this is just a example, you can specify any time you want during the 24 hours

        var mp = st.position.amount; // get the holding position information

    })
}
上記のように:
ライン11:現在のポジションの状態を取得します. ロングポジションがある場合,値は 1;ショートポジションがある場合,値は -1; ポジションがない場合,値は 0 です.
- ボリンジャー・バンドのデータを取得します
次にボリンジャーバンド指標の上,中,下列レールの値を計算します.まずボリンジャーバンド配列を取得し,この配列から上,中,下列レールの値を取得します. FMZ量子ツールでは,ボリンジャーバンド配列を取得することは非常に簡単です.ボリンジャーバンドAPIを直接呼び出すだけで,それは二次元配列です.
2次元の配列は,配列内の配列である.配列内の配列を理解するのは簡単です.値を取得する順序は,まず配列内の指定配列を取得し,次に下記のように指定配列から指定された要素を取得します:
var arr = [[100, 200, 300],[10,20,30],[1,2,3]]; // this is a two-dimensional array
var test = arr[0]; //first obtain the specified array in the array and assign the value to variable "test"
var demo1 = test[0]; //then get a value from the test array
demo1; // the result is : 100

var demo2 = arr[0][0]; // you also can write like this
demo2; // the result is the same : 100
下では, 13 番から 19 番までの行はボリンジャーバンド上,中,下レールのコーディング部分を取得し, 13 番は FMZ Quant API ツールを使用し,ボリンジャーバンド配列に直接アクセスできます. 14 番から 16 番は上,中,下レールの配列の 2 次元の配列を取得しています. 17 番から 19 番は上,中,下レールの配列から指定値を取得しています.
function main() {
    $.CTA("this_week", function(st) {

        var r = st.records; // get the k line data
        if (r.length < 20) return; // filter the length of k line data
        var close = r[r.length - 2].Close; // get the previous k line closing price

        var time = new Date(r[r.length - 1].Time); // according the current k-line timestamp, create a time object
        var isClose = time.getHours() == 14 && time.getMinutes() == 45; // judging whether the current k-line is 14:45. this is just a example, you can specify any time you want during the 24 hours

        var mp = st.position.amount; // get the holding position information

        var boll = TA.BOLL(r, 20, 2); //calucating the Bollinger Band indicator
        var upLine = boll[0]; // get the up-rail array
        var midLine = boll[1]; // get the middle-rail array
        var downLine = boll[2]; // get the lower-rail array
        var upPrice = upLine[upLine.length - 2];  // get the previous K-line upper rail value
        var midPrice = midLine[midLine.length -2]; // get the previous K-line middle rail value
        var downPrice = downLine[downLine.length -2]; // get the previous K-line lower rail value

    })
}
ステップ3:注文と取引
上記のデータで,現在,取引論理と注文の配置を書き込むことができます. また,非常にシンプルで,最も一般的に使用されているのは,条件1と条件2が本当なら,注文を;条件3または条件4が本当なら,注文をします. 下記のとおり:
function main() {
    $.CTA("this_week", function(st) {

        var r = st.records; // get the k line data
        if (r.length < 20) return; // filter the length of k line data
        var close = r[r.length - 2].Close; // get the previous k line closing price

        var time = new Date(r[r.length - 1].Time); // according the current k-line timestamp, create a time object
        var isClose = time.getHours() == 14 && time.getMinutes() == 45; // judging whether the current k-line is 14:45. this is just a example, you can specify any time you want during the 24 hours

        var mp = st.position.amount; // get the holding position information

        var boll = TA.BOLL(r, 20, 2); //calucating the Bollinger Band indicator
        var upLine = boll[0]; // get the up-rail array
        var midLine = boll[1]; // get the middle-rail array
        var downLine = boll[2]; // get the lower-rail array
        var upPrice = upLine[upLine.length - 2]; // get the previous K-line upper rail value
        var midPrice = midLine[midLine.length -2]; // get the previous K-line middle rail value
        var downPrice = downLine[downLine.length -2]; // get the previous K-line lower rail value

        if (mp == 1 && (close < midPrice || isClose)) return -1; // if holding long position, and the closing price is less than the mid-rail, or the current time is 14:45, closing long position.
        if (mp == -1 && (close > midPrice || isClose)) return 1; // if holding short position, and the closing price is greater than the mid-rail, or the current time is 14:45, closing short position.
        if (mp == 0 && close > upPrice && !isClose) return 1; // if there are no holding position, and the closing price is greater than the upper-rail, or the current time is not 14:45, open long position.
        if (mp == 0 && close < downPrice && !isClose) return -1;// if there are no holding position, and the closing price is less than the lower-rail, or the current time is not 14:45, open short position.

    })
}
上記の図では,行21から24は,取引論理と注文の配達コードの部分である.上から下へは,ロングポジションを閉じる,ショートポジションを閉じる,ロングポジションを開く,ショートポジションを開く.
オープン・ロングポジションを例として挙げましょう. これは
この線には"return 1"と"return -1"があることがわかります. これは固定形式です. つまり,買い方向であれば"return 1"と書き,売方向であれば"return -1"と書き,ロングポジションを開くとショートポジションを閉じるのはすべて買い方向なので,
戦略のコード
この時点で,完全な戦略コードが書かれています. 取引フレームワーク,取引データ,取引論理,注文の配置が別々に書かれれば,それは非常に簡単です. 以下はこの戦略の完全なコードです:
function main() {
    $.CTA("this_week", function(st) {
        var r = st.records; // get the k line data
        if (r.length < 20) return; // filter the length of k line data
        var close = r[r.length - 2].Close; // get the previous k line closing price
        var time = new Date(r[r.length - 1].Time); // according the current k-line timestamp, create a time object
        var isClose = time.getHours() == 14 && time.getMinutes() == 45; // judging whether the current k-line is 14:45. this is just a example, you can specify any time you want during the 24 hours
        var mp = st.position.amount; // get the holding position information
        var boll = TA.BOLL(r, 20, 2); //calucating the Bollinger Band indicator
        var upLine = boll[0]; // get the up-rail array
        var midLine = boll[1]; // get the middle-rail array
        var downLine = boll[2]; // get the lower-rail array
        var upPrice = upLine[upLine.length - 2]; // get the previous K-line upper rail value
        var midPrice = midLine[midLine.length -2]; // get the previous K-line middle rail value
        var downPrice = downLine[downLine.length -2]; // get the previous K-line lower rail value
        if (mp == 1 && (close < midPrice || isClose)) return -1; // if holding long position, and the closing price is less than the mid-rail, or the current time is 14:45, closing long position.
        if (mp == -1 && (close > midPrice || isClose)) return 1; // if holding short position, and the closing price is greater than the mid-rail, or the current time is 14:45, closing short position.
        if (mp == 0 && close > upPrice && !isClose) return 1; // if there are no holding position, and the closing price is greater than the upper-rail, or the current time is not 14:45, open long position.
        if (mp == 0 && close < downPrice && !isClose) return -1;// if there are no holding position, and the closing price is less than the lower-rail, or the current time is not 14:45, open short position.
    })
}
2つのことが注意が必要です:
-
現在のK線条件が確立されたときに戦略論理を書いて,次に次のk線に注文を置く.または以前のk線条件が確立され,現在のk線に注文を置く.この方法で,バックテストの結果と実際の市場パフォーマンスはあまり異なります.このように書くことは問題ありませんが,戦略論理が正しいかどうかを注意してください.
-
一般的に,閉店ポジションの論理は開店ポジションの論理の前で書くべきです.この目的は,戦略論理があなたの期待に応えるようにすることです.例えば,戦略論理がちょうどポジションを閉じる後に逆の方向での取引を行う必要がある状況を満たす場合,この種の状況のルールは,まずポジションを閉じて新しいポジションを開くことです.開店ポジションの論理の前で閉店ポジションの論理を書くと,このルールを完璧に満たします.
結論から言うと
上記では,戦略導入,ボリンガー指標計算方法,戦略論理,取引条件,戦略コード実装などを含む,完全な日中の定量取引戦略の開発の各ステップを学びました. この戦略ケースを通じて,我々はFMZ Quantツールのプログラミング方法に馴染みがあるだけでなく,このテンプレートに従って適応されたいくつかの他の戦略を構築することができます.
定量的な取引戦略は,主観的な取引経験やシステムの概要に過ぎません. 定量的な戦略を書く前に主観的な取引で使用された経験やシステムを書き下ろし,それをコードに1つずつ翻訳すると,定量的な戦略を書くことがはるかに簡単になります.
次のセクションの通知
定量的な取引戦略開発において,ただ一つのプログラミング言語しか選択できないなら,躊躇することなく,それはPythonである必要があります.データ取得からバックテスト,注文の配置部分まで,Pythonはビジネスチェーン全体をカバーしています.金融量的な投資の分野で,Pythonは非常に重要な位置を占めています.次のコースではPython言語を学ぶようになります.
放課後 運動
-
このセクションの知識を使用して,二重移動平均戦略を実装してみてください.
-
KDJ指標戦略をJavaScript言語を使用して FMZ Quantプラットフォームで実装してみてください.
- なぜ回転時に収益率と期待が一致しないのか?
- この問題は,私が書いたコードで起こっています.
- 一般協定 (レインディン取引所LOEX)
- 図面図書には,長行列を足す方法があります.
- 戦略的再評価は,どんな利得基準になるのでしょうか?
- 4.5 C++ 言語 早いスタート
- 4.4 Python 言語で戦略を実装する方法
- 滑り点数は何ですか?
- GateIO フューチャー利用総和
- 4.3 パイソン言語の使い方
- Python3のネイティブ回帰システムを構築するにはどうすればいいですか?
- 4.1 JavaScript 言語の早いスタート
- 3.5 ビジュアル プログラミング言語 取引戦略の実施
- GetTicker (ゲットティッカー) が取得したデータは何故空っぽなのかお尋ねください
- 3.4 視覚プログラミングの早い開始
- 3.3 M言語での戦略の実施方法
- ロープの取引の仕組みは?
- OKEXのEOS先物取引ペアを追加するにはどうすればいいですか?
- 新取引所を追加するにはどうすればいいですか? コインを作成したいですか?
- ロボットが起動し,実行中に戦略を変更すれば,効果はあるのか?