ランダム・ティッカー・ジェネレーターに基づく戦略テスト方法に関する議論
作者: リン・ハーンFMZ~リディア作成日:2024-12-02 11:26:13, 更新日:2024-12-02 21:39:39
前言
FMZ Quant Trading Platformのバックテストシステムは,絶えず繰り返され,更新され,アップグレードされているバックテストシステムです. 当初の基本的なバックテスト機能から機能を追加し,パフォーマンスを徐々に最適化します. プラットフォームの開発とともに,バックテストシステムは引き続き最適化され,アップグレードされます. 本日はバックテストシステムに基づいたトピックについて議論します:
需要
定量取引の分野では,戦略の開発と最適化は,実際の市場データの検証から切り離すことはできない.しかし,実際のアプリケーションでは,複雑で変化する市場環境のために,極端な市場状況や特殊なシナリオのカバー不足などのバックテストのための歴史的データに依存することは不十分である.したがって,効率的なランダム市場生成物を設計することは定量戦略開発者にとって効果的なツールとなっています.
戦略が特定の取引所または通貨の歴史的データを追跡する必要がある場合,バックテストのためにFMZプラットフォームの公式データソースを使用することができます.時には,戦略が完全に知らない市場でどのように機能するか見たいので,戦略をテストするためにいくつかのデータを製造することができます.
ランダム・ティッカーデータを使用する意義は:
-
- 戦略の堅牢さを評価する ランダム・ティッカー・ジェネレーターは,極端な変動,低い変動,トレンド市場,不安定な市場を含むさまざまな可能な市場シナリオを作成することができます.これらのシミュレーション環境でのテスト戦略は,異なる市場条件下でパフォーマンスが安定しているかどうかを評価するのに役立ちます.例えば:
戦略は傾向や変動の変化に適応できるのか? 極端な市場状況下では 戦略は大きな損失を伴うのでしょうか?
-
- 戦略の潜在的な弱点を特定する いくつかの異常な市場状況 (仮説的なブラック・スワン・イベントなど) をシミュレートすることで,戦略の潜在的な弱点を発見し改善することができます.例えば:
戦略は 市場構造に 依存しているのでしょうか? パラメーターが過剰に 調整される危険性はあるのか?
-
- 戦略パラメータの最適化 ランダム生成されたデータは,ストラテジーのパラメータ最適化のために,完全に歴史的なデータに依存する必要なく,より多様なテスト環境を提供します. これにより,ストラテジーのパラメータ範囲をより包括的に見つけることができ,歴史的なデータにおける特定の市場パターンに限定されないことができます.
-
- 歴史的データにおけるギャップを埋める 一部の市場 (新興市場や小規模通貨取引市場など) では,過去のデータがすべての可能な市場条件をカバーするのに不十分である可能性があります.ランダムティッカー生成器は,より包括的なテストを行うのに役立つ大量の補充データを提供できます.
-
- 急速な繰り返し開発 ランダムデータを使用して迅速なテストを行うことは,リアルタイム市場状況や時間がかかるデータ清掃と組織に依存することなく,戦略開発の繰り返しを加速することができます.
しかし,戦略を合理的に評価することも必要です.ランダムに生成されたティッカーデータについては,以下を注意してください.
-
- ランダムな市場生成者は有用であるが,その重要性は生成されたデータの質とターゲットシナリオの設計に依存する.
-
- 生成論理は,実際の市場に近いものでなければならない.ランダムに生成された市場が現実と完全に接触していない場合,テスト結果は基準値がない可能性があります.例えば,ジェネレータは実際の市場統計的特徴 (変動分布,トレンド比率など) に基づいて設計することができます.
-
- 実際のデータテストを完全に置き換えることはできません.ランダムデータは,戦略の開発と最適化にのみ補完することができます.最終的な戦略は,実際の市場データでの有効性を確認する必要があります.
バックテストシステムに 簡単に簡単に 簡単に 簡単に 使えるように 作り出す方法です
デザイン アイデア
この記事は,議論の出発点を提供するために設計されており,比較的簡単なランダムティッカー生成計算を提供します.実際には,さまざまなシミュレーションアルゴリズム,データモデル,および他の技術が適用できます.議論のスペースが限られているため,複雑なデータシミュレーション方法を使用しません.
プラットフォームのバックテストシステムのカスタムデータソース機能を組み合わせて Pythonでプログラムを書きました
-
- ランダムにK線データを生成し CSVファイルに書き込み,生成されたデータを保存できます.
-
- バックテストシステムへのデータソースサポートを提供するサービスを作成します
-
- 図に生成されたK線データを表示する.
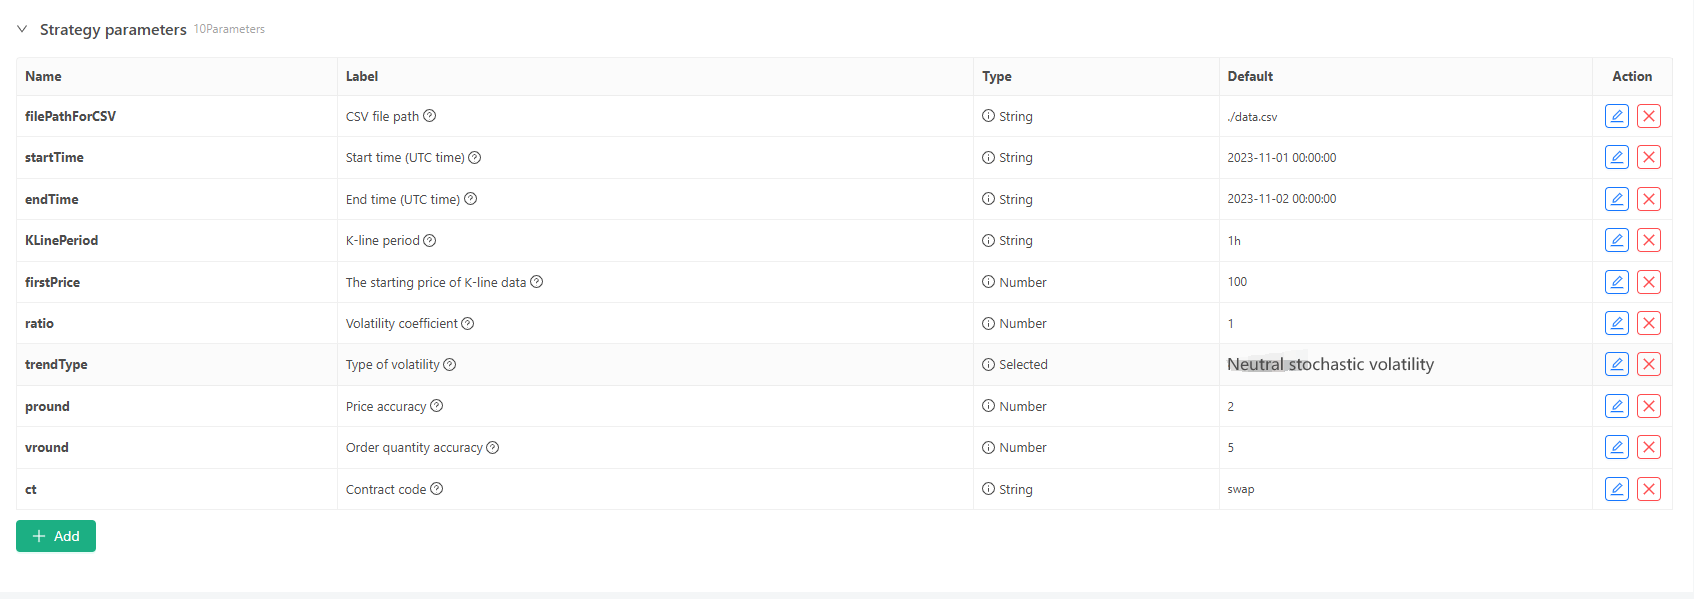
いくつかの生成標準およびK線データのファイル格納については,次のパラメータ制御を定義することができる.

-
ランダムなデータ生成モード K線データの変動タイプをシミュレートするには,単に正数と負のランダム数の確率を用いて単純な設計を行う.生成されたデータが多くない場合,必要な市場パターンを反映しない可能性があります.より良い方法がある場合,コードのこの部分は置き換えることができます. このシンプルな設計に基づいて,ランダム数生成範囲とコード内のいくつかの係数を調整することで生成されたデータ効果に影響を与えることができます.
-
データの検証 生成されたK線データも合理性を検証し,高開場価格と低閉場価格が定義に違反しているかどうかを確認し,K線データの連続性を確認する必要があります.
バックテストシステム ランダム・ティッカー・ジェネレーター
import _thread
import json
import math
import csv
import random
import os
import datetime as dt
from http.server import HTTPServer, BaseHTTPRequestHandler
from urllib.parse import parse_qs, urlparse

arrTrendType = ["down", "slow_up", "sharp_down", "sharp_up", "narrow_range", "wide_range", "neutral_random"]

def url2Dict(url):
    query = urlparse(url).query
    params = parse_qs(query)
    result = {key: params[key][0] for key in params}
    return result

class Provider(BaseHTTPRequestHandler):
    def do_GET(self):
        global filePathForCSV, pround, vround, ct
        try:
            self.send_response(200)
            self.send_header("Content-type", "application/json")
            self.end_headers()

            dictParam = url2Dict(self.path)
            Log("the custom data source service receives the request, self.path:", self.path, "query parameter:", dictParam)

            eid = dictParam["eid"]
            symbol = dictParam["symbol"]
            arrCurrency = symbol.split(".")[0].split("_")
            baseCurrency = arrCurrency[0]
            quoteCurrency = arrCurrency[1]
            fromTS = int(dictParam["from"]) * int(1000)
            toTS = int(dictParam["to"]) * int(1000)
            priceRatio = math.pow(10, int(pround))
            amountRatio = math.pow(10, int(vround))

            data = {
                "detail": {
                    "eid": eid,
                    "symbol": symbol,
                    "alias": symbol,
                    "baseCurrency": baseCurrency,
                    "quoteCurrency": quoteCurrency,
                    "marginCurrency": quoteCurrency,
                    "basePrecision": vround,
                    "quotePrecision": pround,
                    "minQty": 0.00001,
                    "maxQty": 9000,
                    "minNotional": 5,
                    "maxNotional": 9000000,
                    "priceTick": 10 ** -pround,
                    "volumeTick": 10 ** -vround,
                    "marginLevel": 10,
                    "contractType": ct
                },
                "schema" : ["time", "open", "high", "low", "close", "vol"],
                "data" : []
            }

            listDataSequence = []
            with open(filePathForCSV, "r") as f:
                reader = csv.reader(f)
                header = next(reader)
                headerIsNoneCount = 0
                if len(header) != len(data["schema"]):
                    Log("The CSV file format is incorrect, the number of columns is different, please check!", "#FF0000")
                    return
                for ele in header:
                    for i in range(len(data["schema"])):
                        if data["schema"][i] == ele or ele == "":
                            if ele == "":
                                headerIsNoneCount += 1
                            if headerIsNoneCount > 1:
                                Log("The CSV file format is incorrect, please check!", "#FF0000")
                                return
                            listDataSequence.append(i)
                            break

                while True:
                    record = next(reader, -1)
                    if record == -1:
                        break
                    index = 0
                    arr = [0, 0, 0, 0, 0, 0]
                    for ele in record:
                        arr[listDataSequence[index]] = int(ele) if listDataSequence[index] == 0 else (int(float(ele) * amountRatio) if listDataSequence[index] == 5 else int(float(ele) * priceRatio))
                        index += 1
                    data["data"].append(arr)
            Log("data.detail: ", data["detail"], "Respond to backtesting system requests.")
            self.wfile.write(json.dumps(data).encode())
        except BaseException as e:
            Log("Provider do_GET error, e:", e)
        return

def createServer(host):
    try:
        server = HTTPServer(host, Provider)
        Log("Starting server, listen at: %s:%s" % host)
        server.serve_forever()
    except BaseException as e:
        Log("createServer error, e:", e)
        raise Exception("stop")

class KlineGenerator:
    def __init__(self, start_time, end_time, interval):
        self.start_time = dt.datetime.strptime(start_time, "%Y-%m-%d %H:%M:%S")
        self.end_time = dt.datetime.strptime(end_time, "%Y-%m-%d %H:%M:%S")
        self.interval = self._parse_interval(interval)
        self.timestamps = self._generate_time_series()

    def _parse_interval(self, interval):
        unit = interval[-1]
        value = int(interval[:-1])

        if unit == "m":
            return value * 60
        elif unit == "h":
            return value * 3600
        elif unit == "d":
            return value * 86400
        else:
            raise ValueError("Unsupported K-line period, please use 'm', 'h', or 'd'.")

    def _generate_time_series(self):
        timestamps = []
        current_time = self.start_time
        while current_time <= self.end_time:
            timestamps.append(int(current_time.timestamp() * 1000))
            current_time += dt.timedelta(seconds=self.interval)
        return timestamps

    def generate(self, initPrice, trend_type="neutral", volatility=1):
        data = []
        current_price = initPrice
        angle = 0
        for timestamp in self.timestamps:
            angle_radians = math.radians(angle % 360)
            cos_value = math.cos(angle_radians)

            if trend_type == "down":
                upFactor = random.uniform(0, 0.5)
                change = random.uniform(-0.5, 0.5 * upFactor) * volatility * random.uniform(1, 3)
            elif trend_type == "slow_up":
                downFactor = random.uniform(0, 0.5)
                change = random.uniform(-0.5 * downFactor, 0.5) * volatility * random.uniform(1, 3)
            elif trend_type == "sharp_down":
                upFactor = random.uniform(0, 0.5)
                change = random.uniform(-10, 0.5 * upFactor) * volatility * random.uniform(1, 3)
            elif trend_type == "sharp_up":
                downFactor = random.uniform(0, 0.5)
                change = random.uniform(-0.5 * downFactor, 10) * volatility * random.uniform(1, 3)
            elif trend_type == "narrow_range":
                change = random.uniform(-0.2, 0.2) * volatility * random.uniform(1, 3)
            elif trend_type == "wide_range":
                change = random.uniform(-3, 3) * volatility * random.uniform(1, 3)
            else:
                change = random.uniform(-0.5, 0.5) * volatility * random.uniform(1, 3)

            change = change + cos_value * random.uniform(-0.2, 0.2) * volatility
            open_price = current_price
            high_price = open_price + random.uniform(0, abs(change))
            low_price = max(open_price - random.uniform(0, abs(change)), random.uniform(0, open_price))
            close_price = open_price + change if open_price + change < high_price and open_price + change > low_price else random.uniform(low_price, high_price)

            if (high_price >= open_price and open_price >= close_price and close_price >= low_price) or (high_price >= close_price and close_price >= open_price and open_price >= low_price):
                pass
            else:
                Log("Abnormal data:", high_price, open_price, low_price, close_price, "#FF0000")

            high_price = max(high_price, open_price, close_price)
            low_price = min(low_price, open_price, close_price)

            base_volume = random.uniform(1000, 5000)
            volume = base_volume * (1 + abs(change) * 0.2)

            kline = {
                "Time": timestamp,
                "Open": round(open_price, 2),
                "High": round(high_price, 2),
                "Low": round(low_price, 2),
                "Close": round(close_price, 2),
                "Volume": round(volume, 2),
            }
            data.append(kline)
            current_price = close_price
            angle += 1
        return data

    def save_to_csv(self, filename, data):
        with open(filename, mode="w", newline="") as csvfile:
            writer = csv.writer(csvfile)
            writer.writerow(["", "open", "high", "low", "close", "vol"])
            for idx, kline in enumerate(data):
                writer.writerow(
                    [kline["Time"], kline["Open"], kline["High"], kline["Low"], kline["Close"], kline["Volume"]]
                )

        Log("Current path:", os.getcwd())
        with open("data.csv", "r") as file:
            lines = file.readlines()
            if len(lines) > 1:
                Log("The file was written successfully. The following is part of the file content:")
                Log("".join(lines[:5]))
            else:
                Log("Failed to write the file, the file is empty!")

def main():
    Chart({})
    LogReset(1)

    try:
        # _thread.start_new_thread(createServer, (("localhost", 9090), ))
        _thread.start_new_thread(createServer, (("0.0.0.0", 9090), ))
        Log("Start the custom data source service thread, and the data is provided by the CSV file.", ", Address/Port: 0.0.0.0:9090", "#FF0000")
    except BaseException as e:
        Log("Failed to start custom data source service!")
        Log("error message:", e)
        raise Exception("stop")

    while True:
        cmd = GetCommand()
        if cmd:
            if cmd == "createRecords":
                Log("Generator parameters:", "Start time:", startTime, "End time:", endTime, "K-line period:", KLinePeriod, "Initial price:", firstPrice, "Type of volatility:", arrTrendType[trendType], "Volatility coefficient:", ratio)
                generator = KlineGenerator(
                    start_time=startTime,
                    end_time=endTime,
                    interval=KLinePeriod,
                )
                kline_data = generator.generate(firstPrice, trend_type=arrTrendType[trendType], volatility=ratio)
                generator.save_to_csv("data.csv", kline_data)
                ext.PlotRecords(kline_data, "%s_%s" % ("records", KLinePeriod))
        LogStatus(_D())
        Sleep(2000)
バックテストシステムでの練習
- 上記の戦略インスタンスを作成し,パラメータを設定して実行します.
- ライブ取引 (戦略インスタンスは) はサーバーに配置されたドッカーで実行され,バックテストシステムがアクセスしてデータを取得できるように,公開ネットワークIPが必要です.
- インタラクションボタンをクリックすると 戦略は自動的にランダムティッカーデータを生成します

- 生成されたデータは,簡単な観察のためにチャートに表示され,データはローカルデータ.csv ファイルに記録されます.

- バックテストのどんな戦略でも使えます.

/*backtest
start: 2024-10-01 08:00:00
end: 2024-10-31 08:55:00
period: 1h
basePeriod: 1h
exchanges: [{"eid":"Futures_Binance","currency":"BTC_USDT","feeder":"http://xxx.xxx.xxx.xxx:9090"}]
args: [["ContractType","quarter",358374]]
*/
上記の情報に従って設定して調整します.http://xxx.xxx.xxx.xxx:9090ランダム・ティッカー生成戦略のサーバIPアドレスとオープンポートです.
これはプラットフォーム API ドキュメントのカスタム データ ソース セクションで見つけられるカスタム データ ソースです.
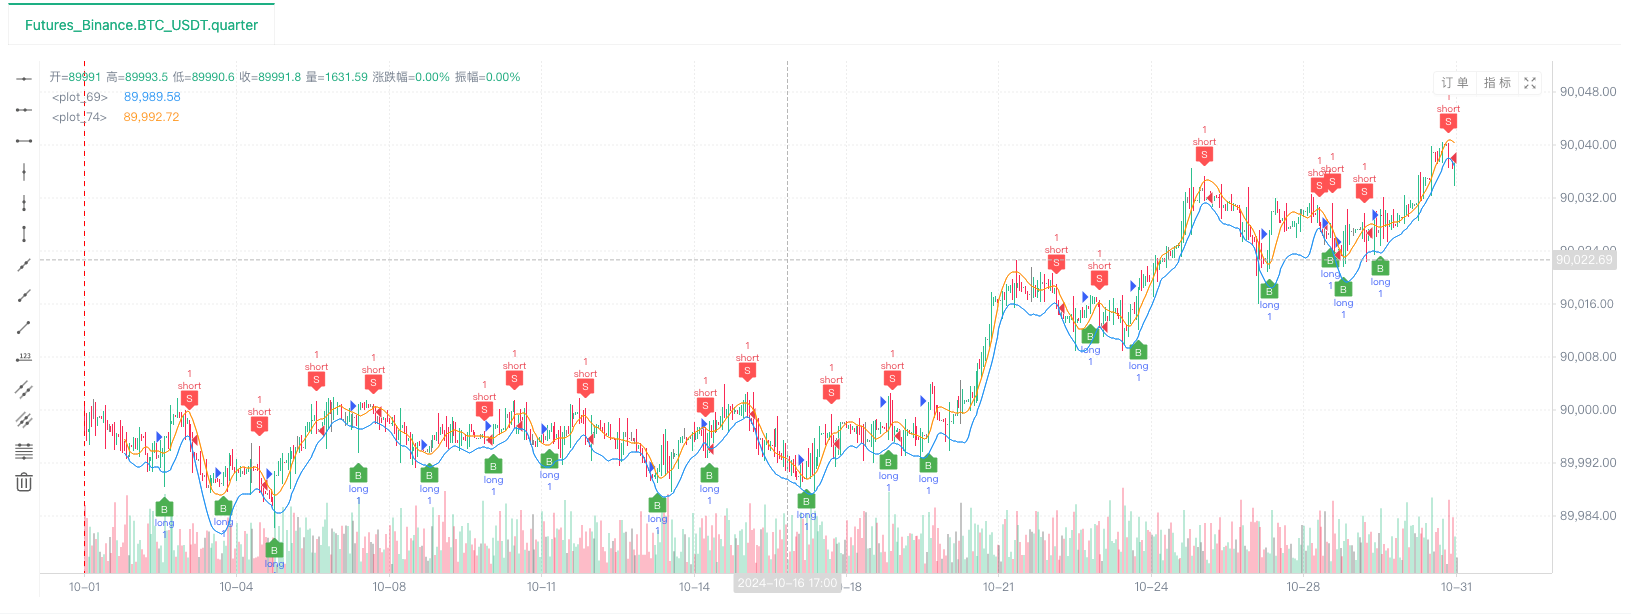
- ランダムな市場データをテストできます.


この時点で,バックテストシステムは,我々の"製造された"シミュレーションデータでテストされます.バックテスト中に,ティカーチャート内のデータに従って,ランダム市場によって生成されたライブトレーディングチャート内のデータが比較されます.時間:2024年10月16日17時,データは同じです.
- このPythonプログラムがライブ取引を作成する理由は,生成されたK線データのデモ,操作,表示を容易にするためです.実際のアプリケーションでは,独立したPythonスクリプトを書くことができますので,ライブ取引を実行する必要はありません.
戦略のソースコード:バックテストシステム ランダム・ティッカー・ジェネレーター
応援と読書ありがとうございました
- DEX取引所の量化実践 ((1)-- dYdX v4 ユーザーガイド
- デジタル通貨におけるリード-ラグ套路の紹介 (3)
- 暗号通貨におけるリード・ラグ・アービトラージへの導入 (2)
- デジタル通貨におけるリード-ラグ套路の紹介 (2)
- FMZプラットフォームの外部信号受信に関する議論: 戦略におけるHttpサービス内蔵の信号受信のための完全なソリューション
- FMZプラットフォームの外部信号受信に関する探求:戦略内蔵Httpサービス信号受信の完全な方案
- 暗号通貨におけるリード・ラグ・アービトラージへの導入 (1)
- デジタル通貨におけるリード-ラグ套路の紹介 (1)
- FMZプラットフォームの外部信号受信に関する議論:拡張API VS戦略内蔵HTTPサービス
- FMZプラットフォームの外部信号受信に関する探究:拡張API vs 戦略内蔵HTTPサービス
- ランダム市場生成器に基づく戦略テスト方法について
- FMZ Quant の新しい機能: _Serve 機能を使用して HTTP サービスを簡単に作成する
- 発明者による新機能の量化: _Serve関数を使用して簡単にHTTPサービスを作成する
- FMZ 量子取引プラットフォーム カスタム プロトコル アクセスガイド
- FMZ 資金調達の利子獲得と監視戦略
- FMZの資金調達・監視戦略
- WebSocket Market をシームレスに利用できるようにする戦略テンプレート
- ウェブソケットをシームレスに使える ポリシーテンプレート
- 発明者定量化取引プラットフォームの通用プロトコルへのアクセスガイド
- FMZのアップグレード後に迅速にユニバーサルマルチ通貨取引戦略を構築する方法