4.6 C++言語で戦略を実装する方法
作者: リン・ハーン優しさ, 作成日:2019-06-25 13:36:16, 更新日:2023-11-09 20:43:30
概要
前回の記事では,C++言語,基本的な文法,戦略構造の導入から取引戦略の実施の前提を説明しました.この記事では,前回の部分を続け,実行可能な定量的な取引戦略を段階的に実施します.
戦略の紹介
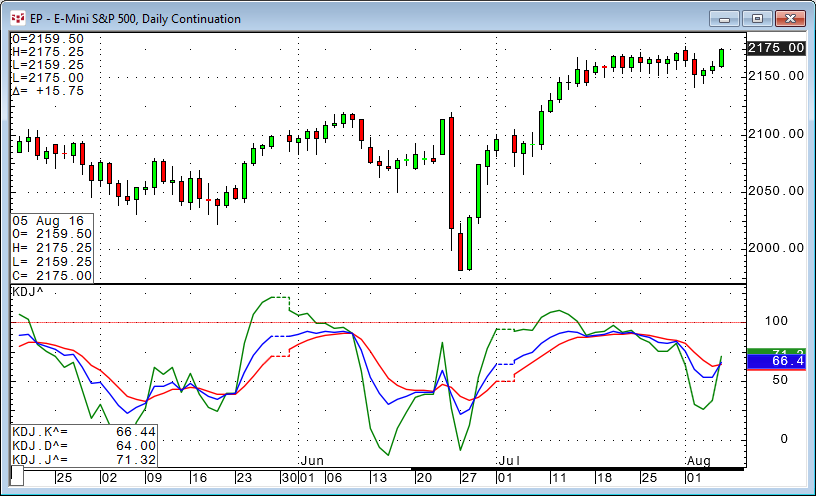
テクニカル・アナリティクスの最も一般的に使用される指標の一つであるKDJは,世界中のほとんどのトレーダーによって認識された.KDJの完全な名前は"ランダム・インディケーター"であり,商品先物市場で使用される非常に新鮮で実践的なテクニカル・アナリティクスの指標であった.また,株式や外国取引の短期トレンド分析でも広く使用された.
KDJは統計理論に基づいたもので,最近の9K線

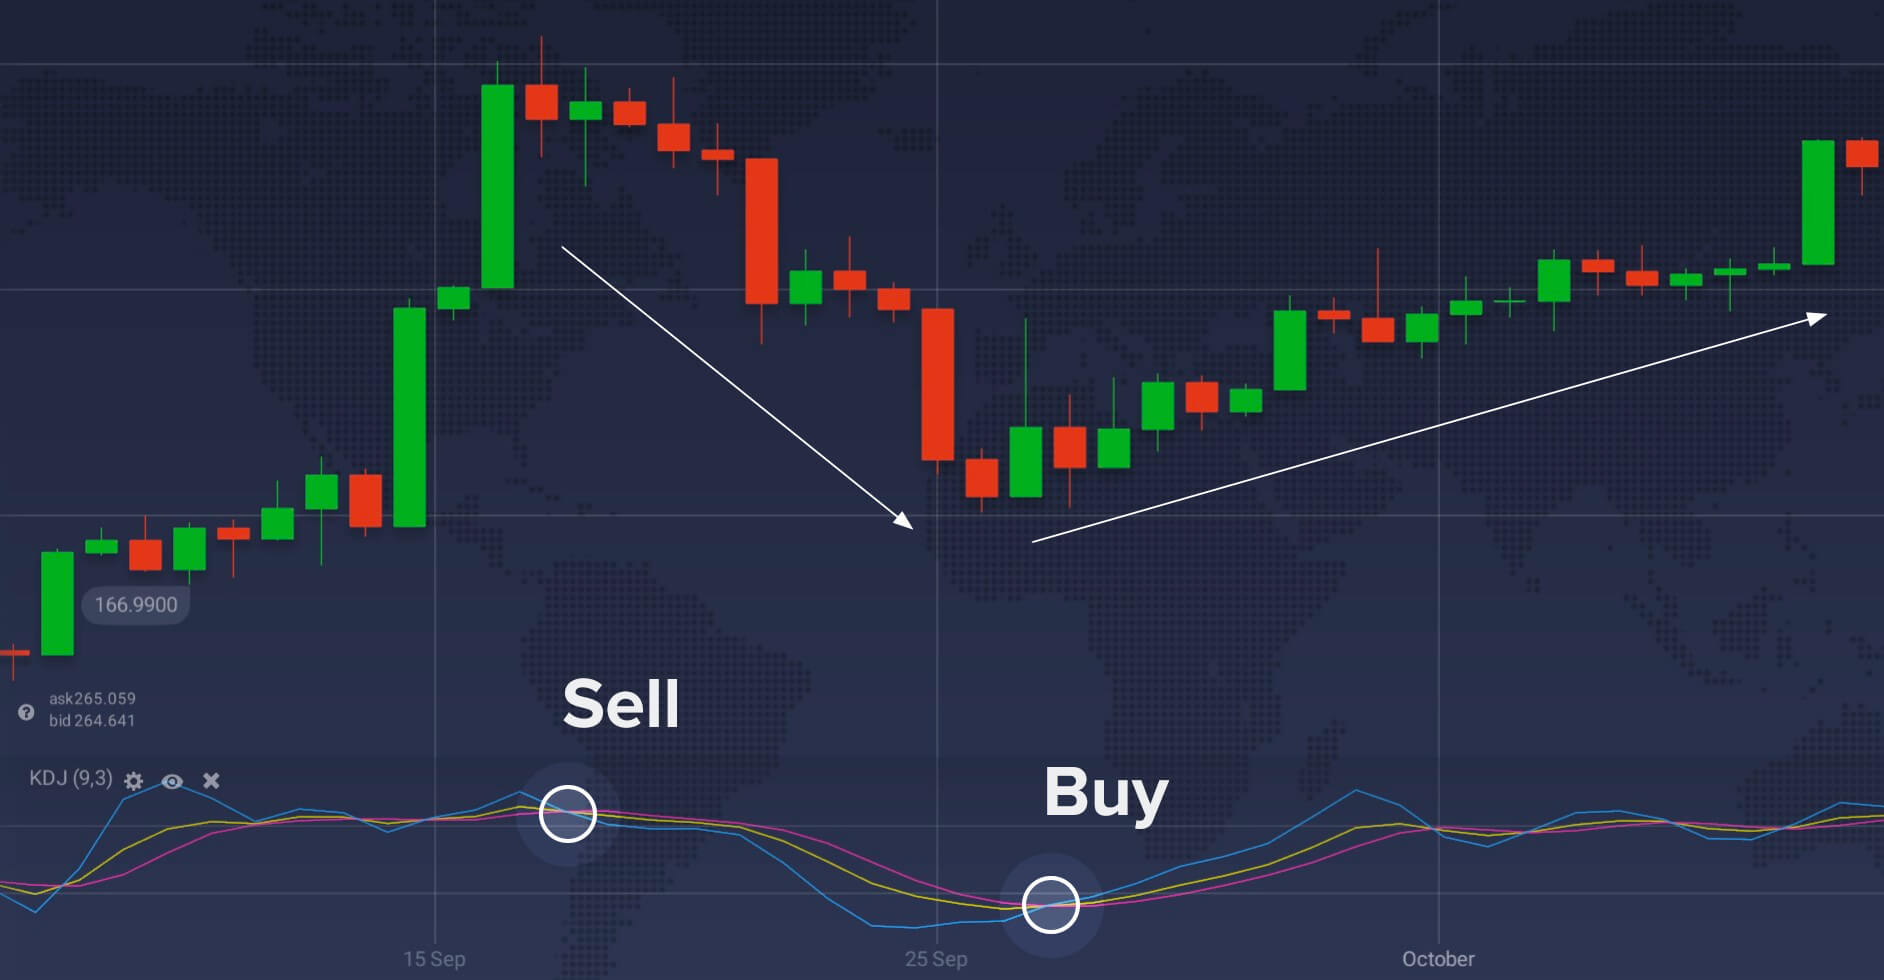
モメントコンセプト,強度指標,移動平均の利点を組み合わせることで,株価が通常の範囲の動きから変化する程度を測定する.K値がD値よりも大きいとき,株価が現在上昇傾向にあることを示します.したがって,K線がD線を下から上へと横切ると,株を買う時です.逆に,K値がD値よりも小さいとき,株式市場は現在下向きの傾向にあることを示します.したがって,K線がD線を上から下へと横切ると,株を売る時です.
KDJ指標の計算方法
KDJ指標の計算は複雑である.まずランダム値 (RSV) を計算し,その後K値,D値,J値を計算する.計算方法は以下のとおりである:
-
RSV = (終了価格 - N 期間の最低価格) / (N サイクルで最も高い価格 - N サイクル最も低い価格) * 100
-
K 値 = N サイクル RSV の平均値
-
D 値 = N サイクル K の平均値
-
J値 = 3 * K値 -2 * D値
void main(){ // the program starts from this main function
    while (true){ // enter the loop
        auto ct = exchange.SetContractType(symblo); //set the contract type
        auto r = exchange.GetRecords(); // get the K line array
        auto arr = TA.KDJ(r, 9, 3, 3); // calculate the KDJ indicator
        auto k = arr[0]arr[0].size() - 2]; // get the previous k line KDJ indicator K value
        auto d = arr[1]arr[1].size() - 2]; // get the previous k line KDJ indicator D value
        auto j = arr[2]arr[2].size() - 2]; // get the previous k line KDJ indicator J value
    }
}
戦略の論理
KDJを使用する方法はいくつかあり,単独または他の指標と組み合わせて使用できます. この記事では,最も簡単な方法で使用します. 例えば,K値がD値よりも大きい場合,購入力が強くなると考え,上昇する市場の波が形成され,オープンロングポジション信号が生成されます.

ポジションを開いた後,D値が上から下へと変化すると,買い力が弱まるか,売り力が強まるかと考え,ロングポジションを閉じる信号が生成されます.ショートポジションを開いた場合,D値が下から上へと変化すると,売り力の強さが弱まるか,買い力が強まるかと考え,ショートポジションを閉じる信号が生成されます.
取引条件
-
オープン・ロング・ポジション: ポジションがない場合,K値はD値より大きい
-
ショートポジション: ポジションがない場合,K値はD値より小さい場合
-
ロングポジションを閉じる: ロングポジションを保持している場合,D値が前面K線のD値より小さい場合
-
閉じるショートポジション: ショートポジションを保持し,D値が先行線KのD値より大きい場合
戦略コードの実施
まず,どのデータが必要か,どのAPIで入手するか,データを入手した後,取引ロジックをどのように計算するか,次に,注文をどの方法で配置するか,最後に,ステップ・バイ・ステップで実装しましょう.
ステップ1: 戦略アーキテクチャと取引クラスライブラリを使用
戦略アーキテクチャと呼ばれるものは,戦略全体を設計する方法です. 以下のように,アーキテクチャは2つの機能で構成されています. 1つはメイン機能で,プログラムはメイン機能からスタートし,その機能は戦略論理の核心に対処することです. 交換との接続が問題ないかどうかを判断し,不要なログ情報をフィルタリングし,戦略論理コアの実行時間間隔を制御します. もう1つはオンティック機能です. この機能では,主に戦略論理です.
bool onTick(){  // onTick function
    // strategy logic
}

void main(){ // program starts from here
    while (true){  // enter the loop
        if (exchange.IO("status") == 0) // if the connection with the exchange if not stable.
            sleep(1000); // pause for 1 second
            continue; // skip this loop, enter the next loop
        }
        if(!onTick()){ // if the connection with the exchange is stable, enter this if loop, start executing the onTick function
            sleep(1000); // pause for 1 second
        }
    }
}
上記のコードは,FMZ Quant プラットフォームツールによって作成された C++ 戦略フレームワークです.これは固定コード形式で,すべての取引論理は 2 行から開始され,他の場所では変更はありません.また,あなたがベテランであれば,あなたのニーズに応じて機能を追加または修正することができます.
トレーディングクラスのライブラリを機能的なモジュールとして考えることができます. トレーディングクラスのライブラリを使用するメリットは,戦略ロジックを書くことに集中することを可能にすることです. 例えば,取引クラスのライブラリを使用すると,ポジションを開くまたは閉じるには,取引クラスのライブラリ内のAPIインターフェースを直接使用できます. しかし,取引クラスのライブラリを使用しない場合は,ポジションを開くときに市場価格を取得する必要があります. 実行されていないオーダーの問題や引き出すオーダーの問題などを検討する必要があります.
ステップ2:あらゆる種類のデータを取得
取引論理の重要な部分として,様々な原始データがあります. どのようなデータが必要ですか? 戦略取引論理から,まずK線データを入手する必要があります. 元のK線データを使用して,KDJ指標を計算し,最後にK値とD値の関係を比較して,注文を入れるかどうかを判断します. では,これらのデータを取得しましょう.
- K線データを取得
KDJインジケーターを計算するために使用されます. 次のように:
double position = 0; // position status parameter, the default is 0

bool onTick(string symbol){ // onTick function, all strategy logic are in this function
    auto ct = exchange.SetContractType(symbol); // set the contract type and trading variety
    if(ct == false){ // if the setting contract type and trading variety is not successful
        return false; // return false
    }
    auto r = exchange.GetRecords(); // get the k-line array
    if(!r.Valid || r.size() < 10){ // if getting the k-line array or the number of k-line is less than 10
        return false; // return false
    }
}

void main(){ // program starts from here
    while (true){  // enter the loop
        if (exchange.IO("status") == 0) // if the connection with the exchange if not stable.
            sleep(1000); // pause for 1 second
            continue; // skip this loop, enter the next loop
        }
        if(!onTick("this_week")){ // if the connection with the exchange is stable, enter this if loop, start executing the onTick function
            sleep(1000); // pause for 1 second
        }
    }
}
上記のように:
行1: ポジションステータスを受信するために使用される変数を定義します.
線 3 から 12: onTick 関数は定義され,この関数はパラメータを運びます.このパラメータは,この場合,週間のk線を使用して,取引の範囲に転送されます.
ライン 14 から 24: 戦略以外の論理を処理するメイン関数を定義します.変更できる唯一のものは20 行の契約コード"this_week"です.これは固定形式なので,他の場所では変更する必要はありません.
K線データをどのように取得するかを見てみましょう:
行4〜7: 契約の種類と取引の種類を設定します. 契約の種類と取引の種類を設定しても成功しない場合は, false を返します.
固定形式のK線配列を入手します
線9から11まで: K線の長さをフィルタリングします. K線が10未満なら,直接 false を返し,次のK線を待つだけです. 線が9未満の場合は,K線の長さをフィルタリングします.
- KDJ指標,K値とD値を取得
次に,KDJ指標のKとD値を計算する必要があります.まず,KDJ指標の配列を取得し,この配列からK値とD値を取得する必要があります. FMZ Quantプラットフォームでは,KDJの配列を取得することは非常に簡単です.
2次元の配列は簡単に理解できます. これは配列の配列です. 配列の順序は次のとおりです. まず配列内の指定配列を取得し,次に下記のように指定配列から指定された要素を取得します.
#include <iostream>
using namespace std;

int main(){
    int hour [3][2] = {{100, 50}, {66, 88}, {10, 90}};
    cout << hours[0][0]; // get the hours array first elements of first element, the result is 100
    cout << hours[0][1]; // get the hours array first elements of second element, the result is 50
    cout << hours[1][0]; // get the hours array second elements of first element, the result is 66
    return(0);
}
次の図のように,第12行はFMZ QuantのAPIを直接用いて,二次元配列であるKDJ指標の配列を得ます:arr = [[K値,K値,K値...], [D値,D値,D値...], [J値,J値,J値...]]
列13は,前のK列のk値を取得し,K値はarr[0],その後arr[0],arr[0].size() から前最後の要素を取得します.この方法はarr[0],arr[0].size() - 2の配列の長さを取得するために使用できます.
double position = 0; // position status parameter, the default is 0

bool onTick(string symbol){ // onTick function, all strategy logic are in this function
    auto ct = exchange.SetContractType(symbol); // set the contract type and trading variety
    if(ct == false){ // if the setting contract type and trading variety is not successful
        return false; // return false
    }
    auto r = exchange.GetRecords(); // get the k-line array
    if(!r.Valid || r.size() < 10){ // if getting the k-line array or the number of k-line is less than 10
        return false; // return false
    }
    auto arr = TA.KDJ(r, 9, 3, 3); // calculate the KDJ indicator
    auto k = arr[0][arr[0].size() - 2]; // get the K value of the previous K line
    auto d = arr[1][arr[1].size() - 2]; // get the D value of the previous K line
    auto dPre = arr[1][arr[1].size() - 3]; // get the D value of the second last of the K line
}

void main(){ // program starts from here
    while (true){  // enter the loop
        if (exchange.IO("status") == 0) // if the connection with the exchange if not stable.
            sleep(1000); // pause for 1 second
            continue; // skip this loop, enter the next loop
        }
        if(!onTick("this_week")){ // if the connection with the exchange is stable, enter this if loop, start executing the onTick function
            sleep(1000); // pause for 1 second
        }
    }
}
ステップ 3: 注文 を 出す
上記のデータで,現在,取引論理と注文の配置を書き込むことができます. また,非常にシンプルで,最も一般的に使用されているのは,条件1と条件2が本当なら,注文を;条件3または条件4が本当なら,注文をします. 下記のとおり:
double position = 0; // position status parameter, the default is 0

bool onTick(string symbol){ // onTick function, all strategy logic are in this function
    auto ct = exchange.SetContractType(symbol); // set the contract type and trading variety
    if(ct == false){ // if the setting contract type and trading variety is not successful
        return false; // return false
    }
    auto r = exchange.GetRecords(); // get the k-line array
    if(!r.Valid || r.size() < 10){ // if getting the k-line array or the number of k-line is less than 10
        return false; // return false
    }
    auto arr = TA.KDJ(r, 9, 3, 3); // calculate the KDJ indicator
    auto k = arr[0][arr[0].size() - 2]; // get the K value of the previous K line
    auto d = arr[1][arr[1].size() - 2]; // get the D value of the previous K line
    auto dPre = arr[1][arr[1].size() - 3]; // get the D value of the second last of the K line
    string action; // define a string variable action
    // if currently holding long position, and the previous K line's D value is less than the second last k line's D value, close all position
    // if currently holding short position, and the previous K line's D value is greater than the second last k line's D value, close all position
    if((d < dPre && position > 0) || (d > dPre && position <0)){
        action = "cover";
    }else if (k > d && position <= 0){ // if the previous K line's K value is greater than the previous K line's D value, and there are no long positions
        action = "buy"; // set the variable action to "buy"
    }else if (k < d && position >= 0){ // if the previous K line's K value is less than the previous K line's D value, and there are no short positions
        action = "sell"; // set the variable action to "sell"
    }
    if (action.size() > 0){ // if there are placing order instruction
        position = ext::Trade(action, symbol, 1); // calling the C++ trading class library, placing orders according the direction of variable "action". and also renew the position status.
    }
    return true; // return true
    }
}

void main(){ // program starts from here
    while (true){  // enter the loop
        if (exchange.IO("status") == 0) // if the connection with the exchange if not stable.
            sleep(1000); // pause for 1 second
            continue; // skip this loop, enter the next loop
        }
        if(!onTick("this_week")){ // if the connection with the exchange is stable, enter this if loop, start executing the onTick function
            sleep(1000); // pause for 1 second
        }
    }
}
上記のコードでは,行19から28は取引論理と注文の配置のためのコードです. しかし,これの前に,私たちは行16に文字列変数"アクション"を定義する必要があります. これは注文のアクションを決定するのに役立ちます.
19行から21行は,現在ロングポジションを保持している場合,前のK行
ライン21からライン25は:ロングとショートポジションを開設する条件です.条件が真であるとき,
ライン26からライン28は,プレッシングオーダーロジックを実行している.まず,文字列変数
2つの箇所があります.
-
現在のK線条件が確立されたときに戦略論理を書いて,次に次のk線に注文を置く.または以前のk線条件が確立され,現在のk線に注文を置く.この方法で,バックテストの結果と実際の市場パフォーマンスはあまり異なります.このように書くことは問題ありませんが,戦略論理が正しいかどうかを注意してください.
-
一般的に,閉店ポジションの論理は開店ポジションの論理の前で書くべきです.この目的は,戦略論理があなたの期待に応えるようにすることです.例えば,戦略論理がちょうどポジションを閉じる後に逆の方向での取引を行う必要がある状況を満たす場合,この種の状況のルールは,まずポジションを閉じて新しいポジションを開くことです.開店ポジションの論理の前で閉店ポジションの論理を書くと,このルールを完璧に満たします.
結論から言うと
上記では,KDJの技術指標を分析し,それを完全な定量的な取引戦略に変換する方法について学びました.戦略導入,KDJ指標計算方法,戦略論理,取引条件,戦略コード実装など.この戦略ケースを通じて,FMZ Quantプラットフォーム上のC++プログラミング方法だけでなく,このセクションのケースに応じて異なる戦略も適応できます.
定量的な取引戦略を達成するには,自分の主観的な取引経験やシステムを要約し,次に必要な原始データを別々に取得し,戦略論理に必要なデータを計算し,最終的に取引を実現するために注文の配置APIを呼び出すことです. 単純な定量的な取引戦略の大半は,これらのステップに従って実装されていると言えます!
次のセクションの通知
今のところ,このシリーズの戦略執筆チュートリアルが終わりました.ここまで案内するステップバイステップチュートリアルに従えば,多くのことを得ると信じています. いずれにせよ,定量取引の基本コースの観点から,長い道は半分以上経ちました. 最後の章では,FMZ Quant バックテストのトレードツールを使用する方法,およびバックテストの穴を回避し,実際の市場取引のための最終準備を行う方法を教えます. コンテンツの小さな部分であるにもかかわらず,定量取引の世界に入るために大きな一歩です!
放課後 運動
-
FMZ Quant プラットフォーム上で C++ 言語を使用して KDJ インディケーター アルゴリズムを実装してみてください.
-
このセクションの知識を活用して CCI指標戦略を作成してみてください.
- FMZ Quant の新しい機能: _Serve 機能を使用して HTTP サービスを簡単に作成する
- 発明者による新機能の量化: _Serve関数を使用して簡単にHTTPサービスを作成する
- FMZ 量子取引プラットフォーム カスタム プロトコル アクセスガイド
- FMZ 資金調達の利子獲得と監視戦略
- FMZの資金調達・監視戦略
- WebSocket Market をシームレスに利用できるようにする戦略テンプレート
- ウェブソケットをシームレスに使える ポリシーテンプレート
- 発明者定量化取引プラットフォームの通用プロトコルへのアクセスガイド
- FMZのアップグレード後に迅速にユニバーサルマルチ通貨取引戦略を構築する方法
- FMZのアップグレード後,一般的な多通貨取引戦略を迅速に構築する方法
- DCA トレーディング:広く使われている数値戦略