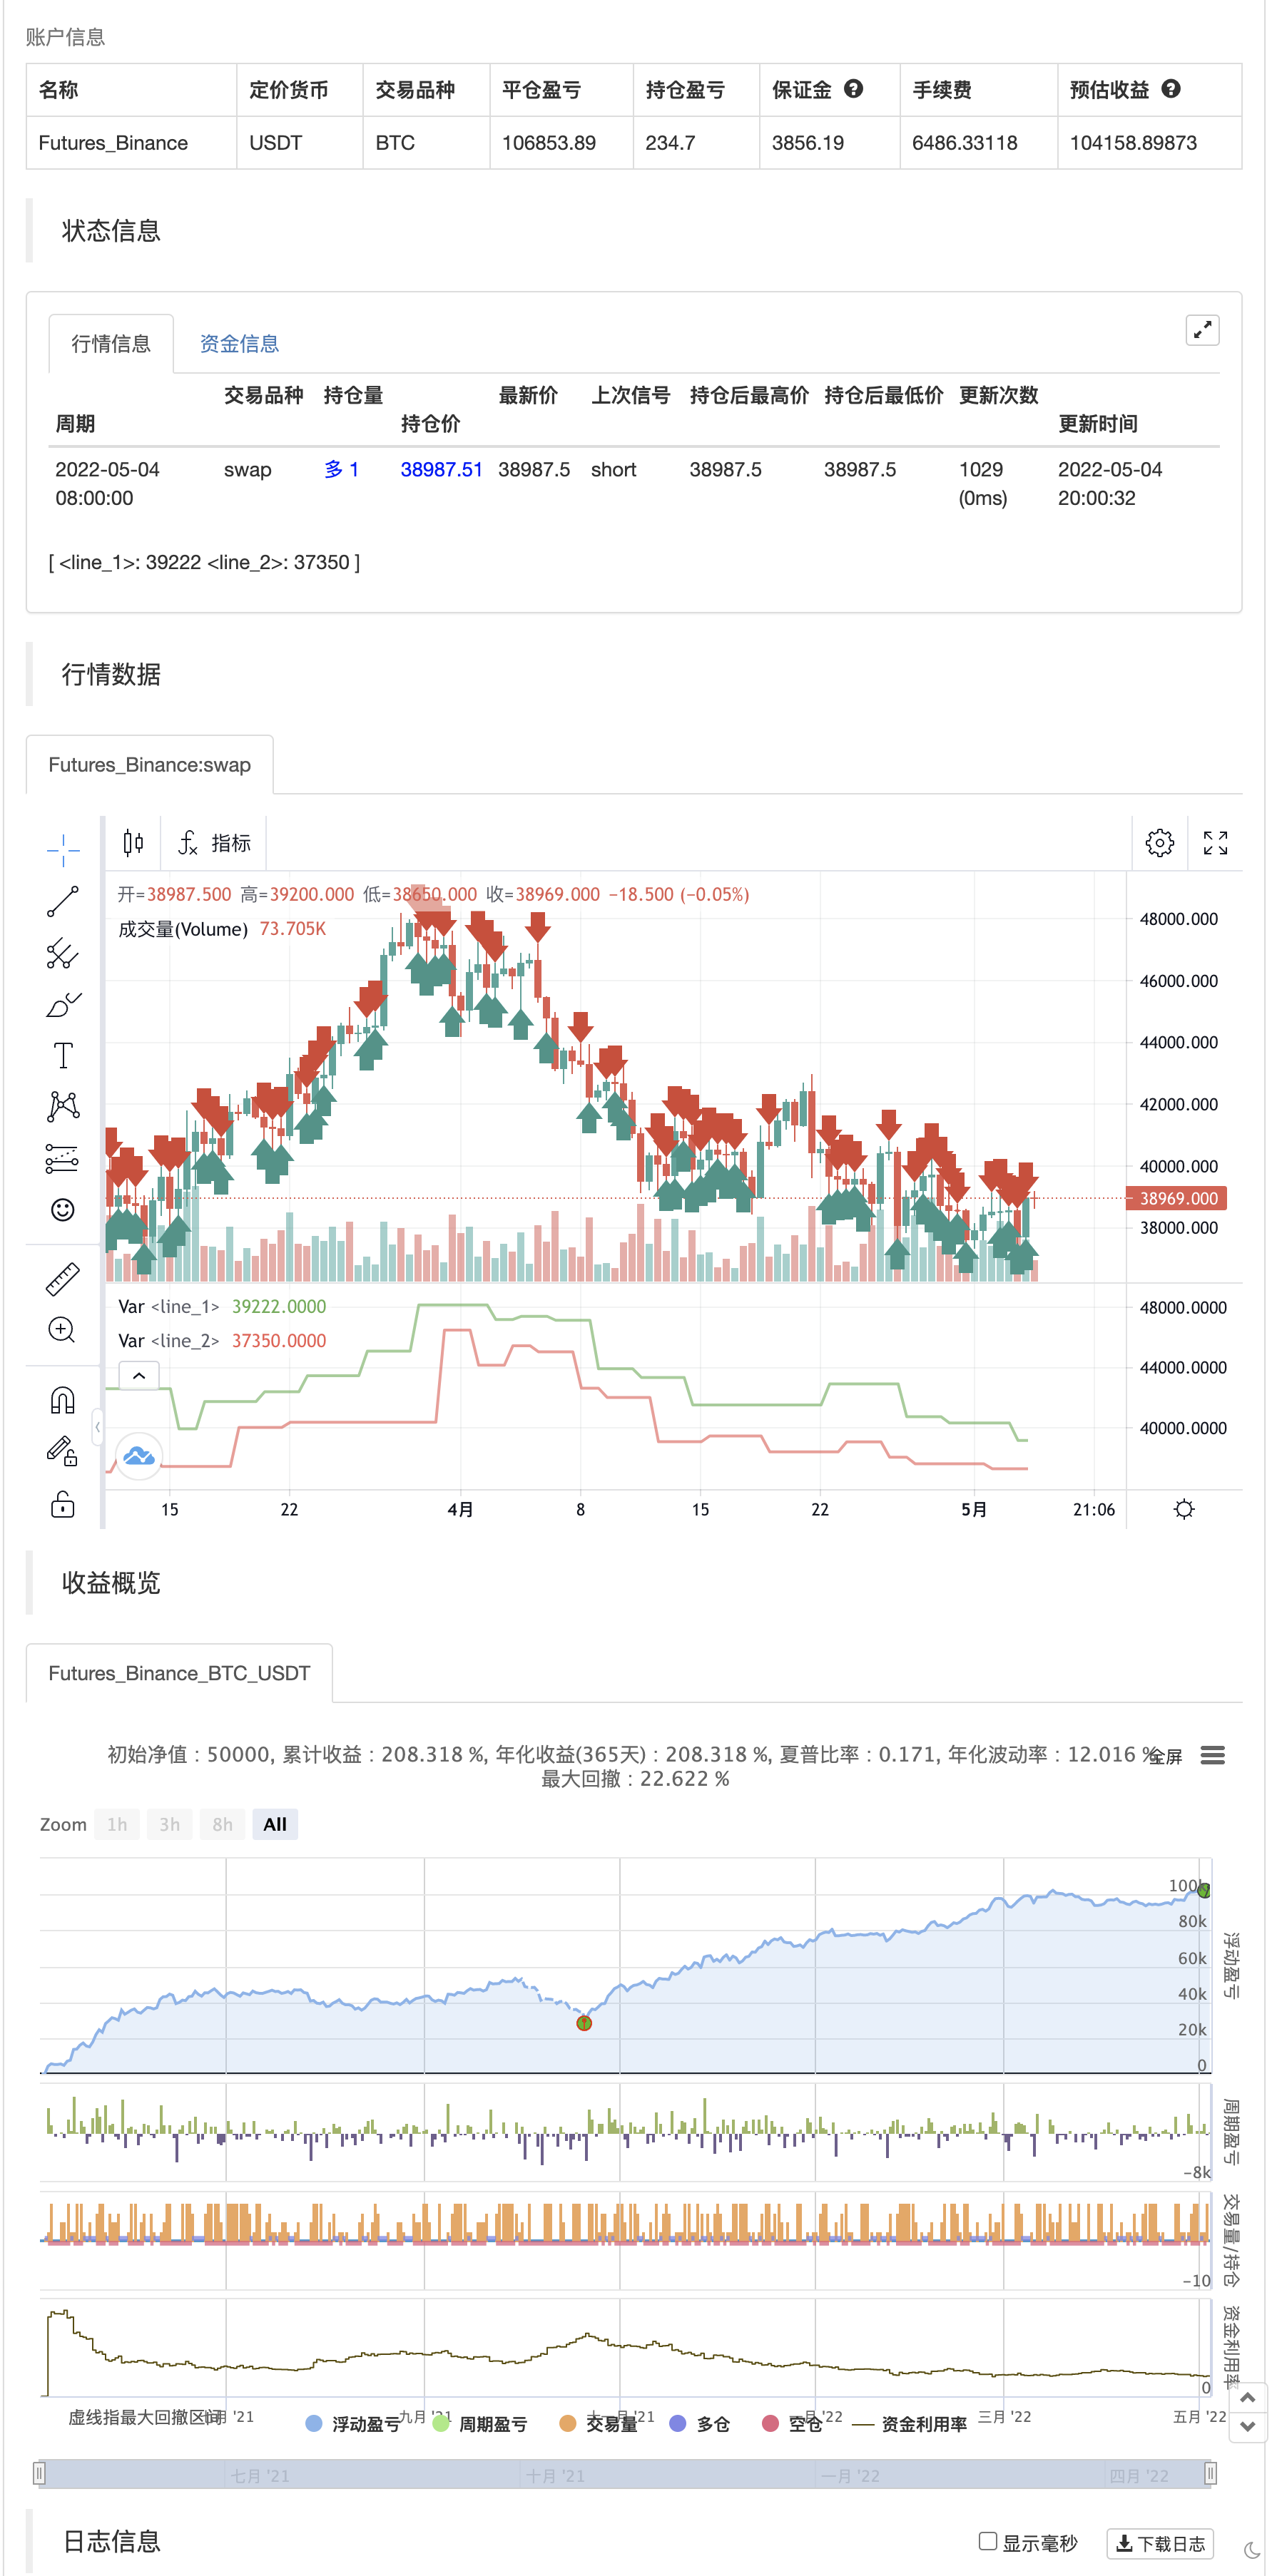
パインスクリプト戦略における月間リターン
作者: リン・ハーンチャオチャン, 日時: 2022-05-06 23:19:37タグ:ポイント
TradingViewから受け取る戦略パフォーマンス出力に100%満足していない. 標準では利用できないものをよく見たい. 通常は TradingViewから生取引/メトリックをエクスポートし,手動で追加の分析を行います. しかし,テーブルを使うと, 戦略のための追加指標やツールが簡単に作れます.
このスクリプトは,あなたのスクリプトの月間/年次パフォーマンスのテーブルを示します. 多くのトレーダー/投資家は,このようなリターンを調べていました. また,あなたの戦略が期待以上に良い/悪いパフォーマンスをした時期を特定し,それをよりよく分析しようとします. 自分の戦略に 簡単に応用できると信じています
免責事項 過去の業績が将来の成果を 示すものではないことを 忘れないでください 市場状況の変化を含む様々な要因により,戦略は過去のバックテストでうまく機能しなくなる可能性があります. この記事と脚本は 財務上のアドバイスではありません
復習する

/*backtest
start: 2021-05-05 00:00:00
end: 2022-05-04 23:59:00
period: 12h
basePeriod: 15m
exchanges: [{"eid":"Futures_Binance","currency":"BTC_USDT"}]
*/

//@version=4
//strategy("Monthly Returns in PineScript Strategies", overlay = true, default_qty_type = strategy.percent_of_equity, default_qty_value = 25, calc_on_every_tick = true, commission_type = strategy.commission.percent, commission_value = 0.1)

// Inputs
leftBars  = input(2,"leftBars")
rightBars = input(2,"rightBars")
prec      = input(2, title = "Return Precision")

// Pivot Points
swh = pivothigh(leftBars, rightBars)
swl = pivotlow(leftBars, rightBars)

hprice = 0.0
hprice := not na(swh) ? swh : hprice[1]

lprice = 0.0
lprice := not na(swl) ? swl : lprice[1]

le = false
le := not na(swh) ? true : (le[1] and high > hprice ? false : le[1])

se = false
se := not na(swl) ? true : (se[1] and low < lprice ? false : se[1])

if (le)
	strategy.entry("PivRevLE", strategy.long, comment="PivRevLE")

if (se)
	strategy.entry("PivRevSE", strategy.short, comment="PivRevSE")

plot(hprice, color = color.green, linewidth = 2)
plot(lprice, color = color.red,   linewidth = 2)
関連コンテンツ
- フィルター波パターンとウィリアム指標を組み合わせたマルチタイムサイクル取引戦略
- ダイナミック・サポート・レジスタンスとブリン・バンド・マルチ指標・クロス戦略
- ダイナミックサポートレジスタンス軸は量化取引戦略に適応する
- RSI 差異指標
- ポイントトレンド
- 量差
- ピボットベース トレイリング マキシマ・ミニマ
- ピボットポイント スーパートレンド
- ピボットポイント 高低 多時間枠
- ビラ・ダイナミック・ピボット・スーパートレンド戦略
- ピボット順序ブロック
もっと見る
- 飲み込める ろうそく
- MA 皇帝 インシリコノット
- デマルクの逆転点
- スイング・ハイス/ローズ&キャンドル・パターン
- TMA オーバーレイ
- MACD + SMA 200 戦略
- CM スリングショットシステム
- ボリンガー+RSI,ダブル戦略 v1.1
- ボリンジャー・バンド戦略
- オプティマイズされたトレンドトラッカー
- v4 の ADX と DI
- MacD カスタム インディケーター - 多重タイムフレーム+すべてのオプション!
- インディケーター: WaveTrend オシレーター
- 圧縮モメント インディケーター
- アルファトレンド
- 周期間均線取引
- 感情オシレーター
- コイン・アンドロはコイン対で取引し,現金で市場価格の清算に使用される.
- 海岸取引法
- トレンドにしよう