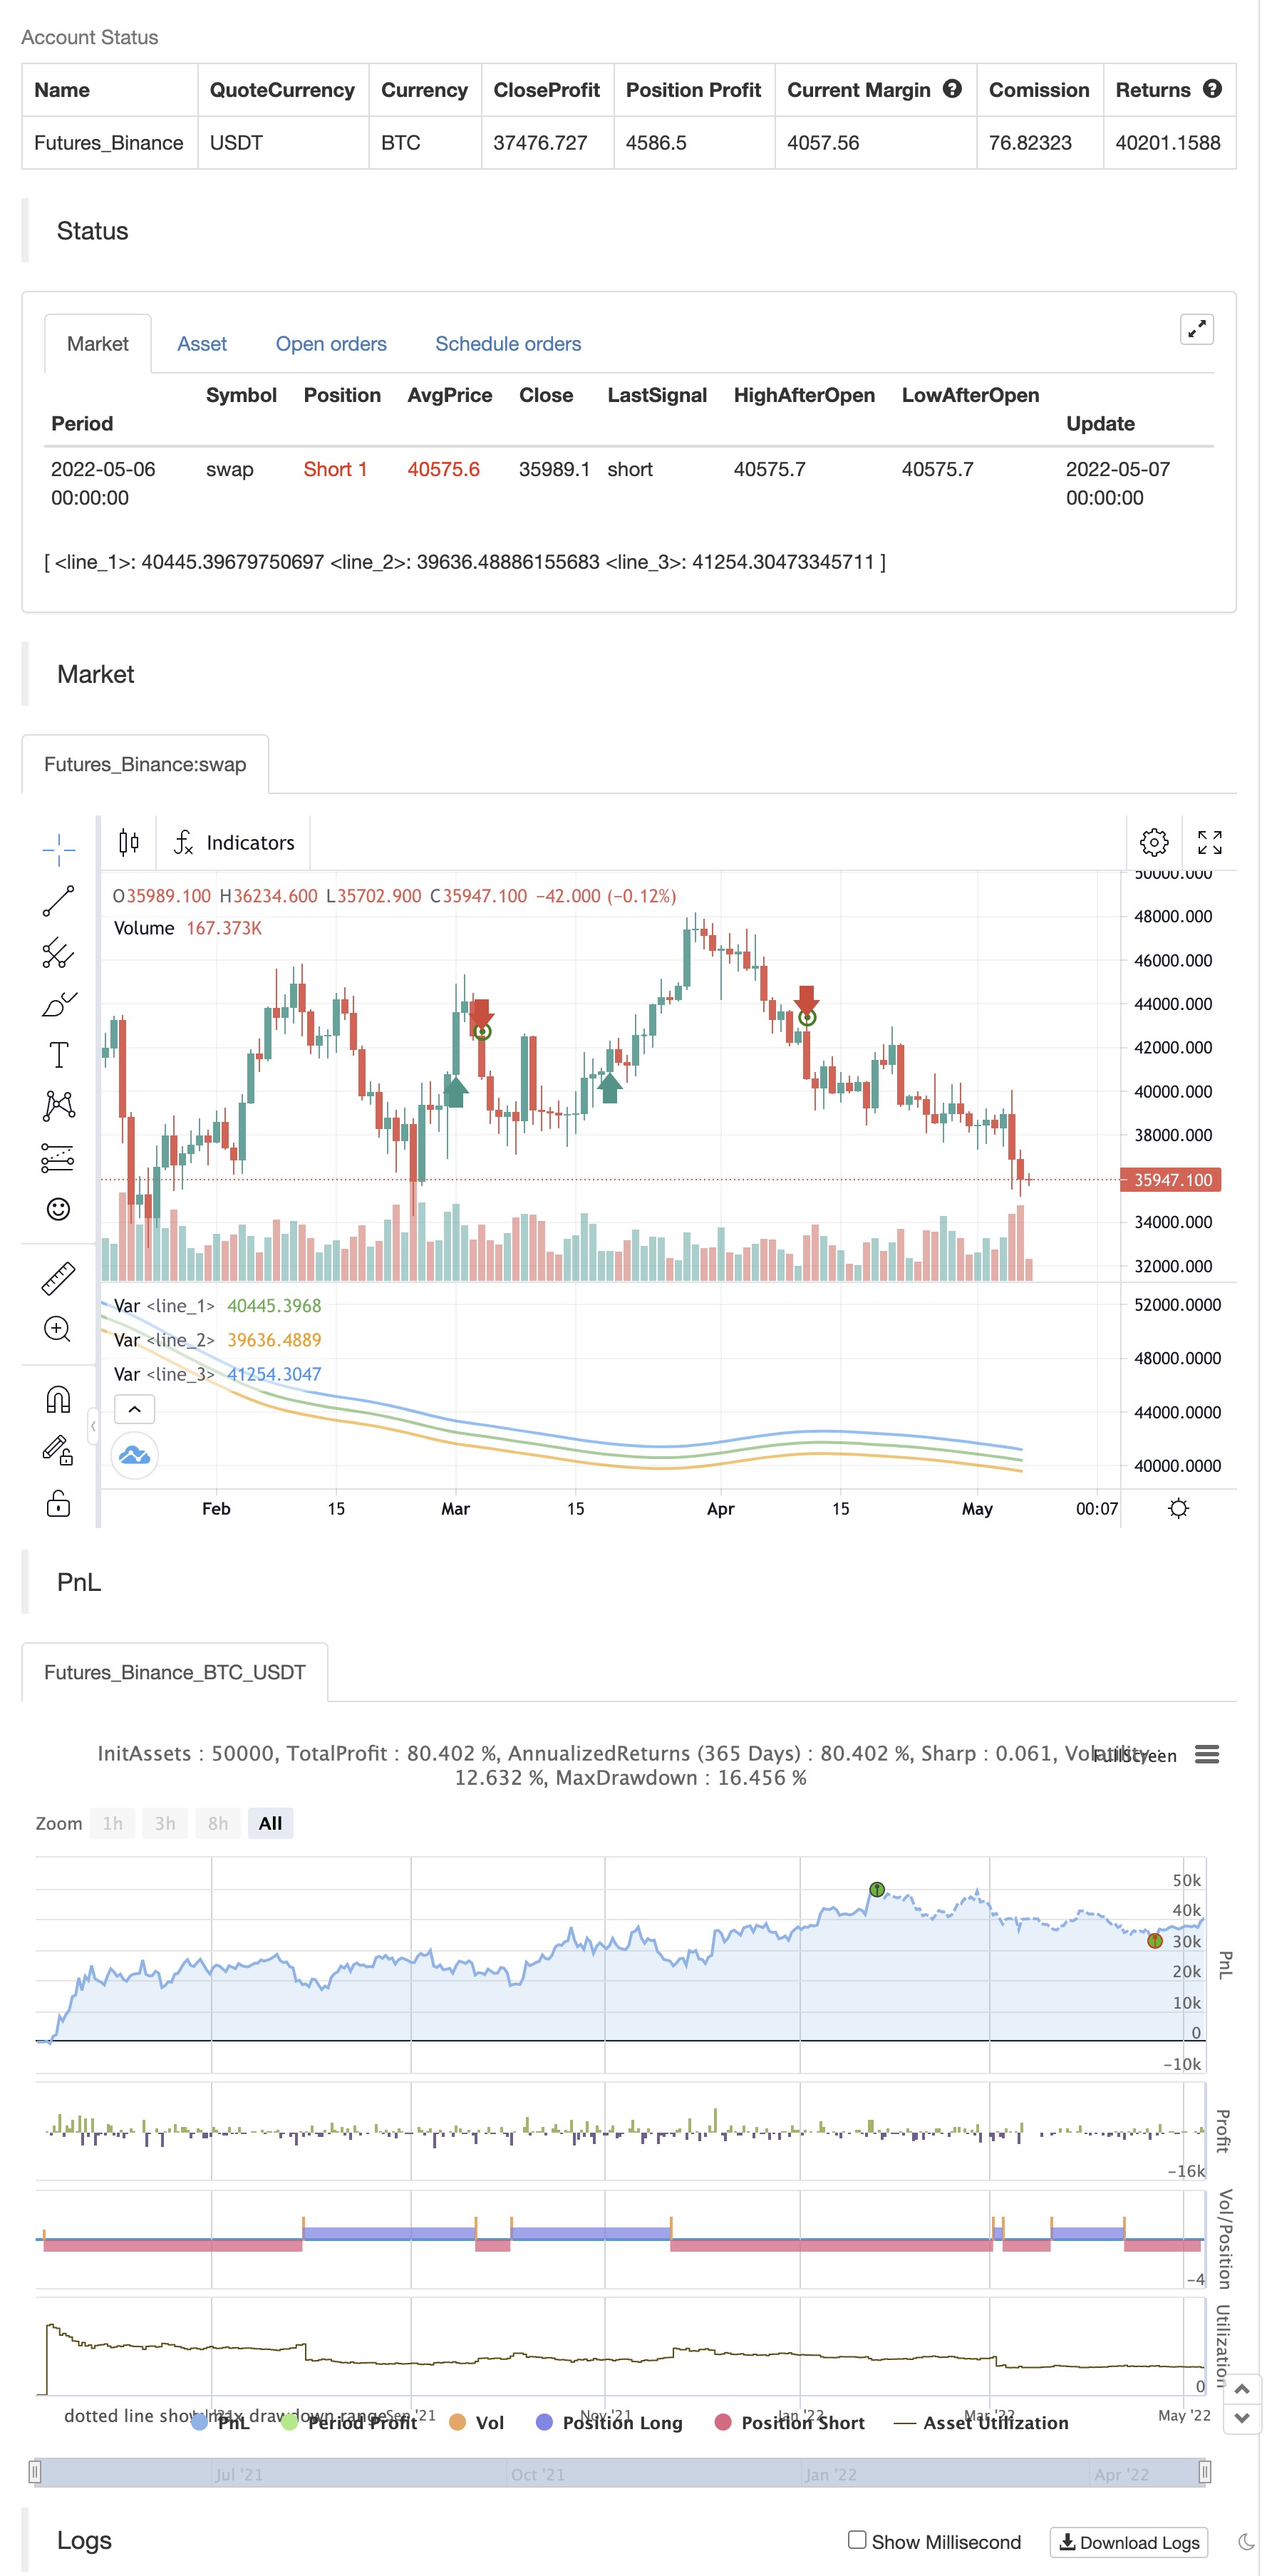
EHMAの範囲戦略
作者: リン・ハーンチャオチャン, 日時: 2022-05-09 23:31:59タグ:EHMA
このスクリプトは @borserman
EHMAに加えて,このスクリプトはEHMAの周りの範囲 (変更可能) で動作し,偽の信号に対して強固であるように試みます.多くの場合,バーは移動平均以下に閉じて,次のバーを再び逆転させ,あなたの利益を食い尽くします.特に短いタイムフレームでも,また揺らぐ長いタイムフレームでも,これは戦略を使用するのが魅力的ではありません.
EHMAの範囲の周りに,戦略は,バーが上限を超えた場合のみロング/エグジットショートポジションに入ります.逆に,バーが下限を超えた場合のみショート/エグジットロングポジションに入ります.これは,バーがEHMA範囲内で動揺している場合のみポジションを回避し,市場がその方向に自信を持っている場合にのみポジションに入ります.しかし,偽造は依然として可能ですが,あまり頻繁ではありません.この戦略を通常のEHMA戦略と比較してバックテストして (およびさまざまな設定を実験して),このバージョンははるかに堅牢で利益のあるようです!
免責事項 過去の業績が将来の成果を 示すものではないことを 忘れないでください 市場状況の変化を含む様々な要因により,戦略は過去のバックテストのパフォーマンスほど良くないかもしれません. この記事と脚本は 財務上のアドバイスではありません
バックテスト

/*backtest
start: 2021-05-08 00:00:00
end: 2022-05-07 23:59:00
period: 1d
basePeriod: 1h
exchanges: [{"eid":"Futures_Binance","currency":"BTC_USDT"}]
*/

// Credit is due where credit is due:
// Hull Moving Average: developed by Alan Hull
// EHMA: coded by Twitter @borserman
// I've built on their work in an attempt to create a strategy more robust to fake moves
// @0xLetoII

//@version=4
//strategy(
//  title="EHMA Range Strategy",
//  process_orders_on_close=true,
//  explicit_plot_zorder=true,
//  overlay=true,
//  initial_capital=1500,
//  default_qty_type=strategy.percent_of_equity,
//  commission_type=strategy.commission.percent,
//  commission_value=0.085,
//  default_qty_value=100
//  )


// Position Type
pos_type = input(defval = "Both", title="Position Type", options=["Both", "Long", "Short"])

// Inputs
Period = input(defval=180, title="Length")
RangeWidth = input(defval=0.02, step=0.01, title="Range Width")
sqrtPeriod = sqrt(Period)

// Function for the Borserman EMA
borserman_ema(x, y) =>
    alpha = 2 / (y + 1)
    sum = 0.0
    sum := alpha * x + (1 - alpha) * nz(sum[1])

// Calculate the Exponential Hull Moving Average
EHMA = borserman_ema(2 * borserman_ema(close, Period / 2) - borserman_ema(close, Period), sqrtPeriod)

// Create upper & lower bounds around the EHMA for broader entries & exits
upper = EHMA + (EHMA * RangeWidth)
lower = EHMA - (EHMA * RangeWidth)

// Plots
EHMAcolor = (close > EHMA ? color.green : color.red)
plot(EHMA, color=EHMAcolor, linewidth=2)
plot(lower, color=color.orange, linewidth=2)
plot(upper, color=color.blue, linewidth=2)


// Strategy
long = close > upper
exit_long = close < lower
short = close < lower
exit_short = close > upper


// Calculate start/end date and time condition
//startDate  = input(timestamp("2017-01-01T00:00:00"))
//finishDate = input(timestamp("2029-01-01T00:00:00"))

time_cond  = true


// Entries & Exits
if pos_type == "Both"
    strategy.entry("Long", strategy.long, comment="Long", when=long and time_cond)
    strategy.close("Long", comment="Exit Long", when=exit_long and time_cond)
    strategy.entry("Short", strategy.short, comment="Short", when=short and time_cond)
    strategy.close("Short", comment="Exit Short", when=exit_short and time_cond)
if pos_type == "Long"
    strategy.entry("Long", strategy.long, comment="Long", when=long and time_cond)
    strategy.close("Long", comment="Exit Long", when=exit_long and time_cond)
if pos_type == "Short"
    strategy.entry("Short", strategy.short, comment="Short", when=short and time_cond)
    strategy.close("Short", comment="Exit Short", when=exit_short and time_cond)
関連コンテンツ
もっと見る
- 角度攻撃 線をフォローする指示
- キジュンセン・ライン クロス
- AMACD - すべての移動平均の収束差
- MA ハイブリッド BY RAJ
- ダイヤモンド の 傾向
- ニク・ストック
- ストックスーパーTRD ATR 200MA
- MTF RSI & STOCH戦略
- EMA + AROON + ASH
- モメント 2.0
- 移動平均 買出 売出
- ミダス Mk.II - 究極の暗号スイング
- TMA-レガシー
- TVの高低戦略
- 最良のトレードビュー戦略
- 大型スナッパーの警告 R3.0 + 変動状態の上昇 + TP RSI
- チャンデ・クロル ストップ
- CCI + EMAとRSIクロス戦略
- EMA バンド + leledc + ボリンガー バンド トレンドキャッチ戦略
- RSI MTF Ob+Os