This is a script based on the original TMA- RSI Divergence indicator by PhoenixBinary. The Phoenix Binary community and the TMA community built this version to be public code for the community for further use and revision after the reported passing of Phoenix Binary (The community extends our condolences to Phoenix’s family.
The intended uses are the same as the original but some calculations are different and may not act or signal the same as the original.
Description of the indicator from original posting. This indicator was inspired by Arty and Christy .
█ COMPONENTS
Here is a brief overview of the indicator from the original posting:
1 — RSI Divergence Arty uses the RSI divergence as a tool to find entry points and possible reversals. He doesn’t use the traditional overbought/oversold. He uses a 50 line. This indicator includes a 50 line and a floating 50 line. The floating 50 line is a multi-timeframe smoothed moving average . Price is not linear, therefore, your 50 line shouldn’t be either. The RSI line is using a dynamic color algo that shows current control of the market as well as possible turning points in the market.
2 — Smoothed RSI Divergence The Smoothed RSI Divergence is a slower RSI with different calculations to smooth out the RSI line. This gives a different perspective of price action and more of a long term perspective of the trend. When crosses of the floating 50 line up with the traditional RSI crossing floating 50.
3 — Momentum Divergence This one will take a little bit of time to master. But, once you master this, and combined with the other two, damn these entries get downright lethal!
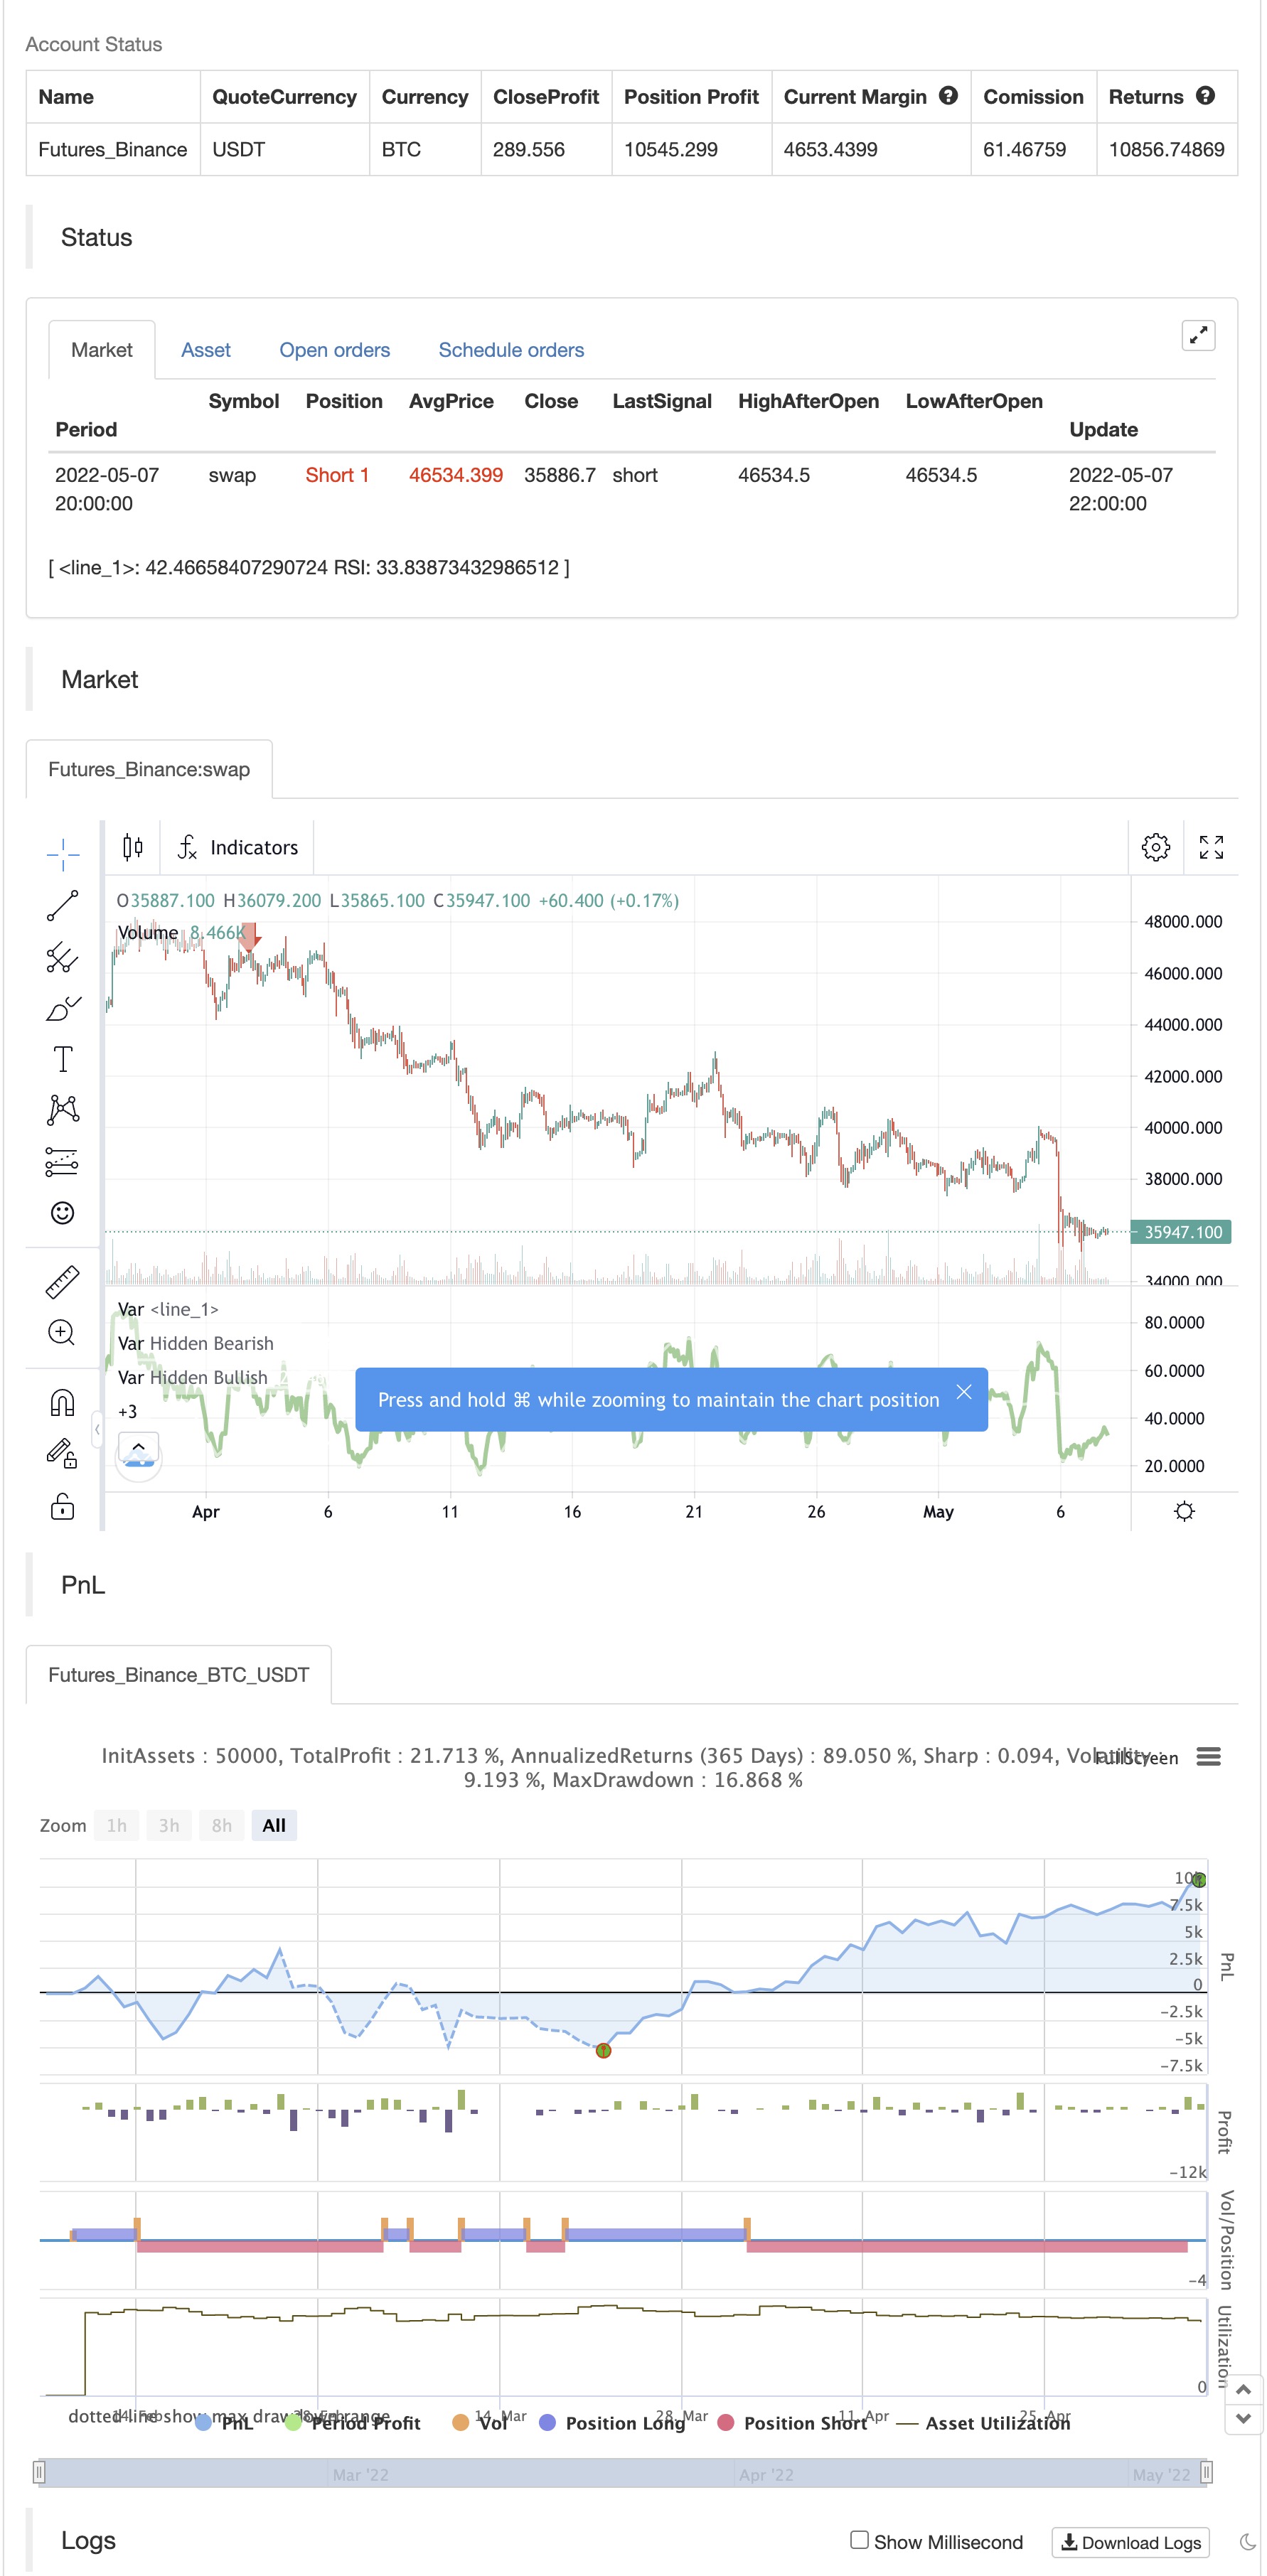
backtest
/*backtest
start: 2022-02-08 00:00:00
end: 2022-05-08 00:00:00
period: 2h
basePeriod: 15m
exchanges: [{"eid":"Futures_Binance","currency":"BTC_USDT"}]
*/

//// This source code is subject to the terms of the Mozilla Public License 2.0 at https://mozilla.org/MPL/2.0/
// ©Hotchachachaa, Rest in Peace Pheonix Algo(aka Doug) your community misses you and we extend our deepest sympathies to your family.
//@version=5
//
//This indicator is based on the TMA-Divergence indicator created by PhoenixBinary for the TMA discord Community. Since Phoenix is no longer part of the community
//we did our best to recreate the indicator for the community's continued use updates and revisions.
indicator("TMA-Legacy", overlay=false)

////////////////////////////////////inputs////////////////////////////////////////////////

displayRSI = input.string(title="RSI Type", defval="RSI Divergence", options=["RSI Divergence","RSI Smoothed","RSI Momentum"],group="Main Settings")
lenrsinordiv = input.int(title="RSI Normal Length", defval=14,minval=1, group= "RSI Normal")
lenrsismodiv = input.int(title="RSI Smoothed Length", defval=40, minval=1,group = "RSI Smoothed" )
lenrsissmoma = input.int(title="RSI Smoothed MA", defval=40,minval=1, group = "RSI Smoothed" )
lenrsimomdiv = input.int(title="RSI Normal Length", defval=5 ,minval=1, group = "RSI Momentum")
rsimommalen = input.int(34, minval=1, title="Smooth RSI MA Length",group="RSI Momentum")
srcrsidiv = input(title="RSI Source", defval=close, group="Main Settings")
lbR = input.int(title="Pivot Lookback Right", defval=5,minval=1,group="Divergence Spotter")
lbL = input.int(title="Pivot Lookback Left", defval=5,minval=1,group="Divergence Spotter")
rangeUpper = input.int(title="Max of Lookback Range", defval=60,minval=1,group="Divergence Spotter")
rangeLower = input.int(title="Min of Lookback Range", defval=5,minval=1,group="Divergence Spotter")
plotBull = input.bool(title="Plot Bullish", defval=true,group="Divergence Spotter")
plotHiddenBull = input.bool(title="Plot Hidden Bullish", defval=true,group="Divergence Spotter")
plotBear = input.bool(title="Plot Bearish", defval=true,group="Divergence Spotter")
plotHiddenBear = input.bool(title="Plot Hidden Bearish", defval=true,group="Divergence Spotter")
bearColorrsidiv = color.red
bullColorrsidiv = color.green
hiddenBullColor = color.new(color.green, 80)
hiddenBearColor = color.new(color.red, 80)
textColor = color.white
noneColor = color.new(color.white, 100)
lenDisplay= displayRSI == "RSI Divergence" ? lenrsinordiv: displayRSI == "RSI Smoothed" ? lenrsismodiv: na
rsiValue1 = ta.rsi(srcrsidiv, lenrsinordiv)

// ### Smoothed MA

averageSource = rsiValue1
typeofMA1 = "SMMA"
length_ma1 = 50
f_smma(averageSource, averageLength) =>
    smma = 0.0
    smma := na(smma[1]) ? ta.sma(averageSource, averageLength) : (smma[1] * (averageLength - 1) + averageSource) / averageLength
    smma

f_smwma(averageSource, averageLength) =>
    smwma = 0.0
    smwma := na(smwma[1]) ? ta.wma(averageSource, averageLength) : (smwma[1] * (averageLength - 1) + averageSource) / averageLength
    smwma

f_tma(averageSource, averageLength) =>
    ta.sma(ta.sma(averageSource, averageLength), averageLength)

f_dema(averageSource, averageLength) =>
    emaValue = ta.ema(averageSource, averageLength)
    2 * emaValue - ta.ema(emaValue, averageLength)

f_tema(averageSource, averageLength) =>
    ema1 = ta.ema(averageSource, averageLength)
    ema2 = ta.ema(ema1, averageLength)
    ema3 = ta.ema(ema2, averageLength)
    (3 * ema1) - (3 * ema2) + ema3

f_ma(smoothing, averageSource, averageLength) =>
	switch str.upper(smoothing)
        "SMA"  => ta.sma(averageSource, averageLength)
        "EMA"  => ta.ema(averageSource, averageLength)
        "WMA"  => ta.wma(averageSource, averageLength)
        "HMA"  => ta.hma(averageSource, averageLength)
        "RMA"  => ta.rma(averageSource, averageLength)
        "SWMA" => ta.swma(averageSource)
        "ALMA" => ta.alma(averageSource, averageLength, 0.85, 6)
        "VWMA" => ta.vwma(averageSource, averageLength)
        "VWAP" => ta.vwap(averageSource)
        "SMMA" =>  f_smma(averageSource, averageLength)
        "SMWMA" =>  f_smwma(averageSource, averageLength)
        "DEMA" => f_dema(averageSource, averageLength)
        "TEMA"=>  f_tema(averageSource, averageLength)
        => runtime.error("Moving average type '" + smoothing +
             "' not found!"), na


MA1 = f_ma(typeofMA1, averageSource, length_ma1)
showNormal=displayRSI=="RSI Divergence"
showSmoothed=displayRSI=="RSI Smoothed"
showMomentum = displayRSI =="RSI Momentum"
showAll= displayRSI=="All Three"
///////OB/OS lines

hline(showNormal or showSmoothed ? 80 :na, title="OverBought", linestyle=hline.style_dotted, linewidth=2)
hline(showNormal or showSmoothed ? 20 :na, title="OverSold", linestyle=hline.style_dotted, linewidth=2)
////////////////show normal

plot(showNormal? MA1 : na , linewidth=2, color=color.white)

var int colortoken=1

color1= color.green
color2 = color.yellow
color3 = color.orange
color4 = color.red

if rsiValue1>rsiValue1[1] and colortoken!=1
    colortoken:= colortoken[1] - 1

if rsiValue1<rsiValue1[1] and colortoken!=4
    colortoken:= colortoken[1] + 1

lineColor= colortoken == 1 ? color1: colortoken ==2 ? color2 : colortoken == 3 ? color3 : colortoken == 4 ? color4 :na

plot(showNormal? rsiValue1 : na, title="RSI", linewidth=3, color=lineColor)


////////////show smoothed
lensig = input.int(14, title="ADX Smoothing", minval=1, maxval=50)
len = input.int(14, minval=1, title="DI Length")
up = ta.change(high)
down = -ta.change(low)
plusDM = na(up) ? na : (up > down and up > 0 ? up : 0)
minusDM = na(down) ? na : (down > up and down > 0 ? down : 0)
trur = ta.rma(ta.tr, len)
plus = fixnan(100 * ta.rma(plusDM, len) / trur)
minus = fixnan(100 * ta.rma(minusDM, len) / trur)
sum = plus + minus
adx = 100 * ta.rma(math.abs(plus - minus) / (sum == 0 ? 1 : sum), lensig)
rsisrc = ta.rsi(close,lenrsismodiv)
adxthreshold=input.int(title="adx",defval=15)
smoothColor= adx>adxthreshold and plus>minus? color.green:adx>adxthreshold and plus<minus?color.red : adx<adxthreshold?color.gray:na

rsismma = 0.0
rsismma := na(rsismma[1]) ? ta.sma(rsisrc, lenrsissmoma) : (rsismma[1] * (lenrsissmoma - 1) + rsisrc) / lenrsissmoma
rsiwsmma= ta.wma(rsismma,lenrsissmoma)
plot(showSmoothed ? rsisrc:na, linewidth=2, color=smoothColor)
plot(showSmoothed ? rsiwsmma:na, linewidth=2, color=color.white)


////////////////RSI momentum
///////////////////// normal RSI
rsiValue2 = ta.rsi(ohlc4,lenrsimomdiv)
rsiema = ta.wma(rsiValue2,rsimommalen)
normalizedRSI= (rsiValue2-50)/100

/////////////////// Normal Momentum
lenmom = input.int(5, minval=1, title=" MOM Length",group= "RSI Momentum")
srcmom = ohlc4
mom = srcmom - srcmom[lenmom]

//////////stochRSI K line
smoothK = input.int(5, "K", minval=1)
lengthRSI = input.int(5, "RSI Length", minval=1, group="RSI Momentum")
lengthStoch = input.int(34, "Stochastic Length", minval=1,group= "RSI Momentum")
src = input(ohlc4, title="RSI Source",group= "RSI Momentum")
rsi1 = ta.rsi(src, lengthRSI)
k = ((ta.sma(ta.stoch(rsi1, rsi1, rsi1, lengthStoch), smoothK))-50)/100

WTF=math.avg(mom,normalizedRSI,k)
smmaLen = input.int(25, minval=1, title="SMMA Length", group = "RSI Momentum")
smmaLen1= 2
smmaSrc = WTF
WTFsmma = 0.0
WTFsmma := na(WTFsmma[1]) ? ta.sma(smmaSrc, smmaLen1) : (WTFsmma[1] * (smmaLen1 - 1) + smmaSrc) / smmaLen1
smma = 0.0
smma := na(smma[1]) ? ta.sma(smmaSrc, smmaLen) : (smma[1] * (smmaLen - 1) + smmaSrc) / smmaLen


color1a= #0E3F01
color2a = #31FA2A
color3a = #FA6B6B
color4a = #971643

momentumColor= WTF>WTF[1] and WTF>smma ? color1a : WTF<WTF[1] and WTF>smma ? color2a : WTF>WTF[1] and WTF<smma ? color3a : WTF<WTF[1] and WTF<smma ? color4a : na


plot(showMomentum ? WTF:na, color=momentumColor, linewidth=3)
plot(showMomentum ? smma:na , linewidth=2, color=color.white)


osc= displayRSI =="RSI Divergence" ? rsiValue1 : displayRSI =="RSI Smoothed" ? rsisrc:na

///////////divergence
plFound = na(ta.pivotlow(osc, lbL, lbR)) ? false : true
phFound = na(ta.pivothigh(osc, lbL, lbR)) ? false : true
_inRange(cond) =>
	bars = ta.barssince(cond == true)
	rangeLower <= bars and bars <= rangeUpper

//------------------------------------------------------------------------------
// Regular Bullish
// Osc: Higher Low

oscHL = osc[lbR] > ta.valuewhen(plFound, osc[lbR], 1) and _inRange(plFound[1])

// Price: Lower Low

priceLL = low[lbR] < ta.valuewhen(plFound, low[lbR], 1)
bullCond = plotBull and priceLL and oscHL and plFound

plot(
     displayRSI !="RSI Momentum"and plFound ? osc[lbR] : na,
     offset=-lbR,
     title="Regular Bullish",
     linewidth=2,
     color=(bullCond ? bullColorrsidiv : noneColor)

     )


//------------------------------------------------------------------------------
// Hidden Bullish
// Osc: Lower Low

oscLL = osc[lbR] < ta.valuewhen(plFound, osc[lbR], 1) and _inRange(plFound[1])

// Price: Higher Low

priceHL = low[lbR] > ta.valuewhen(plFound, low[lbR], 1)
hiddenBullCond = plotHiddenBull and priceHL and oscLL and plFound

plot(
	 displayRSI !="RSI Momentum" and plFound ? osc[lbR] : na,
	 offset=-lbR,
	 title="Hidden Bullish",
	 linewidth=2,
	 color=(hiddenBullCond ? hiddenBullColor : noneColor)

	 )


//------------------------------------------------------------------------------
// Regular Bearish
// Osc: Lower High

oscLH = osc[lbR] < ta.valuewhen(phFound, osc[lbR], 1) and _inRange(phFound[1])

// Price: Higher High

priceHH = high[lbR] > ta.valuewhen(phFound, high[lbR], 1)

bearCond = plotBear and priceHH and oscLH and phFound

plot(
	 displayRSI !="RSI Momentum" and phFound ? osc[lbR] : na,
	 offset=-lbR,
	 title="Regular Bearish",
	 linewidth=2,
	 color=(bearCond ? bearColorrsidiv : noneColor)

	 )


//------------------------------------------------------------------------------
// Hidden Bearish
// Osc: Higher High

oscHH = osc[lbR] > ta.valuewhen(phFound, osc[lbR], 1) and _inRange(phFound[1])

// Price: Lower High

priceLH = high[lbR] < ta.valuewhen(phFound, high[lbR], 1)

hiddenBearCond = plotHiddenBear and priceLH and oscHH and phFound

plot(
	 displayRSI !="RSI Momentum" and phFound ? osc[lbR] : na,
	 offset=-lbR,
	 title="Hidden Bearish",
	 linewidth=2,
	 color=(hiddenBearCond ? hiddenBearColor : noneColor)

	 )


// ### Alerts


if bearCond
    alert("Bearish Divergence")
else if hiddenBearCond
    alert("Hidden Bearish Divergence")
else if bullCond
    alert("Bullish Divergence")
else if hiddenBullCond
    alert("Hidden Bullish Divergence")

if hiddenBullCond
    strategy.entry("Enter Long", strategy.long)
else if hiddenBearCond
    strategy.entry("Enter Short", strategy.short)


// END ###