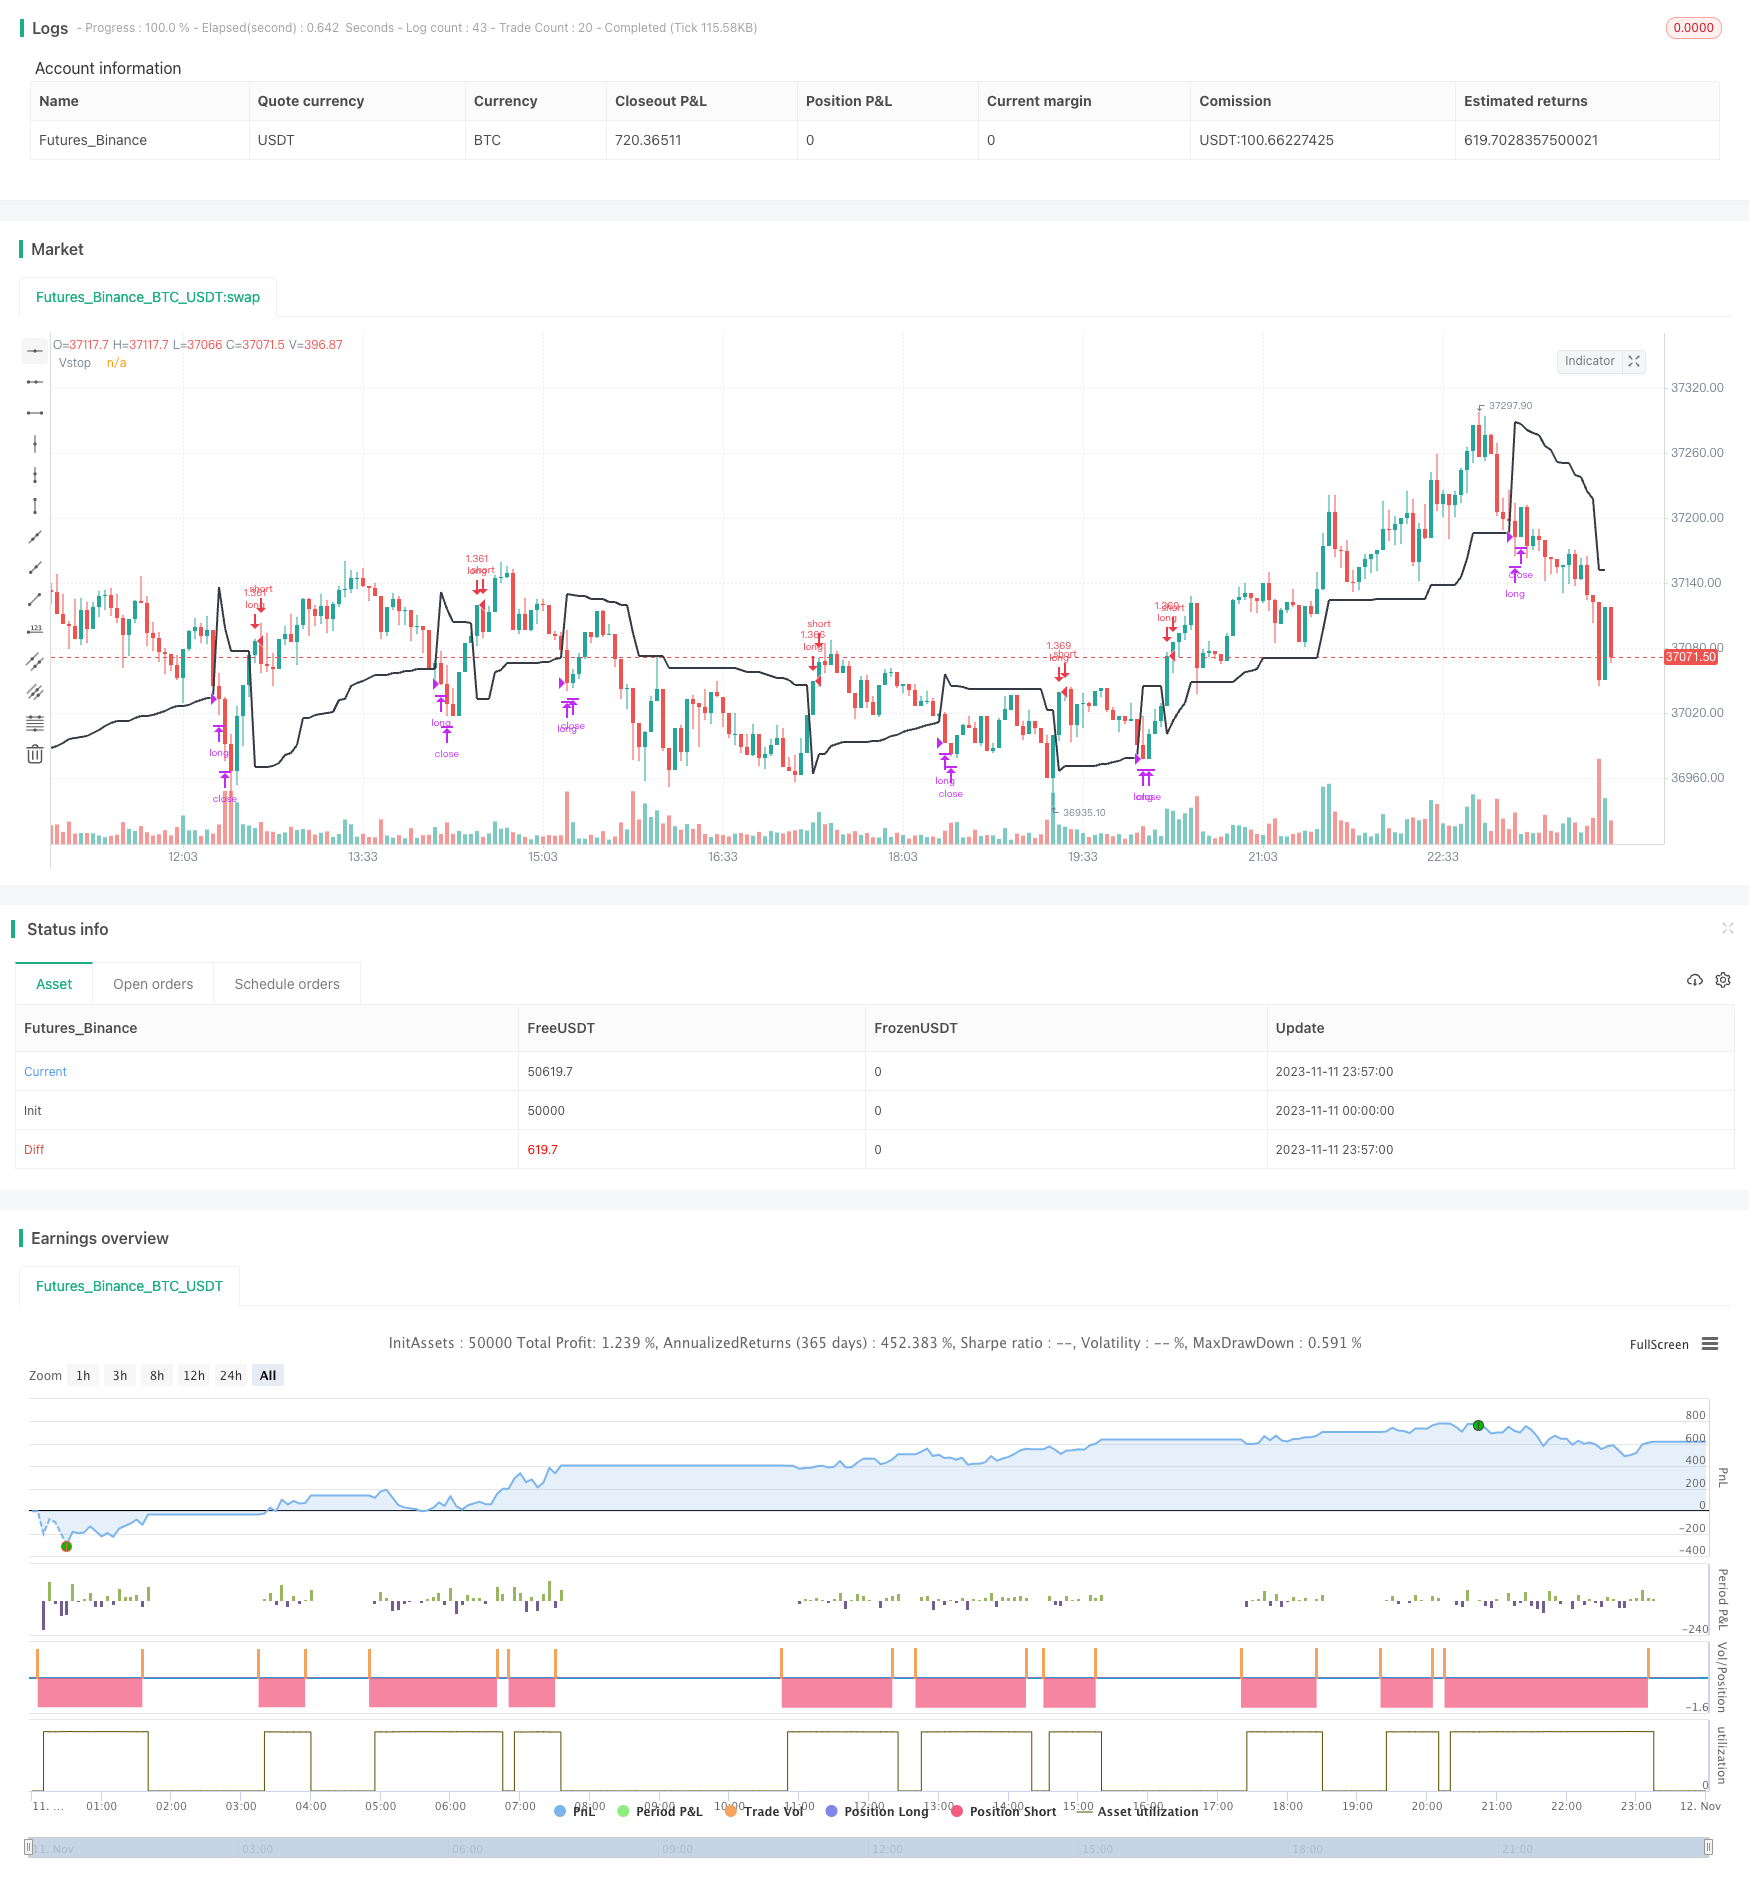
波動停止のモメンタムブレイク戦略
作者: リン・ハーンチャオチャン,日付: 2023-11-13 17:20:51タグ:

概要
この戦略は,ブレイクアウトと波動性ストップに基づいたトレンドフォロー戦略である.この戦略は,ダイナミックストップ損失ラインの価格ブレイクアウトによってトレンド方向を特定する.価格はストップ損失ラインに浸透すると取引に入り,ストップ損失ラインを使用してトレンドを追跡し,利益をロックする.この戦略は,ダイナミックストップでリスクを制御しながら中長期トレンドを把握することを目的としている.
戦略の論理
この戦略は,トレンド方向とストップ損失を追跡するために波動性ストップ指標を使用する.波動性ストップは,価格変動範囲に基づいて動的ストップ損失ラインを計算する.具体的なステップは:
- 価格のATR (平均真差) を計算する
- ストップ損失係数でATRを掛けることでストップ損失線を得る.
- ストップ・ロスの線は最高価格マイナスATR*係数です
- ストップ・ロスの線は最低価格+ATR*係数です
ストップ・ロスは価格とともに上下波動し ダイナミックなチャネルを形成します
ストップ・ロスの線に突入すると,トレンド逆転が示されます. 戦略はポジションを開きます:
- 価格がストップ・ロスの線を超えると,ロング
- 価格がストップ・ロスの線を下回ると,ショート
ストップ・ロスは次の線で実行されます.
- ストップ・ロスは最高価格マイナスATR*係数です
- ストップ・ロスは最低価格+ATR*係数です
価格がストップ・ロスのラインに再び到達すると,ポジションは閉じる.
ストップでリスクを制御しながら 戦略がタイミングで動向を追跡できるのです
利点分析
この戦略には以下の利点があります.
- トレンドの逆転をタイムリーに把握し,トレンドをフォローできる
- 市場変動に基づいてストップポジションを調整するために動的ストップ損失を使用します.
- ストップ・ロスの更新は,最大利益を固定する傾向
- 高い利益を得る傾向にある
- リスクを効果的にコントロールし 大きな損失を回避します
リスク分析
考慮すべきリスクもいくつかあります.
- ストップ・ロスは,レンジング・マーケットで頻繁に行われる可能性があります.
- 適切なストップ損失係数を設定する必要があります,あまりにも小さいが,あまりにも敏感である可能性があります
- 取引料金は,頻繁な取引で利益を消費する可能性があります
- 傾向の初期段階では,いくつかの利益を失う可能性があります.
- ストップロスのリスクは価格からあまりにも遠くにある場合
解決策:
- ベストパラメータを見つけるためにバックテストを通じてストップ損失係数を最適化
- 取引頻度を下げるため,より長い時間枠を使用する
- 過剰取引を避けるためにフィルターを追加する
- 停車距離に柔軟性はあるが,大きすぎない.
オプティマイゼーションの方向性
この戦略は,次の側面においてさらに最適化することができる.
- 最適なパラメータ組み合わせを見つけるためにストップ損失係数を最適化
- フィルターを追加して,市場範囲でウィップソウを避ける
- シグナル検証のための複数のタイムフレームを組み合わせる
- ポジションサイズを最適化し,徐々にサイズを増やす
- ダイナミックな時間枠の調整を検討
- 主なトレンドを把握するために,株式の基本値と組み合わせる
概要
波動性ストップのモメンタムブレイクアウト戦略は,非常に実践的なトレンドフォローシステムです.動的ストップでリスクを効果的に制御しながらトレンド逆転の機会を把握し,トレンドをフォローすることができます.適切なパラメータチューニングにより,トレンド市場中に良いリターンを得ることができます.しかし,過度に敏感なストップ,高い取引頻度など,いくつかの問題に対処する必要があります.さらなる最適化は,効率的で堅牢な量子取引戦略に変えることができます.
/*backtest
start: 2023-11-11 00:00:00
end: 2023-11-12 00:00:00
period: 3m
basePeriod: 1m
exchanges: [{"eid":"Futures_Binance","currency":"BTC_USDT"}]
*/

// This source code is subject to the terms of the Mozilla Public License 2.0 at https://mozilla.org/MPL/2.0/
//@version=4
strategy(shorttitle='Volatility Stop Strategy',title='Volatility Stop Strategy (by Coinrule)', overlay=true, initial_capital = 100, process_orders_on_close=true, default_qty_type = strategy.percent_of_equity, default_qty_value = 100, commission_type=strategy.commission.percent, commission_value=0.1)

// Works better on 3h, 1h, 2h, 4h
// Best time frame 2H

//Backtest dates
fromMonth = input(defval = 1,    title = "From Month",      type = input.integer, minval = 1, maxval = 12)
fromDay   = input(defval = 1,    title = "From Day",        type = input.integer, minval = 1, maxval = 31)
fromYear  = input(defval = 2021, title = "From Year",       type = input.integer, minval = 1970)
thruMonth = input(defval = 1,    title = "Thru Month",      type = input.integer, minval = 1, maxval = 12)
thruDay   = input(defval = 1,    title = "Thru Day",        type = input.integer, minval = 1, maxval = 31)
thruYear  = input(defval = 2112, title = "Thru Year",       type = input.integer, minval = 1970)

showDate  = input(defval = true, title = "Show Date Range", type = input.bool)

start     = timestamp(fromYear, fromMonth, fromDay, 00, 00)        // backtest start window
finish    = timestamp(thruYear, thruMonth, thruDay, 23, 59)        // backtest finish window
window()  => time >= start and time <= finish ? true : false       // create function "within window of time"

length = input(20, "Length", minval = 2)
src = input(close, "Source")
factor = input(3.0, "vStop Multiplier", minval = 0.25, step = 0.25)
volStop(src, atrlen, atrfactor) =>
    var max     = src
    var min     = src
    var uptrend = true
    var stop    = 0.0
    atrM        = nz(atr(atrlen) * atrfactor, tr)
    max         := max(max, src)
    min         := min(min, src)
    stop        := nz(uptrend ? max(stop, max - atrM) : min(stop, min + atrM), src)
    uptrend     := src - stop >= 0.0
    if uptrend != nz(uptrend[1], true)
        max    := src
        min    := src
        stop   := uptrend ? max - atrM : min + atrM
    [stop, uptrend]

[vStop, uptrend] = volStop(src, length, factor)


//Entry


strategy.entry(id="long", long = true, when = crossover(close, vStop) and window())

//Exit
strategy.close("long", when = crossunder(close, vStop))

plot(vStop,"Vstop", color.black, linewidth=2)
もっと
- モメントブレイク戦略
- 双重MACD量的な取引戦略
- コーン・ムービング・平均バランス・トレード戦略
- 二重逆転入国戦略
- モメント市場情緒指標戦略
- モメントスプレイス ブレイクアウト トレンド追跡戦略
- 逆MACDモメンタムとDMIブレイク短期スカルピング戦略が絡んでいる
- EMAの%チャネルとボリンガー帯域取引戦略
- 双重EMAクロスオーバー戦略
- 徐々にストップ・ロスの動きの戦略
- 極端な流通のスイング戦略
- 多指標のクロスオーバー 強力なトレンド追跡戦略
- 価格ブレイクと平均逆転に基づくモメンタムブレイク取引戦略
- モメント価格トレンド追跡戦略
- フラクタル波とSMMAをベースにしたFX戦略
- 移動平均クロスオーバーと上部鉄道の突破推進戦略
- コッポック曲線に基づく量的な取引戦略
- プレッシャーバランスに基づく高確率の突破取引戦略
- 複合期貨取引戦略 急速なRSIリスク管理
- 2つのDIのクロスオーバー・デイリー・トレーディング・戦略