アダプティブ・ボリンガー・トレンド・トラッキング・戦略
作者: リン・ハーンチャオチャン開催日:2023年11月16日 16:35:01タグ:

概要
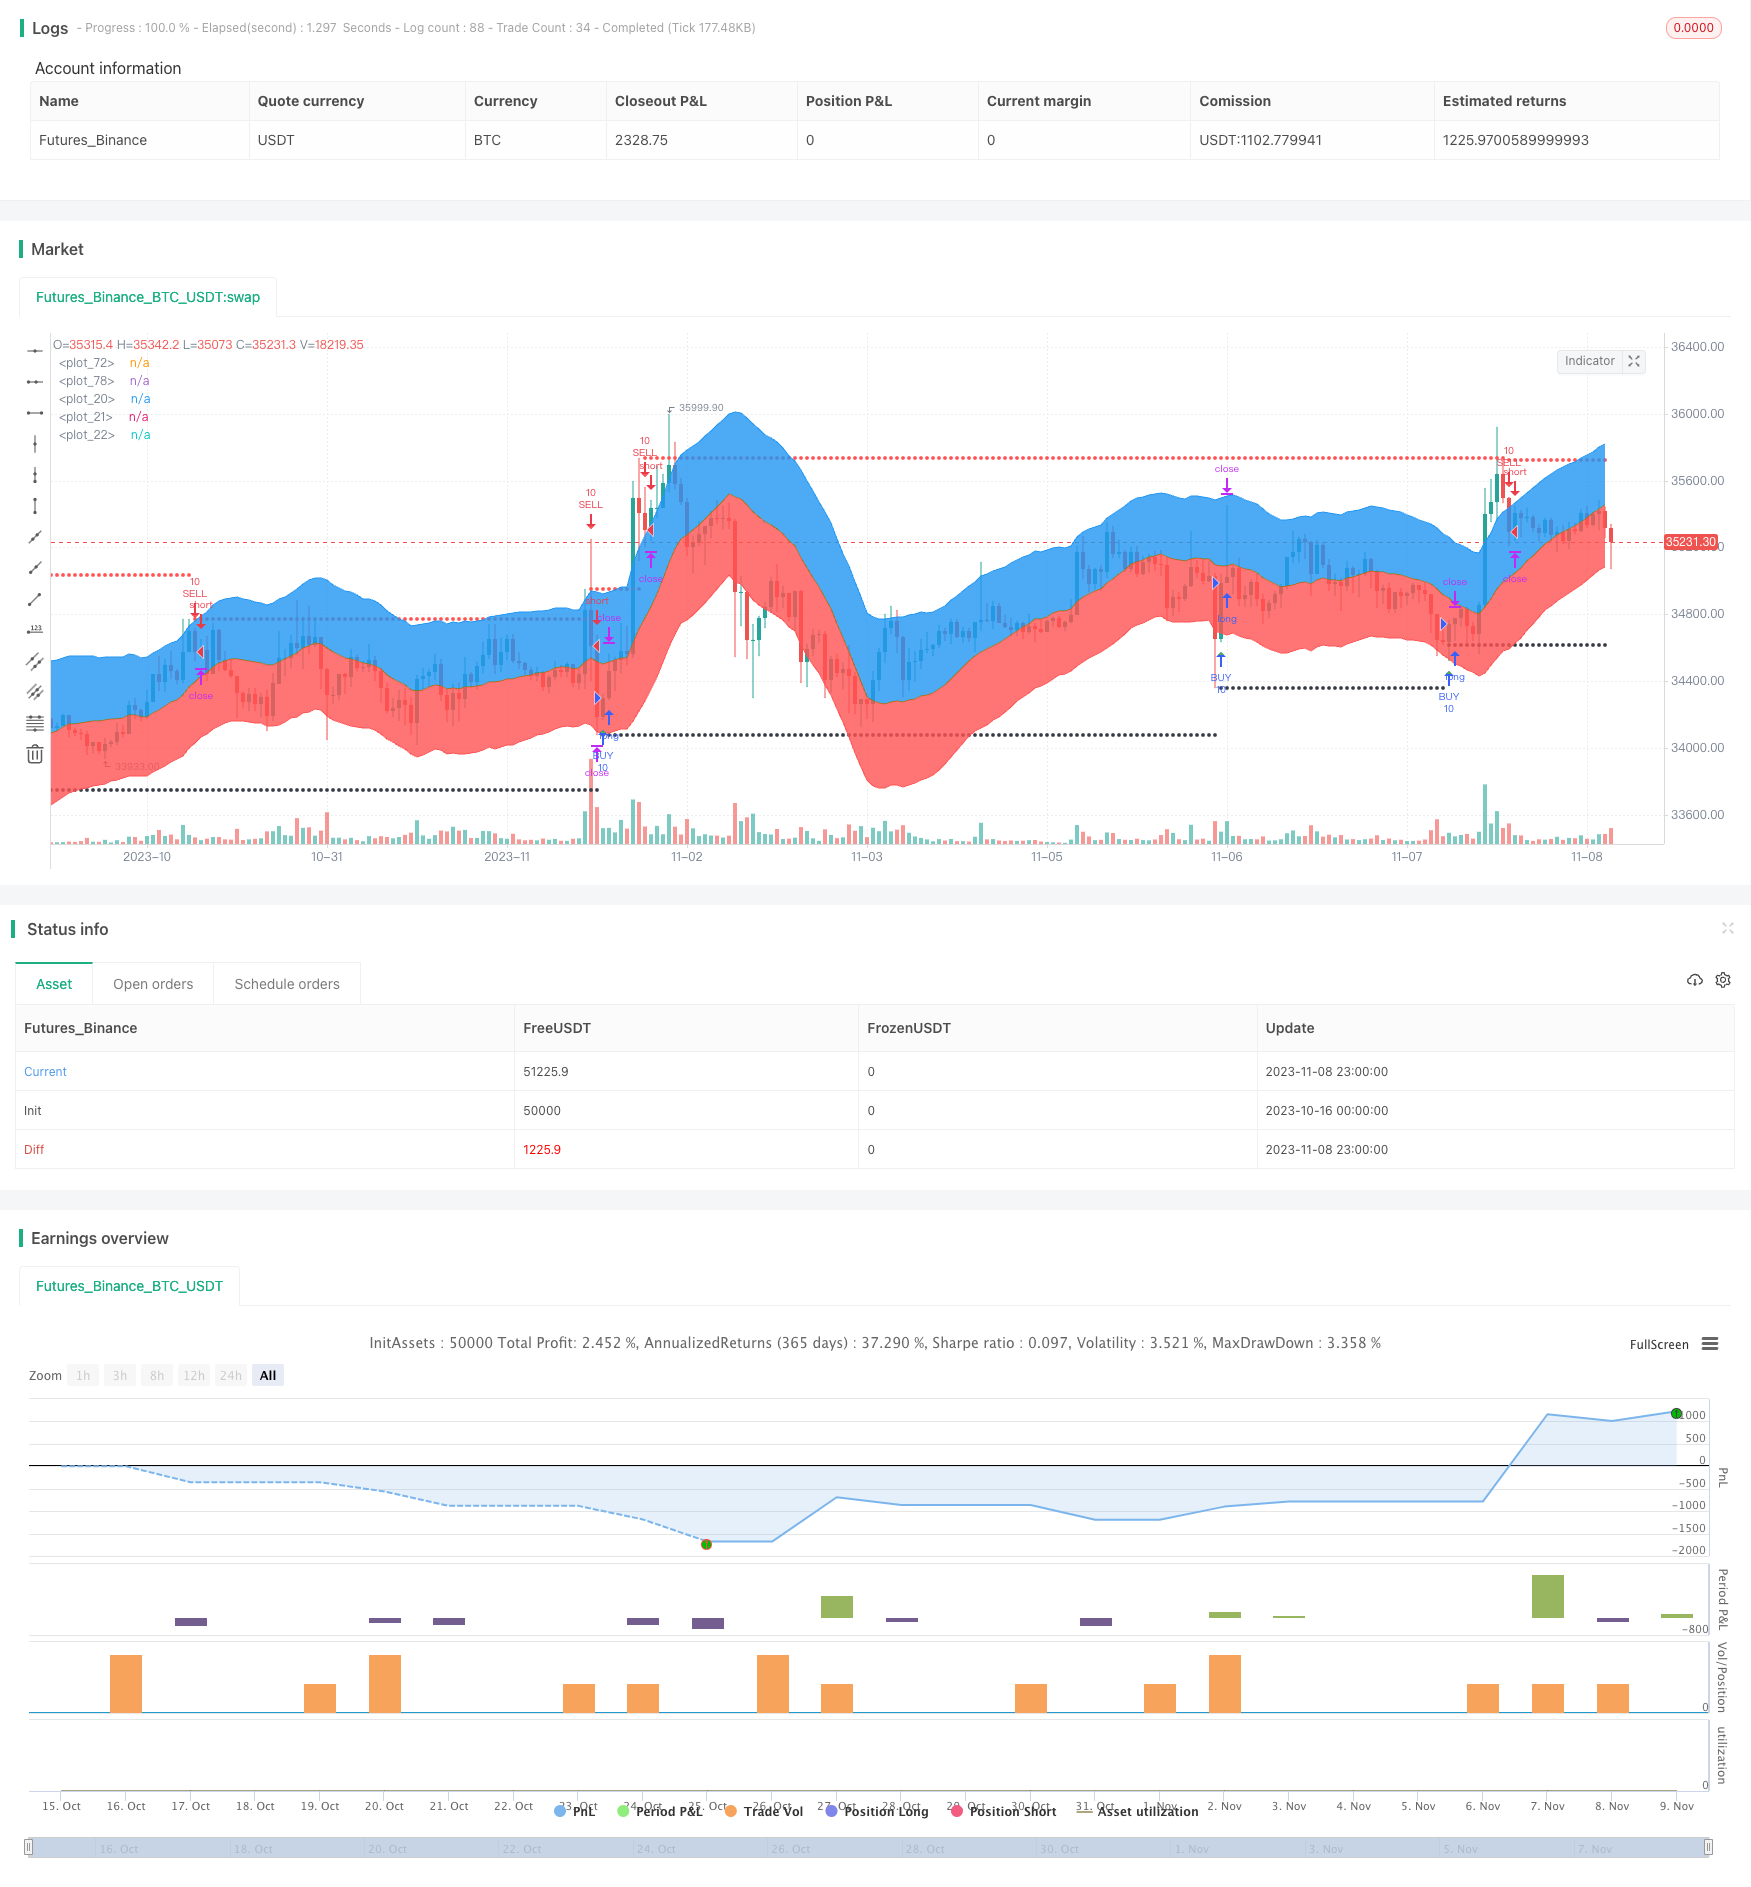
この戦略は,トレンドを正確に判断し追跡するために,適応性移動平均と組み合わせたボリンジャーバンド指標に基づいています.パラメータを動的に調整することで,戦略は,強力な安定性と適応性をもって,異なる製品と市場環境に適応できます.
戦略の論理
戦略は以下の主要な部分で構成されています.
-
アダプティブ・ムービング・メアダを計算する. 線形回帰指標を使用して,一定の期間の線形回帰曲線を移動平均として計算する.
-
ボリンジャー帯を計算する.上下帯を得るために,ユーザ指定の ratio2 パラメーターと組み合わせた,アダプティブ ATR インディケーターを使用して帯を計算する.
-
入口と出口を決定する.ボリンジャー帯を通過した価格の破綻に基づいてトレンド方向と入口/出口を判断する.上帯信号を破って入口を販売し,下帯信号を破って入口を購入する.
-
ストップ・ロスを設定し,利益を得ます.リスクを制御するために固定ポイントストップ・ロスを使用し,トレンド利益を最大化するためにストップ・ロスを追跡します.
-
戦略の最適化と検証のためのバックテストの時間窓と組み合わせます
利点
-
アダプティブ・パラメータ アダプティブ・移動平均値と帯のデザインは市場の変化に適応します
-
ブレイクシグナルが明確です ボリンガー・バンドのブレイクシグナルは 明らかにトレンド逆転の信号です
-
合理的なストップ設定 固定ストップ損失はリスクを制御し,ストップ利益はトレンド利益を最大化することを目的としています
-
バックテストによって検証されます バックテストのウィンドウは戦略の有効性を確認します
-
論理は明確で コードも分かりやすく 簡潔です
リスク
-
ボリンガー帯はパラメータ調節が必要である. バンド幅と周期は異なる製品に最適化する必要がある可能性がある. 不適切なパラメータは,信号が欠落したり,誤ったトリガーを引き起こす.
-
制限されたバックテスト期間.最近のバックテスト範囲は,包括的な歴史的データにおける安定性を完全に確認するには不十分である可能性があります.
-
オーバーフィッティングリスク: 現在の最適化されたパラメータは,最近の特定の市場状況に過剰に適合する可能性があります.
-
ストップ・ロスのレベルは評価する必要がある. ストップ・ロスのレベルは敏感すぎ,小幅の変動によって停止される可能性があります. 適切なストップ・ロスのレベルは評価する必要があります.
-
定量化検証の欠如.現在,定量化メトリックの検証のない取引シグナルに対して,グラフィックブレイクアウトのみを使用します.
改善 の 方向
-
適応性の高い指標を導入し,様々な適応性の高い移動平均値とチャネルを組み合わせて,強力なトレンド追跡システムを構築する.
-
パラメータ最適化 遺伝アルゴリズムのような より体系的な方法を用いて 最適なパラメータの組み合わせを見つける
-
バックテスト期間を拡大する. パラメータの安定性を調べるためにより広い歴史的データでテストする. より現実的なバックテストのために取引コストを組み込む.
-
量別フィルターを導入します. フィルタを設定します. 音量ブレイク,MACDヒストグラムギャップなどです.
-
ストップを最適化する. 異なる固定ストップ損失レベルとトレーリングストップ方法を評価して最適なストップを見つけます.
-
リアルタイムで検証し 改善のために 最適化された戦略を リアルタイムで実行して パフォーマンスを記録します
結論
この戦略は,トレンド方向を決定し,ブレイクアウト信号をキャプチャするためにボリンジャーバンドを使用し,移動平均が全体的なトレンドを定義する明確な論理を持っています.適切な最適化により,戦略に従う安定した信頼性の高いトレンドになることができます.しかし,重要な考慮事項には,バックテストの代表性,定量フィルター,ストップロスのチューニングが含まれます.これらの側面が適切に処理されれば,戦略はライブ取引で安定したかなりの利益を達成することができます.
/*backtest
start: 2023-10-16 00:00:00
end: 2023-11-09 00:00:00
period: 1h
basePeriod: 15m
exchanges: [{"eid":"Futures_Binance","currency":"BTC_USDT"}]
*/

//@version=4
strategy("Linear Regression (Backtest / Trailing Stop)",overlay=true)
close_price = close[0]

len = input(40)
linear_reg = linreg(close_price, len, 0)

calculationToPlotAverageMeanLine=linear_reg
useUpperDeviation = input(true, "Upper Deviation", bool)
useLowerDeviation = input(true, "Lower Deviation", bool)
ratio2=input(defval=2,title=" Ratio 2")
avg=atr(len)
r2=avg*ratio2
top=linear_reg+r2
bott=linear_reg-r2

calculationToPlotUpperLine=top
calculationToPlotLowerLine=bott

plotUpperDeviationLine = plot(not useUpperDeviation ? na : calculationToPlotUpperLine, color=color(blue,0))
plotAverageMeanLine = plot(calculationToPlotAverageMeanLine, color=color(olive,0))
plotLowererDeviationLine = plot(not useLowerDeviation ? na : calculationToPlotLowerLine, color=color(red,0))
fill(plotUpperDeviationLine, plotAverageMeanLine, color=color(blue,85))
fill(plotLowererDeviationLine, plotAverageMeanLine, color=color(red,85))


//
length = input(title="linear Length",  defval=40, minval=1)
multiplier = input(title="linear Deviation", type=float, defval=2, minval=1)
overbought = input(title="Overbought",  defval=1, minval=1)
oversold = input(title="Oversold",  defval=0, minval=1)
custom_timeframe = input(title="Use another Timeframe?", type=bool, defval=false)
highTimeFrame = input(title="Select The Timeframe",  defval="60")
res1 = custom_timeframe ? highTimeFrame : timeframe.period

fixedSL = input(title="SL Activation", defval=70)
trailSL = input(title="SL Trigger", defval=10)
fixedTP = input(title="TP Activation", defval=50)
trailTP = input(title="TP Trigger", defval=10)

// === INPUT BACKTEST RANGE ===
FromMonth = input(defval = 1, title = "From Month", minval = 1, maxval = 12)
FromDay   = input(defval = 1, title = "From Day", minval = 1, maxval = 31)
FromYear  = input(defval = 2019, title = "From Year", minval = 2015)
ToMonth   = input(defval = 1, title = "To Month", minval = 1, maxval = 12)
ToDay     = input(defval = 1, title = "To Day", minval = 1, maxval = 31)
ToYear    = input(defval = 9999, title = "To Year", minval = 2015)

start     = timestamp(FromYear, FromMonth, FromDay, 00, 00)  // backtest start window
finish    = timestamp(ToYear, ToMonth, ToDay, 23, 59)        // backtest finish window
window()  => time >= start and time <= finish ? true : false // create function "within window of time"

smabasis = linreg(close_price, length, 0)
stdev = stdev(close, length)
cierre = request.security(syminfo.tickerid, res1, close, false)
alta = request.security(syminfo.tickerid, res1, high, false)
baja = request.security(syminfo.tickerid, res1, low, false)
basis1 = request.security(syminfo.tickerid, res1, smabasis, false)
stdevb = request.security(syminfo.tickerid, res1, stdev, false)
dev = multiplier * stdevb // stdev(cierre, length)
upper = basis1 + dev
lower = basis1 - dev

bbr = (cierre - lower)/(upper - lower)

// plot(bbr)

// // MARCA LAS RESISTENCIAS
pintarojo = 0.0
pintarojo := nz(pintarojo[1])
pintarojo := bbr[1] > overbought and bbr < overbought ? alta[1] :  nz(pintarojo[1])
p = plot(pintarojo, color = red, style=circles, linewidth=2)

// // MARCA LOS SOPORTES
pintaverde = 0.0
pintaverde := nz(pintaverde[1])
pintaverde := bbr[1] < oversold and bbr > oversold ? baja[1] :  nz(pintaverde[1])
g = plot(pintaverde, color = black, style=circles, linewidth=2)
zz= crossover(pintaverde,pintaverde[1]) or crossunder(pintaverde,pintaverde[1])
kp= crossover(pintarojo,pintarojo[1]) or crossunder(pintarojo,pintarojo[1])
plotshape(zz,  title="buy", style=shape.triangleup,location=location.belowbar, color=green, transp=0, size=size.small)
plotshape(kp, title="sell", style=shape.triangledown,location=location.abovebar, color=red, transp=0, size=size.small)


strategy.entry("BUY", strategy.long, qty=10, oca_name="BUY",  when=zz and window())
strategy.exit("B.Exit", "BUY", qty_percent = 100, loss=fixedSL, trail_offset=trailTP, trail_points=fixedTP)

strategy.entry("SELL", strategy.short, qty=10, oca_name="SELL",  when=kp and window())
strategy.exit("S.Exit", "SELL", qty_percent = 100, loss=fixedSL, trail_offset=trailSL, trail_points=fixedTP)
- MZ MA 複数のタイムフレーム戦略
- 2つの移動平均のクロスオーバーモメント戦略
- 双動平均追跡ストップ損失戦略
- カンドルスタイクボディベースのダブルスルーストラテジー
- 固定ネットワーク取引戦略
- 相対強度指数 長期/短期戦略
- 二重モメンタムブレークアウト戦略
- Bollinger Bands と ゴールデン レショア を ベース に する 平均 逆転 取引 戦略
- 振動戦略をフォローするモメントトレンド
- WaveTrend と CMF ベース トレンド フォロー 戦略
- RSI 移動平均のクロスオーバー戦略
- Bollinger Bands をベースにしたトレンドブレークアウト戦略
- 適応型規則化移動平均市場間仲裁戦略
- ストップ・ロスの戦略を2重強のトレンド追跡
- モメント インディケーター戦略
- ハイキン・アシ逆戦略
- ダイナミック・オシレーション・ブレークアウト戦略
- 5分間のEMAクロスオーバー戦略に続く傾向
- RSI 傾向 戦略 を フォロー する
- RSI 差異戦略