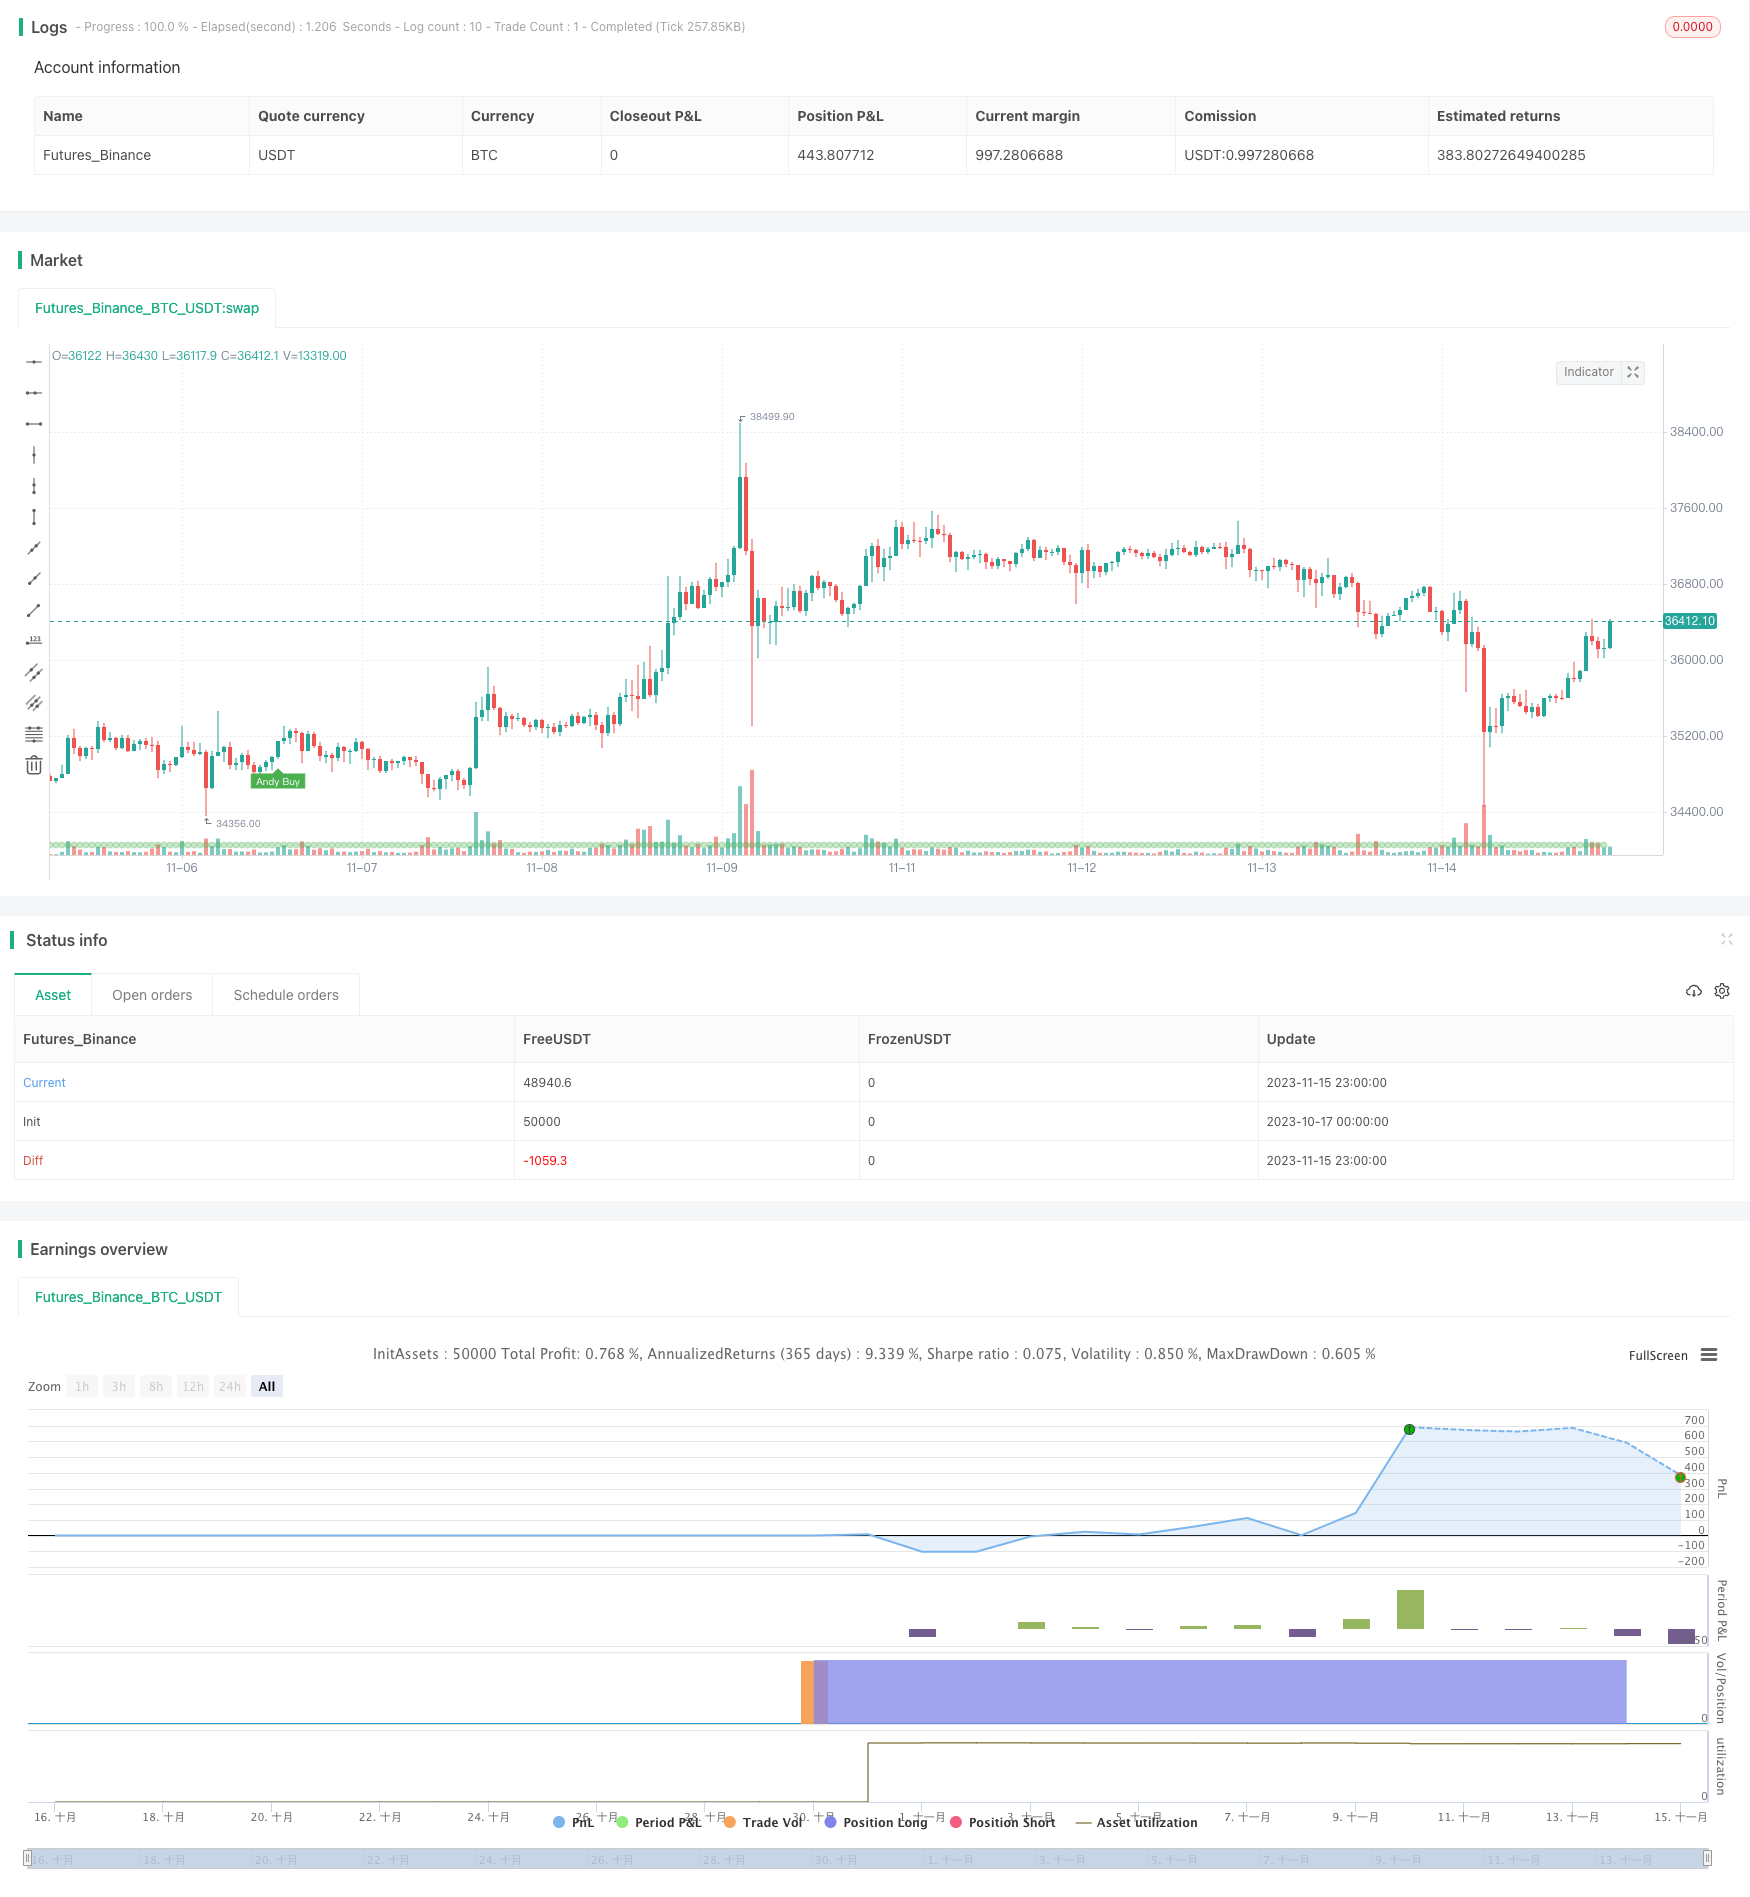
戦略をフォローするタイムフレーム間のモメンタム回転傾向
作者: リン・ハーンチャオチャン,日付: 2023-11-17 17:32:11タグ:

概要
この戦略は,時間枠間の移動平均線を組み合わせ,中間時間表のトレンド回転を認識し,低リスクトレンド追跡取引を実現する.この戦略は,柔軟な配置,シンプルな実現,資金効率の高い利点を有し,中間線と長期線を保持し,トレンドを追求するトレーダーに適しています.
原理分析
戦略は,5日,20日および40日間の3つの移動平均線を使用して,異なる時間枠の下のトレンドを判断する配列の組み合わせを用い,大中小時表のトレンド一致性原理に基づいて多空周期を決定する.
具体的には,5日間高速線で20日間線を横切ると短線上昇信号,20日間線で40日間線を横切ると中線上昇信号とみなされる.高速線で遅線3が正列 (5日>20日>40日) のとき,多頭周期と判断される.高速線で遅線3が反列 (5日<20日<40日) のとき,空頭周期と判断される.
このように,大きな周期傾向の判断方向に基づいて,小周期強度と組み合わせて特定のエントリーを検出する.つまり,大きなトレンドが同方向で,小周期が強い場合にのみ取引を開始することで,反転偽突破を効果的にフィルタリングし,高勝率操作を実現することができる.
さらに,戦略はATRの停止損失を利用し,単筆のリスクを制御し,利潤率をさらに向上させる.
優位性分析
-
柔軟な設定,ユーザが異なる品種と取引好みに合わせて移動平均線パラメータを自律的に調整できます
-
シンプルで,初心者にも使いやすい.
-
資金の活用効率が高く,資金の利回り効果を最大限に活用できます.
-
リスク管理,損失防止のメカニズム
-
強いトレンド追いつく能力,大きなサイクルが方向性を決定した後,継続的な利益
-
勝率が高い,取引信号の質が良い,軌道を誤った操作が少ない
リスクと改善
-
大周期判断は移動均線配列に依存し,遅延誤判のリスクがあります.
-
小周期強度検定は,K線だけで,早期に触発されてもよい,適切にリラックスできる
-
停止損失の幅は固定され,動的な停止のために最適化されます.
-
取引量エネルギーなど,追加のフィルタリング条件を追加することを検討できます.
-
戦略を最適化するために,異なる移動平均値参数組み合わせを試すことができます.
概要
この戦略は,マルチタイムフレーム分析とストップ損失管理を統合し,低リスクのトレンドフォロー取引を実現する.パラメータを調整することで,トレンドフォロワーのニーズを満たすさまざまな品種に適用することができる.従来の単一タイムフレームシステムと比較して,取引の決定がより安定し,信号がより効率的である.全体的に,この戦略は良好な市場適応性と成長見通しを持っている.
概要
この戦略は,時間枠間の移動平均の組み合わせを使用して,時間,日,週チャートでのトレンドローテーションを特定します. 取引後に低リスクトレンドを可能にします. 戦略は柔軟で,実行が簡単で,資本効率が高く,中長期トレンドトレーダーに適しています.
取引の論理
この戦略は,5日,20日および40日間の移動平均値を用い,異なる時間枠間のトレンドの調整を決定する.より大きな時間枠とより小さな時間枠間の一貫性に基づいて,上昇と下落サイクルを特定する.
具体的には,20日間間間間間間間間間間間間間間間間間間間間間間間間間間間間間間間間間間間間間間間間間間間間間間間間間間間間間間間間間間間間間間間間間間間間間間間間間間間間間間間間間間間間間間間間間間間間間間間間間間間間間間間間間間間間間間間間間間間間間間間間間間間間間間間間間間間間間間間間間間間間間間間間間間間間間間間間間間間間間間間間間間間間間間間間間間間間間間間間間間間間間間間間間間間間間間間間間間間間間間間間間間間間間間間間間間間間間間間間間間間間間間間間間間間間間間間間間間間間間間間間間間間間間間間間間間
より大きなサイクルの方向を決定し,より小さなサイクルの強さを確認することで,この戦略は主要なトレンドとマイナー・インパントが一致するときにのみポジションを開く.これは誤ったブレイクを効果的に回避し,高い勝利率を達成する.
この戦略は,ATRの遅延停止も利用し,単一貿易リスクを制御し,収益性をさらに向上させる.
利点
-
柔軟な構成により,異なる楽器と取引スタイルに適合する
-
初心者でも簡単に実行できます
-
資本効率が高く,レバレッジを最大化する
-
重要な損失を避けるための効果的なリスク管理
-
持続的な利益を得る能力に続く強い傾向
-
強い信号と少なめのウィップソーによる高い勝利率
リスク と 改善
-
MAのクロスオーバーは遅れて後期トレンド検出を引き起こす可能性があります.
-
シングルキャンドルの強さの検出は 早期に入力,リラックス状態を誘発する可能性があります
-
ATRストップ損失を固定し,ダイナミックストップに最適化
-
ボリュームのような補完フィルターを追加することを検討します
-
最適化のための異なるMAパラメータを探索
結論
この戦略は,取引後の低リスクトレンドのための複数のタイムフレーム分析とリスク管理を統合している.パラメータを調整することで,トレンドトレーダーに適した異なるツールに適応することができる.単一のタイムフレームシステムと比較して,より堅牢な取引決定を行い,より高い効率のシグナルを生成する.結論として,この戦略は市場適応性と開発の可能性が良好である.
/*backtest
start: 2023-10-17 00:00:00
end: 2023-11-16 00:00:00
period: 1h
basePeriod: 15m
exchanges: [{"eid":"Futures_Binance","currency":"BTC_USDT"}]
*/

// This source code is subject to the terms of the Mozilla Public License 2.0 at https://mozilla.org/MPL/2.0/
// © kgynofomo

//@version=5
strategy(title="[Salavi] | Andy Advance Pro Strategy [BTC|M15]",overlay = true, pyramiding = 1,initial_capital = 10000, default_qty_type = strategy.cash,default_qty_value = 10000)

ema_short = ta.ema(close,5)
ema_middle = ta.ema(close,20)
ema_long = ta.ema(close,40)

cycle_1 = ema_short>ema_middle and ema_middle>ema_long
cycle_2 = ema_middle>ema_short and ema_short>ema_long
cycle_3 = ema_middle>ema_long and ema_long>ema_short
cycle_4 = ema_long>ema_middle and ema_middle>ema_short
cycle_5 = ema_long>ema_short and ema_short>ema_middle
cycle_6 = ema_short>ema_long and ema_long>ema_middle

bull_cycle = cycle_1 or cycle_2 or cycle_3
bear_cycle = cycle_4 or cycle_5 or cycle_6
// label.new("cycle_1")
// bgcolor(color=cycle_1?color.rgb(82, 255, 148, 60):na)
// bgcolor(color=cycle_2?color.rgb(82, 255, 148, 70):na)
// bgcolor(color=cycle_3?color.rgb(82, 255, 148, 80):na)
// bgcolor(color=cycle_4?color.rgb(255, 82, 82, 80):na)
// bgcolor(color=cycle_5?color.rgb(255, 82, 82, 70):na)
// bgcolor(color=cycle_6?color.rgb(255, 82, 82, 60):na)

// Inputs
a = input(2, title='Key Vaule. \'This changes the sensitivity\'')
c = input(7, title='ATR Period')
h = false

xATR = ta.atr(c)
nLoss = a * xATR

src = h ? request.security(ticker.heikinashi(syminfo.tickerid), timeframe.period, close, lookahead=barmerge.lookahead_off) : close

xATRTrailingStop = 0.0
iff_1 = src > nz(xATRTrailingStop[1], 0) ? src - nLoss : src + nLoss
iff_2 = src < nz(xATRTrailingStop[1], 0) and src[1] < nz(xATRTrailingStop[1], 0) ? math.min(nz(xATRTrailingStop[1]), src + nLoss) : iff_1
xATRTrailingStop := src > nz(xATRTrailingStop[1], 0) and src[1] > nz(xATRTrailingStop[1], 0) ? math.max(nz(xATRTrailingStop[1]), src - nLoss) : iff_2

pos = 0
iff_3 = src[1] > nz(xATRTrailingStop[1], 0) and src < nz(xATRTrailingStop[1], 0) ? -1 : nz(pos[1], 0)
pos := src[1] < nz(xATRTrailingStop[1], 0) and src > nz(xATRTrailingStop[1], 0) ? 1 : iff_3

xcolor = pos == -1 ? color.red : pos == 1 ? color.green : color.blue

ema = ta.ema(src, 1)
above = ta.crossover(ema, xATRTrailingStop)
below = ta.crossover(xATRTrailingStop, ema)

buy = src > xATRTrailingStop and above
sell = src < xATRTrailingStop and below

barbuy = src > xATRTrailingStop
barsell = src < xATRTrailingStop


atr = ta.atr(14)
atr_length = input.int(25)
atr_rsi = ta.rsi(atr,atr_length)
atr_valid = atr_rsi>50

long_condition =  buy and bull_cycle and atr_valid
short_condition =  sell and bear_cycle and atr_valid

Exit_long_condition = short_condition
Exit_short_condition = long_condition

if long_condition
    strategy.entry("Andy Buy",strategy.long, limit=close,comment="Andy Buy Here")

if Exit_long_condition
    strategy.close("Andy Buy",comment="Andy Buy Out")
    // strategy.entry("Andy fandan Short",strategy.short, limit=close,comment="Andy 翻單 short Here")
    // strategy.close("Andy fandan Buy",comment="Andy short Out")


if short_condition
    strategy.entry("Andy Short",strategy.short, limit=close,comment="Andy short Here")


// strategy.exit("STR","Long",stop=longstoploss)
if Exit_short_condition
    strategy.close("Andy Short",comment="Andy short Out")
    // strategy.entry("Andy fandan Buy",strategy.long, limit=close,comment="Andy 翻單 Buy Here")
    // strategy.close("Andy fandan Short",comment="Andy Buy Out")


inLongTrade = strategy.position_size > 0
inLongTradecolor = #58D68D
notInTrade = strategy.position_size == 0
inShortTrade = strategy.position_size < 0

// bgcolor(color = inLongTrade?color.rgb(76, 175, 79, 70):inShortTrade?color.rgb(255, 82, 82, 70):na)
plotshape(close!=0,location = location.bottom,color = inLongTrade?color.rgb(76, 175, 79, 70):inShortTrade?color.rgb(255, 82, 82, 70):na)


plotshape(long_condition, title='Buy', text='Andy Buy', style=shape.labelup, location=location.belowbar, color=color.new(color.green, 0), textcolor=color.new(color.white, 0), size=size.tiny)
plotshape(short_condition, title='Sell', text='Andy Sell', style=shape.labeldown, location=location.abovebar, color=color.new(color.red, 0), textcolor=color.new(color.white, 0), size=size.tiny)


//atr > close *0.01* parameter

// MONTHLY TABLE PERFORMANCE - Developed by @QuantNomad
// *************************************************************************************************************************************************************************************************************************************************************************
show_performance = input.bool(true, 'Show Monthly Performance ?', group='Performance - credits: @QuantNomad')
prec = input(2, 'Return Precision', group='Performance - credits: @QuantNomad')

if show_performance
    new_month = month(time) != month(time[1])
    new_year  = year(time)  != year(time[1])

    eq = strategy.equity

    bar_pnl = eq / eq[1] - 1

    cur_month_pnl = 0.0
    cur_year_pnl  = 0.0

    // Current Monthly P&L
    cur_month_pnl := new_month ? 0.0 :
                     (1 + cur_month_pnl[1]) * (1 + bar_pnl) - 1

    // Current Yearly P&L
    cur_year_pnl := new_year ? 0.0 :
                     (1 + cur_year_pnl[1]) * (1 + bar_pnl) - 1

    // Arrays to store Yearly and Monthly P&Ls
    var month_pnl  = array.new_float(0)
    var month_time = array.new_int(0)

    var year_pnl  = array.new_float(0)
    var year_time = array.new_int(0)

    last_computed = false

    if (not na(cur_month_pnl[1]) and (new_month or barstate.islastconfirmedhistory))
        if (last_computed[1])
            array.pop(month_pnl)
            array.pop(month_time)

        array.push(month_pnl , cur_month_pnl[1])
        array.push(month_time, time[1])

    if (not na(cur_year_pnl[1]) and (new_year or barstate.islastconfirmedhistory))
        if (last_computed[1])
            array.pop(year_pnl)
            array.pop(year_time)

        array.push(year_pnl , cur_year_pnl[1])
        array.push(year_time, time[1])

    last_computed := barstate.islastconfirmedhistory ? true : nz(last_computed[1])

    // Monthly P&L Table
    var monthly_table = table(na)

    if (barstate.islastconfirmedhistory)
        monthly_table := table.new(position.bottom_center, columns = 14, rows = array.size(year_pnl) + 1, border_width = 1)

        table.cell(monthly_table, 0,  0, "",     bgcolor = #cccccc)
        table.cell(monthly_table, 1,  0, "Jan",  bgcolor = #cccccc)
        table.cell(monthly_table, 2,  0, "Feb",  bgcolor = #cccccc)
        table.cell(monthly_table, 3,  0, "Mar",  bgcolor = #cccccc)
        table.cell(monthly_table, 4,  0, "Apr",  bgcolor = #cccccc)
        table.cell(monthly_table, 5,  0, "May",  bgcolor = #cccccc)
        table.cell(monthly_table, 6,  0, "Jun",  bgcolor = #cccccc)
        table.cell(monthly_table, 7,  0, "Jul",  bgcolor = #cccccc)
        table.cell(monthly_table, 8,  0, "Aug",  bgcolor = #cccccc)
        table.cell(monthly_table, 9,  0, "Sep",  bgcolor = #cccccc)
        table.cell(monthly_table, 10, 0, "Oct",  bgcolor = #cccccc)
        table.cell(monthly_table, 11, 0, "Nov",  bgcolor = #cccccc)
        table.cell(monthly_table, 12, 0, "Dec",  bgcolor = #cccccc)
        table.cell(monthly_table, 13, 0, "Year", bgcolor = #999999)


        for yi = 0 to array.size(year_pnl) - 1
            table.cell(monthly_table, 0,  yi + 1, str.tostring(year(array.get(year_time, yi))), bgcolor = #cccccc)

            y_color = array.get(year_pnl, yi) > 0 ? color.new(color.teal, transp = 40) : color.new(color.gray, transp = 40)
            table.cell(monthly_table, 13, yi + 1, str.tostring(math.round(array.get(year_pnl, yi) * 100, prec)), bgcolor = y_color, text_color=color.new(color.white, 0))

        for mi = 0 to array.size(month_time) - 1
            m_row   = year(array.get(month_time, mi))  - year(array.get(year_time, 0)) + 1
            m_col   = month(array.get(month_time, mi))
            m_color = array.get(month_pnl, mi) > 0 ? color.new(color.teal, transp = 40) : color.new(color.gray, transp = 40)

            table.cell(monthly_table, m_col, m_row, str.tostring(math.round(array.get(month_pnl, mi) * 100, prec)), bgcolor = m_color, text_color=color.new(color.white, 0))
- ゴールデンクロスとボリンジャー帯のモメンタム戦略
- 双 EMA クロスオーバーに基づく量的な取引戦略
- エルダー・レイ・ブル パワー・コンボ・戦略
- 2つの移動平均のクロスオーバー戦略
- 双交差移動平均逆転戦略
- 多要素モメンタム逆転コンボ戦略
- 取引量の標準偏差に基づく取引戦略
- 多時間フレーム適応追跡ストップ損失戦略
- 2倍強指標戦略
- Bollinger Bands と指数関数移動平均をベースにしたトレンド追跡戦略
- 複数のトレンド追跡戦略
- 適応型移動平均量的な戦略
- 戦略をフォローするサイクルのポジション傾向
- モメント ダブル移動平均戦略
- 双向移動平均逆転戦略
- 戦略に従った二線性回帰傾向
- 双方向のブレイクアウト逆転戦略
- 勢いを消す戦略
- 2つの移動平均のクロスオーバー戦略
- 複数のタイムフレームのトレンド追跡日中スキルピング戦略