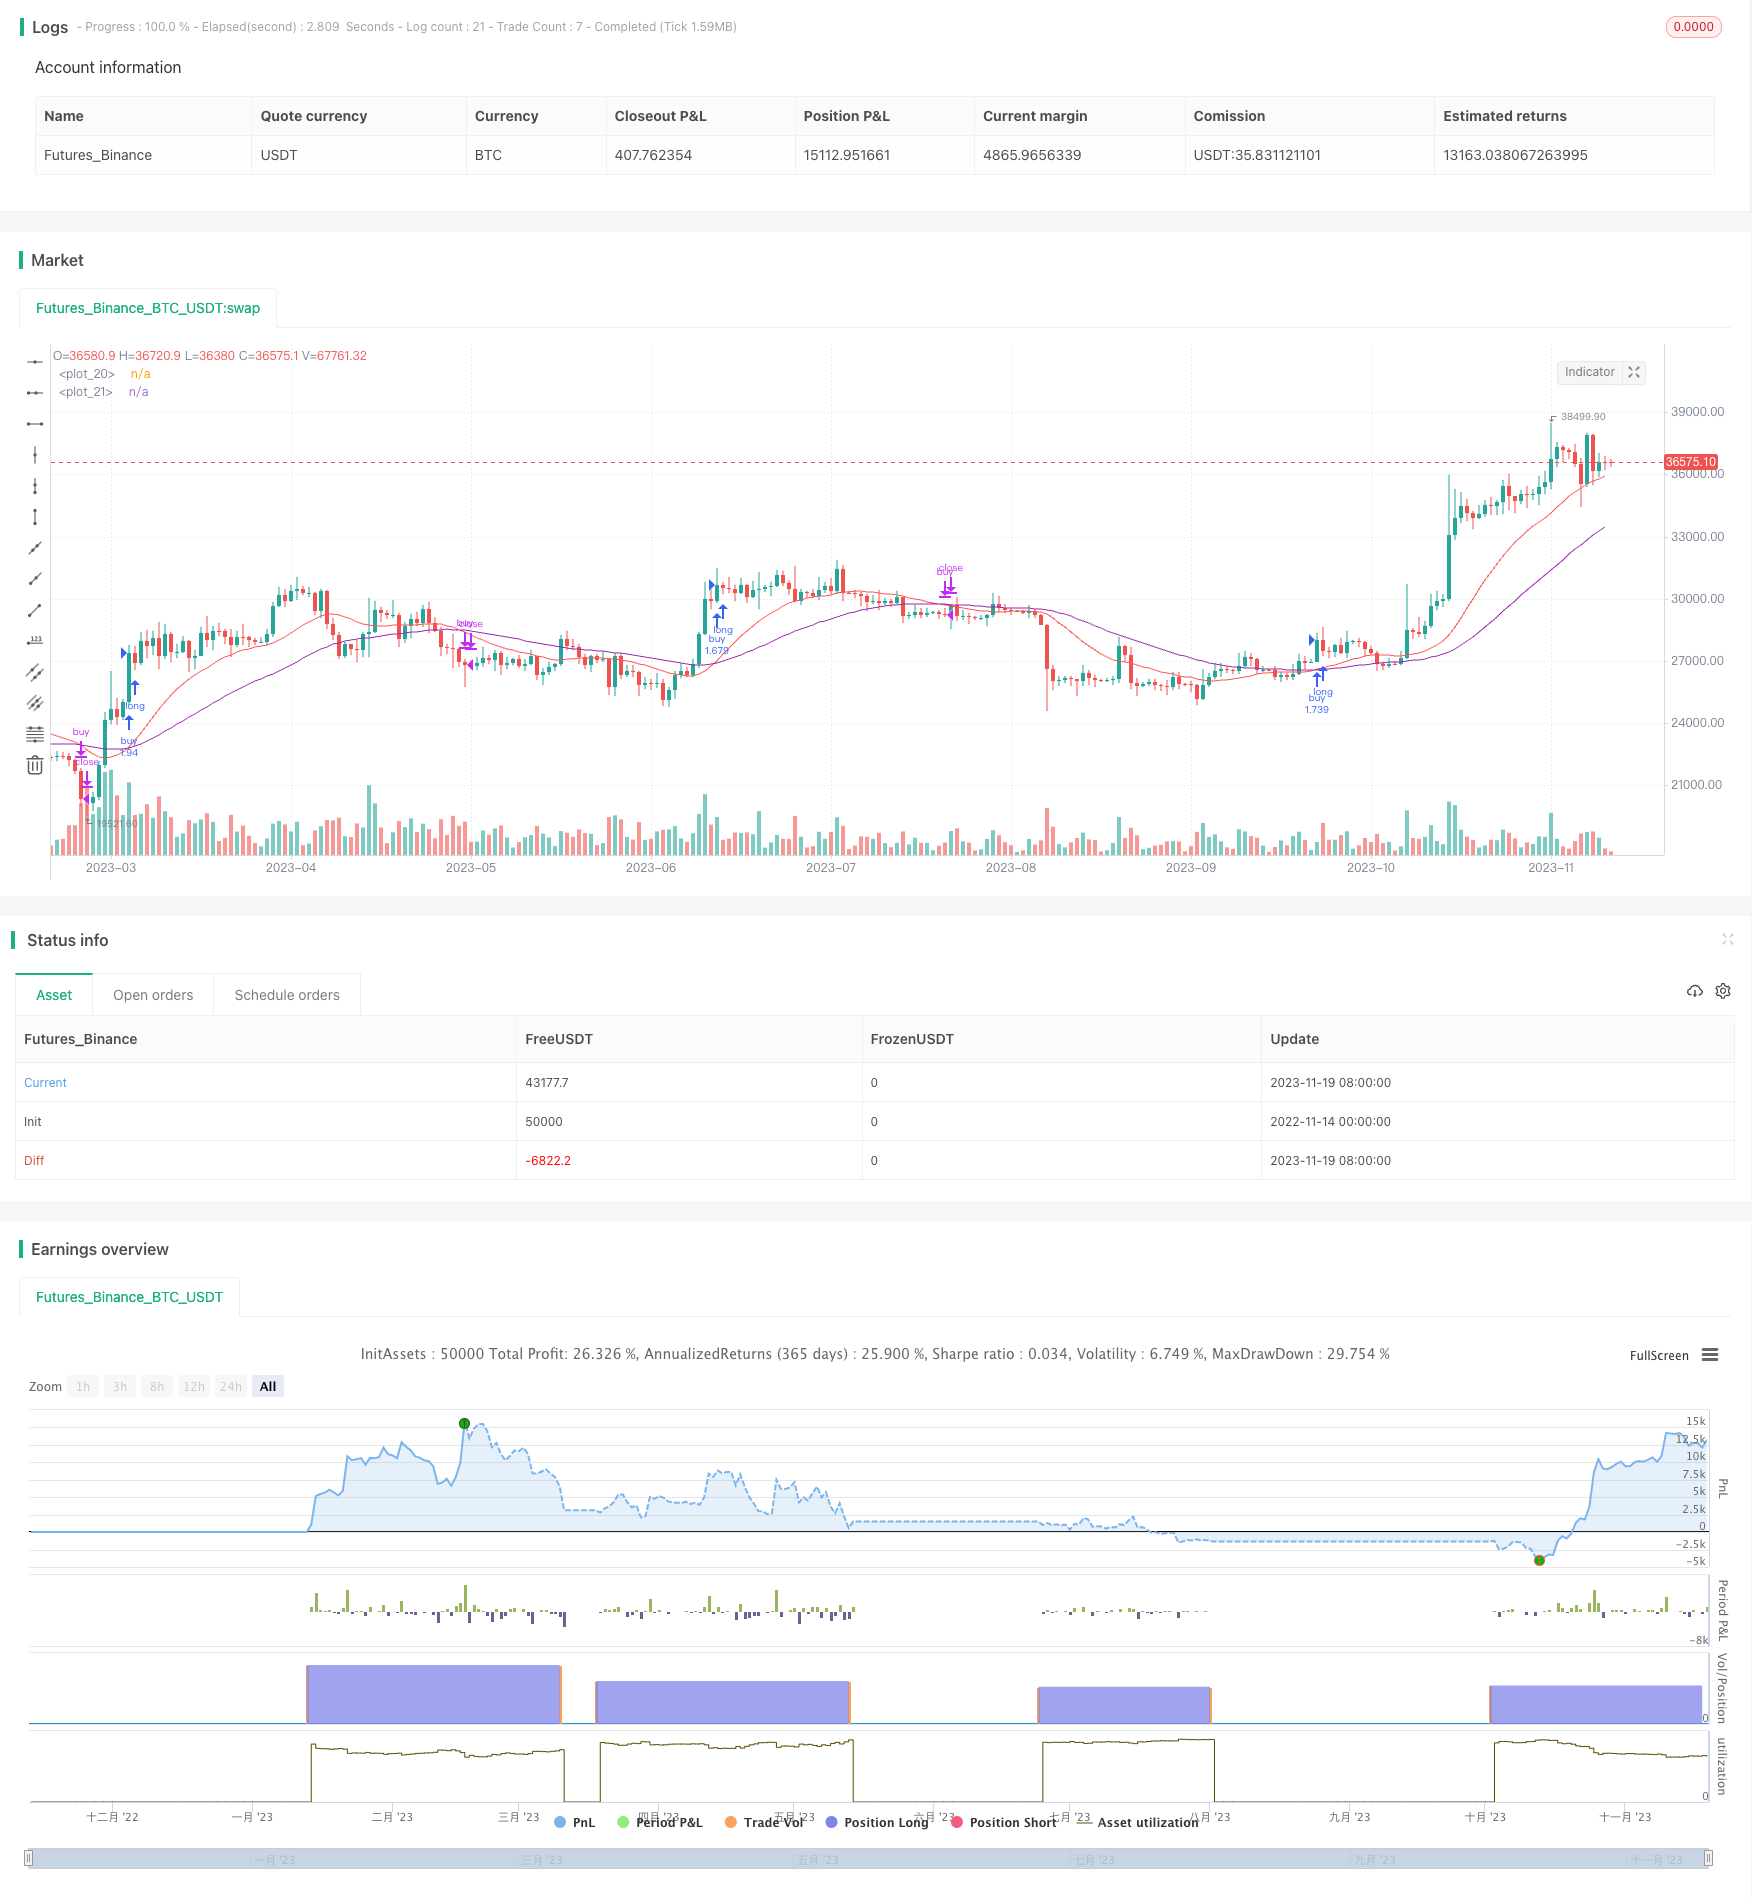
双 EMA クロスオーバーに基づく量的な取引戦略
作者: リン・ハーンチャオチャン,日付: 2023年11月21日 11:41:40タグ:

概要
この戦略は,市場動向を決定するために,異なる期間の2つのEMA線間のクロスオーバーを計算して取引信号を生成する.より短い期間のEMAがより長い期間のEMAを横切ると,上昇傾向を示し,より短い期間のEMAがより長い期間のEMAを横切ると,ダウントレンドを示し,ロングポジションを開く.
原則
この戦略は主にダブルEMAラインの黄金十字と死十字理論を適用する.ダブルEMAラインは長いEMAと短いEMAで構成される.短いEMAパラメータは10日,長いEMAパラメータは21日と設定されている.
ショート EMA がロング EMA を横切ったとき,買い信号が生成される.ショート EMA がロング EMA を横切ったとき,売り信号が生成される.この戦略は成長率の
購入条件は,ショート EMAがロング EMAよりも高く,株の成長率はポジティブな
利点
- 単純性と信頼性のために,EMA線の二重の黄金十字と死十字理論を利用する
- 成長率の
値を追加して,成長が弱いときに誤った取引を避ける. - 最大損失比率を厳格に制御できる
- EMA 期間パラメータは,異なるサイクルに対して柔軟に調整できます.
リスク分析
- EMA線は遅延効果があり,おそらく価格逆転点が欠けている
- ラインクロスオーバーには 遅延があり 最良のエントリーポイントが欠けている可能性があります
- パラメータ最適化に依存し,不適切な設定は過剰取引または不十分な信号を引き起こす可能性があります.
オプティマイゼーションの方向性
- MACD,KDなどの他の指標と組み合わせて信号の精度を向上させる.
- 利益を最大化するために,ストップ損失を遅らせることなどストップ損失戦略を追加します
- 異なる製品で最適な設定のための EMA 期間パラメータを最適化
- ダイナミックパラメータ調整と最適化のためのリアルタイムデータと機械学習方法を組み込む
概要
戦略は比較的シンプルで信頼性があり,価格動向を決定するためにダブルEMAクロスオーバーを使用して,取引信号を生成するために成長率の
/*backtest
start: 2022-11-14 00:00:00
end: 2023-11-20 00:00:00
period: 1d
basePeriod: 1h
exchanges: [{"eid":"Futures_Binance","currency":"BTC_USDT"}]
*/

//@version=3
strategy(title="ema(ema10-21)", overlay=true, pyramiding = 0, default_qty_type = strategy.percent_of_equity, default_qty_value = 100, initial_capital = 15000, commission_type = strategy.commission.percent, commission_value = 0.2)

useTimeLimit    = input(defval = false, title = "Use Start Time Limiter?")
startYear       = input(defval = 2016, title = "Start From Year",  minval = 0, step = 1)
startMonth      = input(defval = 05, title = "Start From Month",  minval = 0,step = 1)
startDay        = input(defval = 01, title = "Start From Day",  minval = 0,step = 1)
startHour       = input(defval = 00, title = "Start From Hour",  minval = 0,step = 1)
startMinute     = input(defval = 00, title = "Start From Minute",  minval = 0,step = 1)

startTimeOk() => true

lenght0 = input(10)
lenght1 = input(21)

source = close

EmaShort = ema(ema(source, lenght0), lenght0)
EmaLong = ema(ema(source, lenght1),lenght1)
plot(EmaShort, color=red)
plot(EmaLong, color=purple)

growth = ((EmaShort-EmaLong)*100)/((EmaShort+EmaLong)/2)
thresholdUp = input(defval=0.05, title="Threshold Up", type=float, step=0.01)
thresholdDown = input(defval=-0.165, title="Threshold Down", type=float, step=0.001)

if( startTimeOk() )
    buy_condition = EmaShort > EmaLong and growth > thresholdUp
    buy_exit_condition = EmaShort < EmaLong and growth < thresholdDown
    strategy.entry("buy", strategy.long, comment="buy", when=buy_condition)
    strategy.close(id='buy', when=buy_exit_condition)
もっと
- コナーズ ダブル移動平均RSI逆転取引戦略
- スーパーグッピー 移動平均取引戦略
- 月射撃 双角三角突破戦略
- フィボナッチ帯振動戦略
- 定量的なジグザック戦略
- クロス移動平均戦略
- 2つの移動平均のクロスオーバー取引戦略
- RSIインジケーターの量的な取引戦略と組み合わせた二重移動平均のクロスオーバー
- 双方向波動性吸収戦略
- ゴールデンクロスとボリンジャー帯のモメンタム戦略
- エルダー・レイ・ブル パワー・コンボ・戦略
- 2つの移動平均のクロスオーバー戦略
- 双交差移動平均逆転戦略
- 多要素モメンタム逆転コンボ戦略
- 取引量の標準偏差に基づく取引戦略
- 多時間フレーム適応追跡ストップ損失戦略
- 2倍強指標戦略
- Bollinger Bands と指数関数移動平均をベースにしたトレンド追跡戦略
- 戦略をフォローするタイムフレーム間のモメンタム回転傾向
- 複数のトレンド追跡戦略