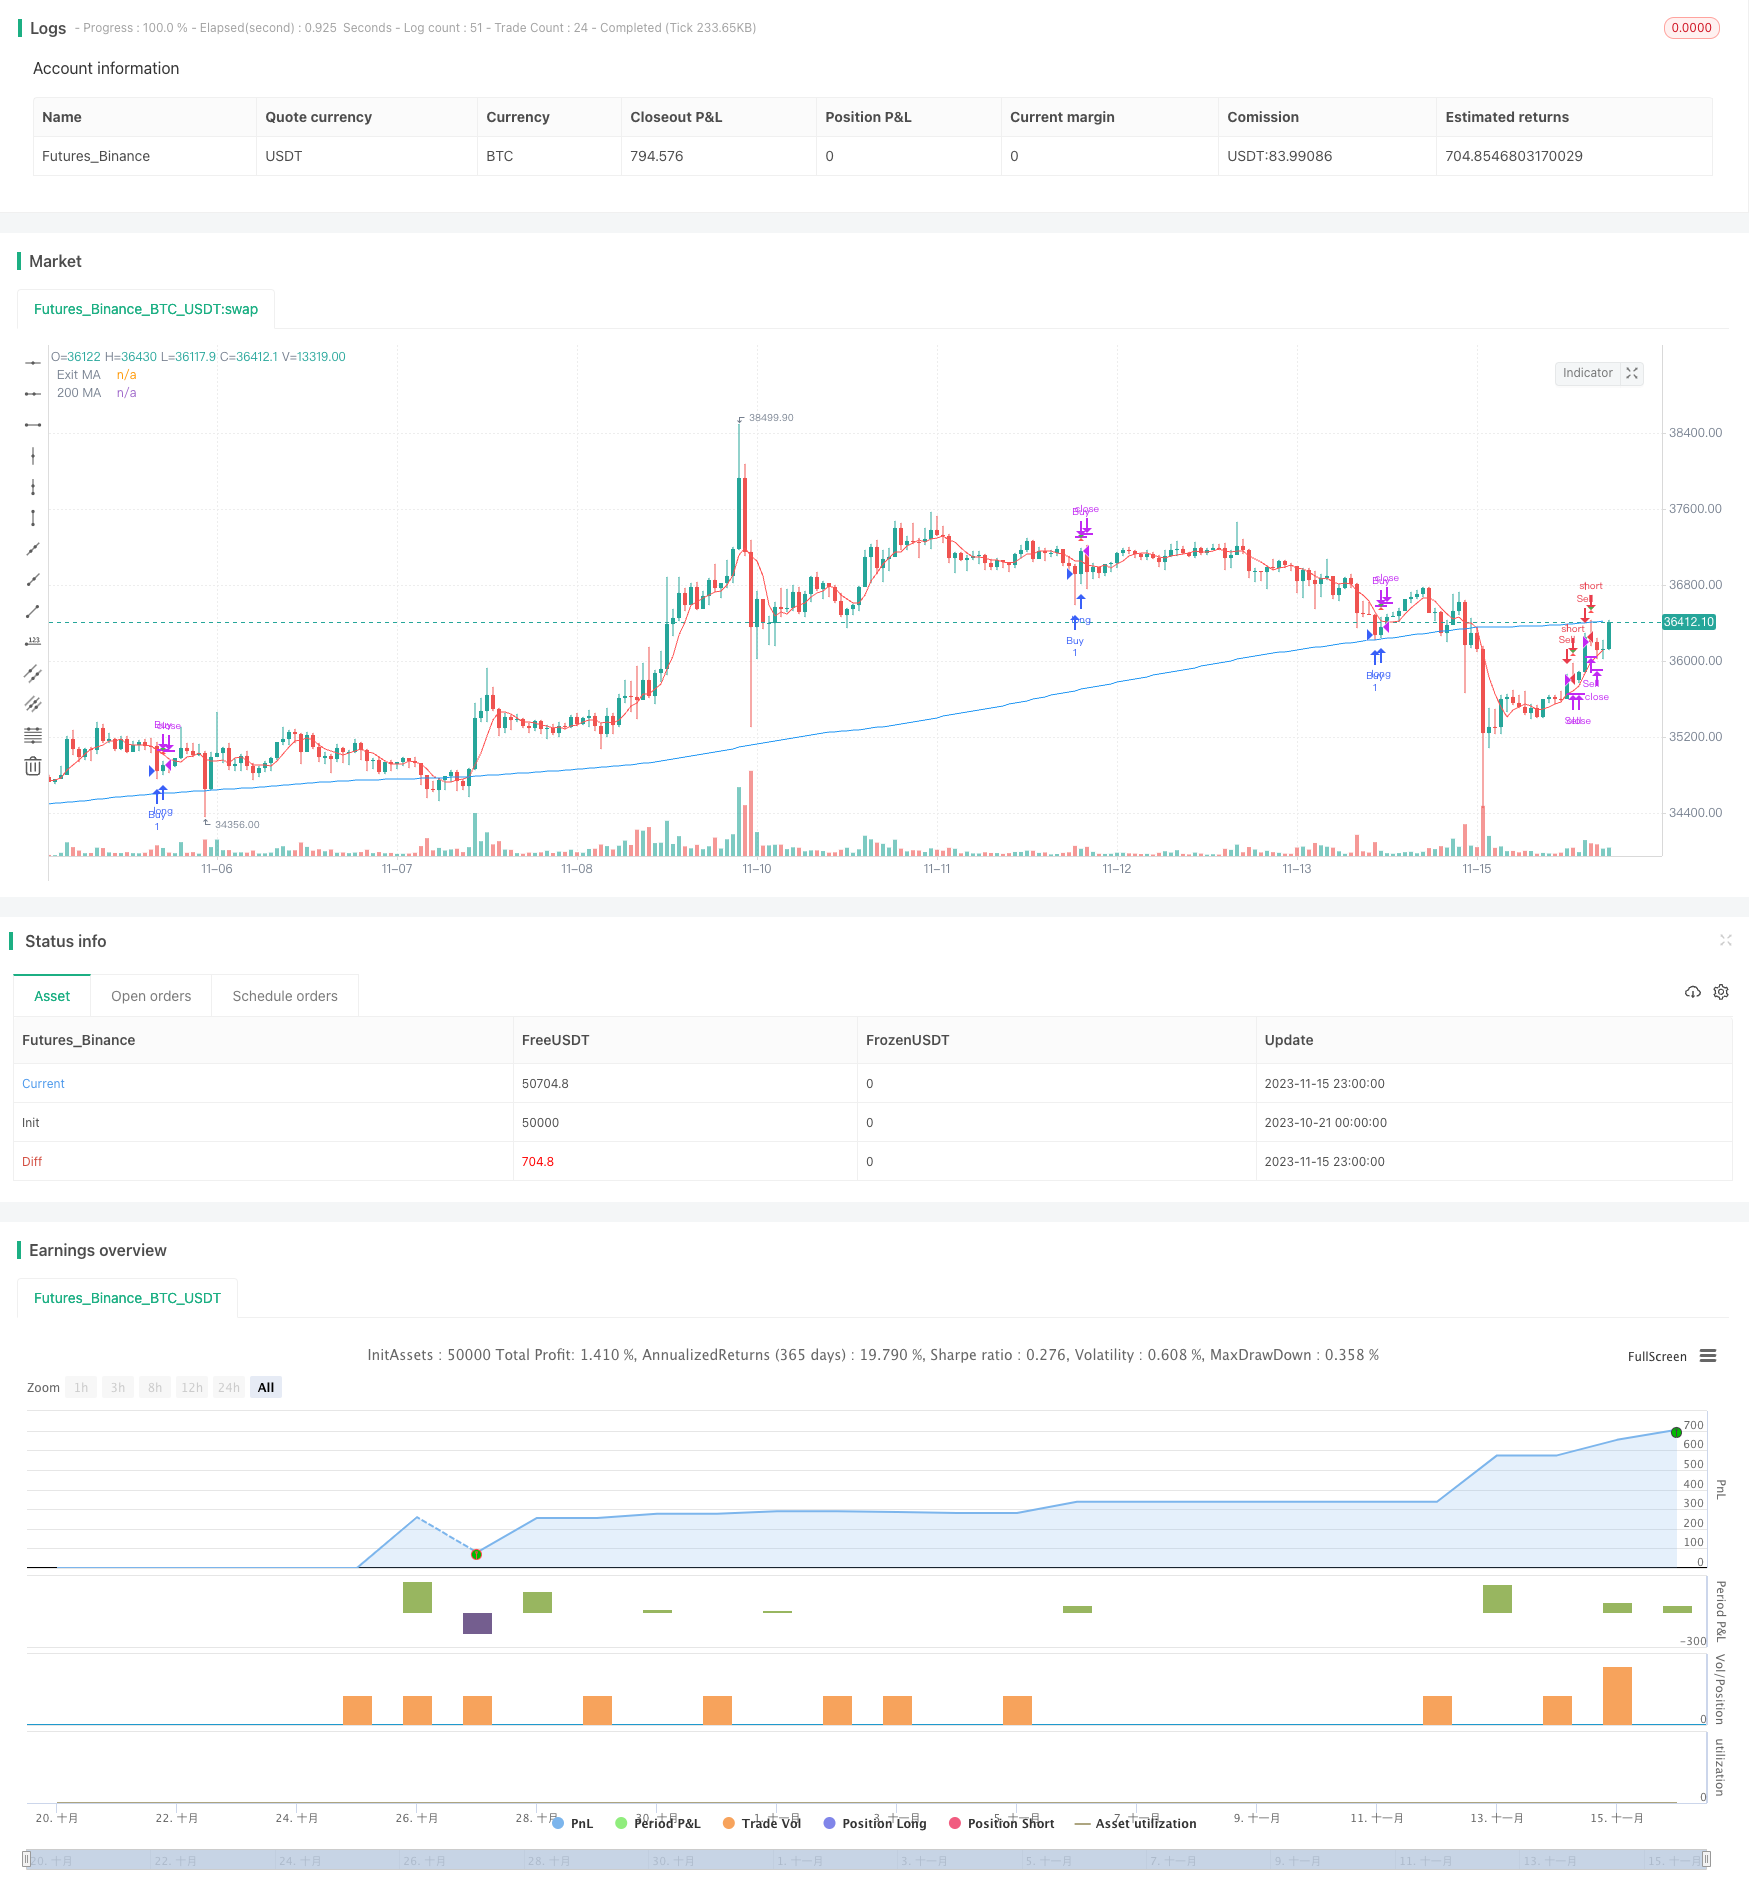
概述
康纳双均线RSI反转交易策略结合了相对强弱指数(RSI)和双均线,以寻找高概率的反转交易机会。当短期和长期趋势反向时,该策略判断行情即将发生转折并建立头寸。
策略原理
该策略同时利用RSI和双均线判断市场趋势。首先,计算2周期的RSI,判断短期趋势反转。其次,计算200周期移动平均线,判断长期趋势方向。当短期RSI从超买/超卖区域反弹,并且与长期趋势反向时,说明行情即将发生反转,建立交易头寸。
入场信号:RSI小于超卖区域(默认5)并且短期价格高于长期价格时做多;RSI大于超买区域(默认95)并且短期价格低于长期价格时做空。
出场信号:5周期短期均线发出持仓方向与入场相反的信号时离场;或止损(默认损失3%)。
策略优势分析
该策略结合多种指标判断市场结构,可以提高交易的准确率。具体优势如下:
- 利用RSI判断短期反转点,移动平均线过滤反转信号的可靠性
- 双均线形成强势筛选,避免钝化
- 短期均线再次验证反转信号,确保高概率出场
- 风险控制到位,有止损机制
策略风险分析
该策略也存在一些风险:
- 市场剧烈波动时,RSI指标发出错误信号的概率较大
- 多指标组合判断,参数优化比较复杂
- 反转不一定成功,需要及时止损
策略优化方向
该策略可以从以下几个方面进行优化:
- 优化RSI参数,寻找最佳反转参数组合
- 测试不同类型的移动平均线参数
- 优化止损策略,寻找最佳止损点
- 增加趋势判断指标,避免反转失败
总结
康纳双均线RSI反转交易策略,通过RSI反转信号与双均线过滤,在高概率位置捕捉行情反转。该策略利用多种指标判断,可以有效提高交易策略的稳定性。下一步,通过参数优化和风险控制的改进,有望进一步扩大策略优势,获取更高的交易效率。
策略源码
/*backtest
start: 2023-10-21 00:00:00
end: 2023-11-16 00:00:00
period: 1h
basePeriod: 15m
exchanges: [{"eid":"Futures_Binance","currency":"BTC_USDT"}]
*/

//@version=5
strategy("Connors RSI-MA Strategy", overlay=true)

// Strategy parameters
rsiLength = input(2, title="RSI Length")
maLength = input(200, title="MA Length")
exitMaLength = input(5, title="Exit MA Length")
overboughtThreshold = input(95, title="Overbought Threshold")
oversoldThreshold = input(5, title="Oversold Threshold")
stopLossPercentage = input(3, title="Stop Loss Percentage")

// 2-period RSI
rsi2 = ta.rsi(close, rsiLength)

// 200-period MA
ma200 = ta.sma(close, maLength)

// 5-period MA for exit signals
ma5_exit = ta.sma(close, exitMaLength)

// Positive trend condition
positiveTrend = close > ma200

// Negative trend condition
negativeTrend = close < ma200

// Buy and sell conditions
buyCondition = rsi2 < oversoldThreshold and positiveTrend
sellCondition = rsi2 > overboughtThreshold and negativeTrend

// Exit conditions
exitLongCondition = close > ma5_exit
exitShortCondition = close < ma5_exit

// Stop Loss
stopLossLevelLong = strategy.position_avg_price * (1 - stopLossPercentage / 100)
stopLossLevelShort = strategy.position_avg_price * (1 + stopLossPercentage / 100)

// Strategy logic
if (buyCondition)
    strategy.entry("Buy", strategy.long)

if (sellCondition)
    strategy.entry("Sell", strategy.short)

if (exitLongCondition or close >= stopLossLevelLong)
    strategy.close("Buy")

if (exitShortCondition or close <= stopLossLevelShort)
    strategy.close("Sell")

// Plotting
plot(ma200, title="200 MA", color=color.blue)
plot(ma5_exit, title="Exit MA", color=color.red)

// Plot stop loss levels
plotshape(series=stopLossLevelLong, title="Long Stop Loss", color=color.green, style=shape.triangledown, size=size.small)
plotshape(series=stopLossLevelShort, title="Short Stop Loss", color=color.red, style=shape.triangleup, size=size.small)
更多内容