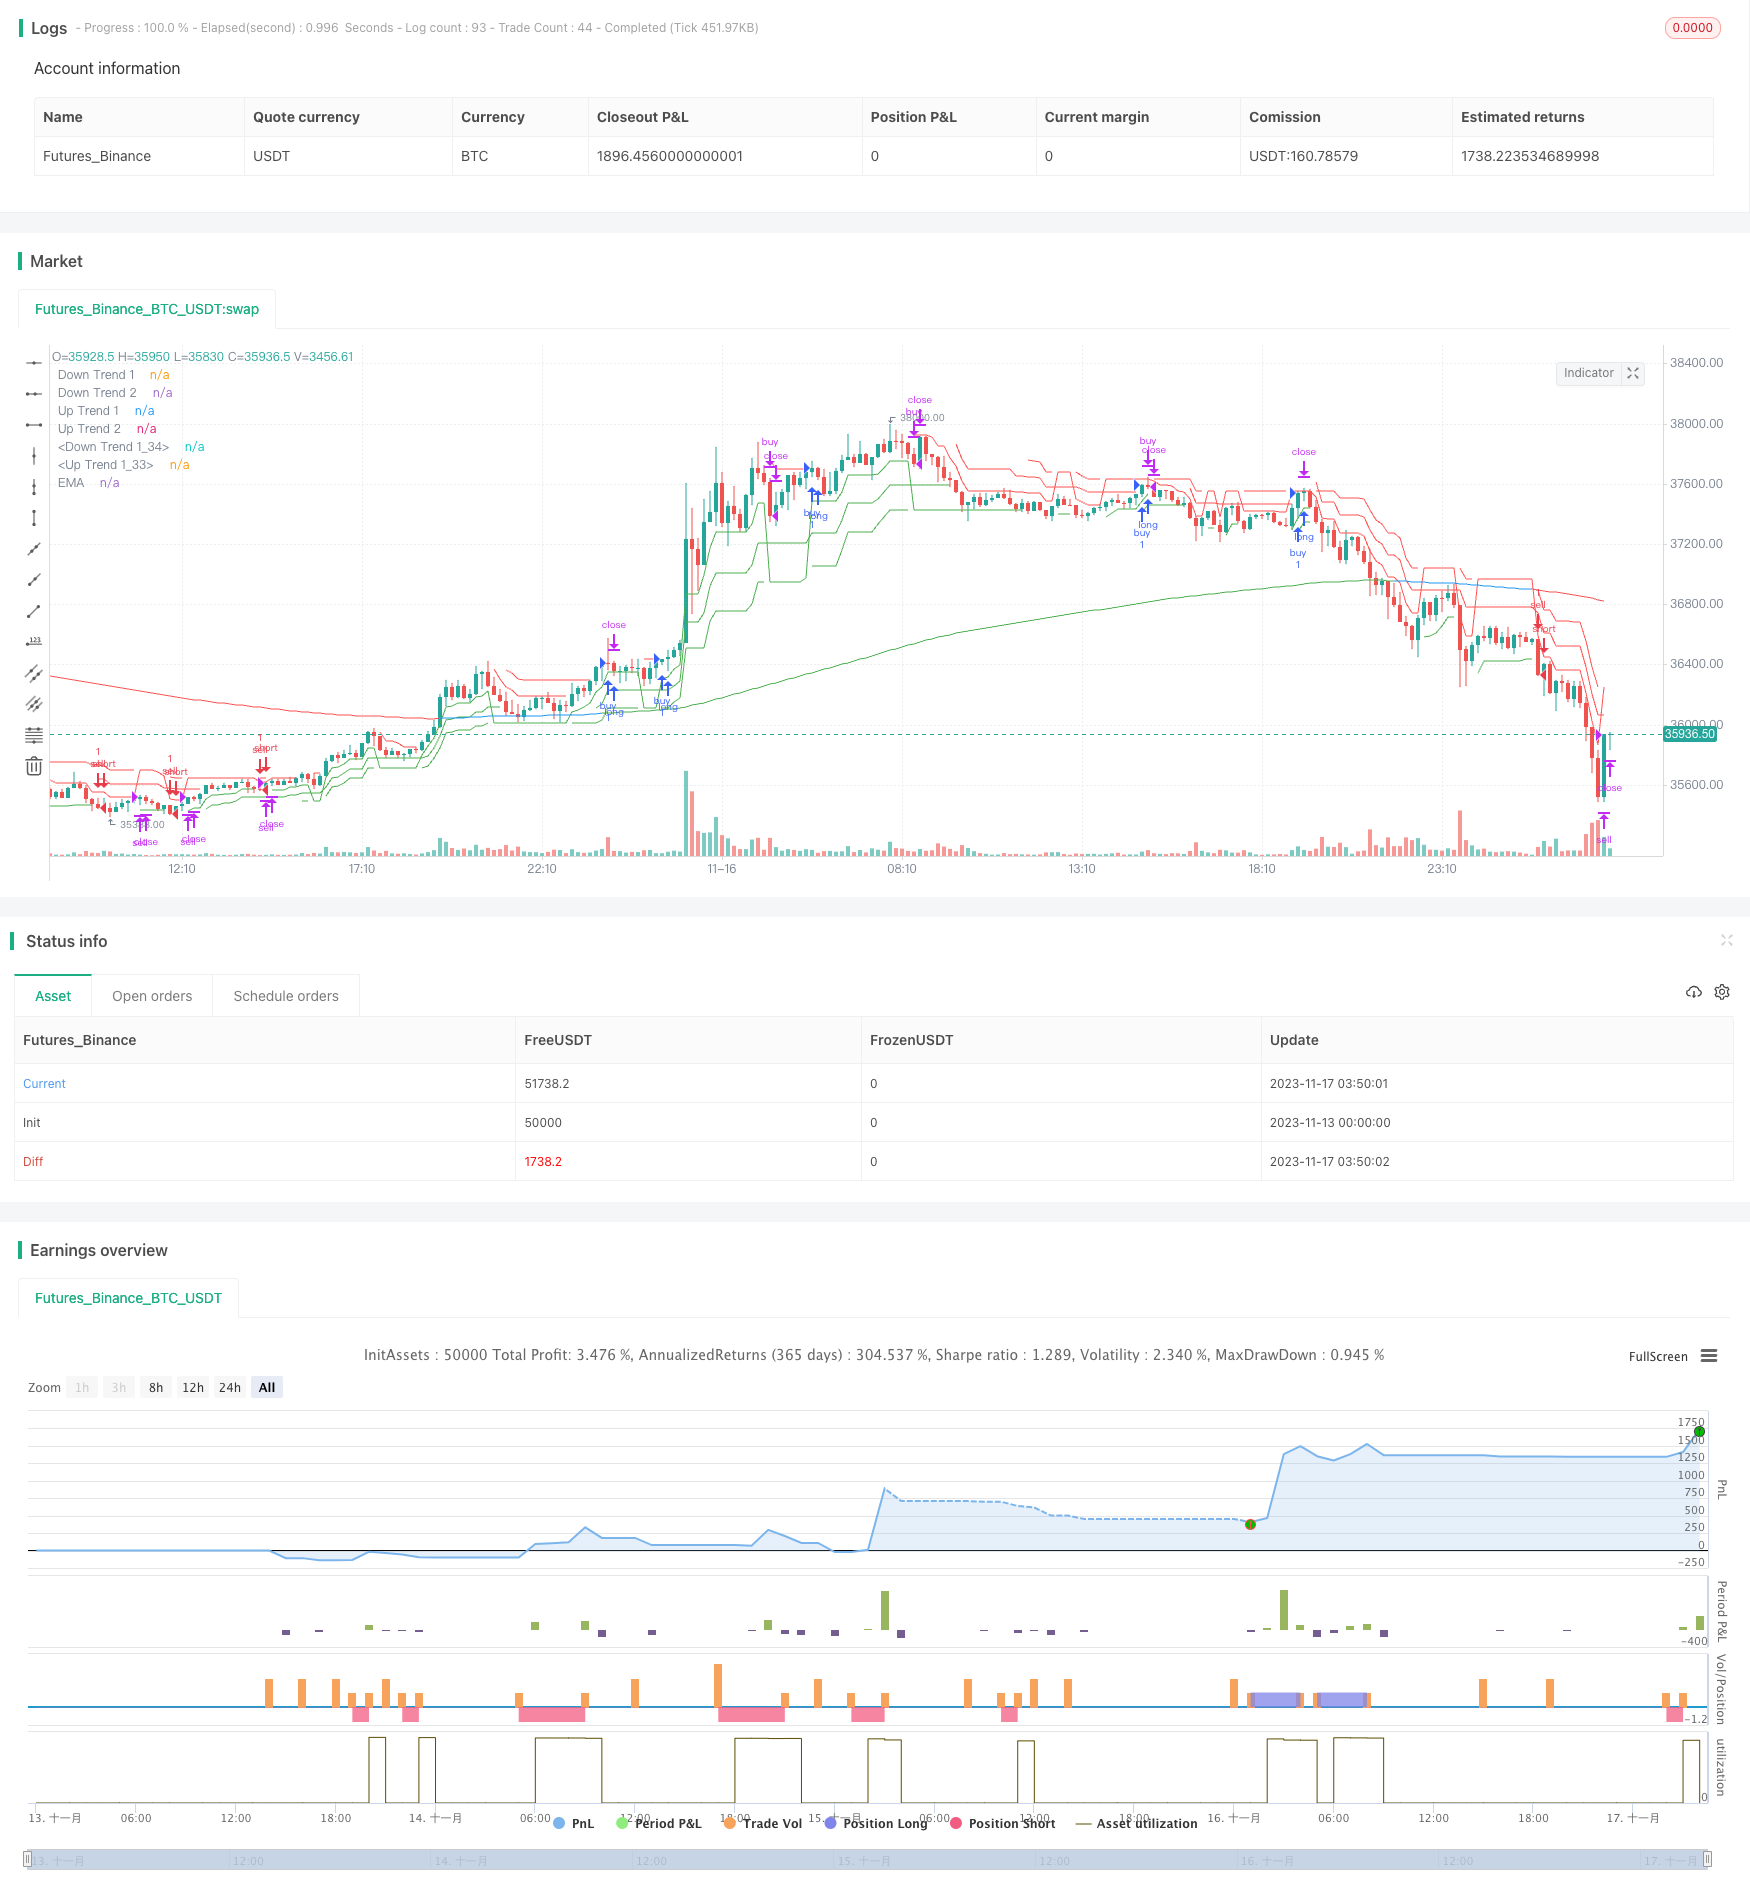
ムーンライトトラッカーダブルトライアングルブレイクアウト戦略

概要
この戦略は,二重三角通路を構築し,超トレンド指標と組み合わせて価格突破の方向を判断することによって,高い勝利率の追跡突破操作を実現する.この戦略は,EMAと組み合わせて市場の全体的な傾向を判断し,揺れの中での無効取引を避ける.
戦略原則
価格の短期,中期,および長期の方向性を判断するために,3つの異なるパラメータのスーパートレンド指標を構築する.
ListEntryとExit信号として,上下チャネルを突破したかどうかを判断する双三角チャネル.
233周期のEMAを組み合わせて,全体的なトレンド方向を判断する.価格は,EMA多頭市場を突破して上向きの通路を突破するためにより多くのことをする必要があり,空頭市場を突破して下向きの通路を突破するために空席を空けます.
3つの超トレンド指標を組み合わせて,ストップとストップの信号を判断します. 2つ以上の指標が色を変えたときにストップまたはストップを平定します.
戦略的優位性
双三角通路は,多時間周期判断と組み合わせて,トレンドの突破を正確に捕捉することができる.
複数の条件で選択することで,無効取引を回避し,勝利率を上げることができます.
ダイナミック・トラッキング・ストップ・ストップ・損失,撤回リスクを低減する.
簡単なパラメータ設定,使いやすい.
リスクと最適化
大周期的な振動市場では,しばしばポジションを開設され,その後停止される状況が起こりうる.ATR周期パラメータを適切に調整して,ポジション開設頻度を低下させることができる.
EMA周期が短すぎると,全体的なトレンドを判断できず,長すぎると追跡感度が低下する.最適なEMAパラメータを決定するためのテストが推奨される.
ストップ・ロスのレベルは,市場の波動幅の変化を動的に追跡することができないので,人工介入による調整が必要である. 後期にはATRの動的な調整とストップ・ロスの距離を組み合わせて検討することができる.
要約する
月光トラッカー双三角突破戦略は,超トレンド指標と双三角通路の組み合わせにより,強力な突破を正確に捕捉することが可能である.同時に,多層のフィルタリング機構は,無効な信号をフィルタリングし,高い勝利率を持つ.単純なパラメータ設定は,使用しやすくする.ブースターパラメータとストップストップの設計を最適化することによって,戦略の追跡効果とリスク管理能力をさらに強化することができる.
/*backtest
start: 2023-11-13 00:00:00
end: 2023-11-17 04:00:00
period: 10m
basePeriod: 1m
exchanges: [{"eid":"Futures_Binance","currency":"BTC_USDT"}]
*/

// @version=5
// author=theasgard and moonshot-indicator (ms)
// year 2021
//
// This is a well knowen strategy by using 3 different Supertrends and a trend-defining EMA,
// feel free to play around with the settings, a backtest on 8h ETHUSDT pair brought some good results using
// the 233EMA and investing 75% of a 10k start capital
//
// the idea is to have at least 2 supertrnds going green above the trend-EMA to go long and exit by turning
// 2 supertrends red (idea: 1 supertrend in red could initialize a take profit)
// shorts work vice versa
// The EMA shows in green for uptrends and in red for downtrends, if it is blue no Signal will be taken because
// the 3 supertrends are not all above or below the trendline(EMA)

strategy("ms hypertrender", overlay=true)

// set up 3 supertrendlines and colour the direction up/down
atrPeriod1 = input(10, "ATR Length 1")
factor1 = input.float(1.0, "ATR Factor 1", step = 0.01)
[supertrend1, direction1] = ta.supertrend(factor1, atrPeriod1)
upTrend1 = plot(direction1 < 0 ? supertrend1 : na, "Up Trend 1", color = color.green, style=plot.style_linebr)
downTrend1 = plot(direction1 < 0? na : supertrend1, "Down Trend 1", color = color.red, style=plot.style_linebr)

atrPeriod2 = input(11, "ATR Length 2")
factor2 = input.float(2.0, "ATR Factor 2", step = 0.01)
[supertrend2, direction2] = ta.supertrend(factor2, atrPeriod2)
upTrend2 = plot(direction2 < 0 ? supertrend2 : na, "Up Trend 2", color = color.green, style=plot.style_linebr)
downTrend2 = plot(direction2 < 0? na : supertrend2, "Down Trend 2", color = color.red, style=plot.style_linebr)

atrPeriod3 = input(12, "ATR Length 3")
factor3 = input.float(3.0, "ATR Factor 3", step = 0.01)
[supertrend3, direction3] = ta.supertrend(factor3, atrPeriod3)
upTrend3 = plot(direction3 < 0 ? supertrend3 : na, "Up Trend 1", color = color.green, style=plot.style_linebr)
downTrend3 = plot(direction3 < 0? na : supertrend3, "Down Trend 1", color = color.red, style=plot.style_linebr)

//set up the trend dividing EMA and color uptrend nutreal downtrend
len = input.int(233, minval=1, title="Trend-EMA Length")
src = input(close, title="Source")
offset = input.int(title="Offset", defval=0, minval=-500, maxval=500)

//general Bull or Bear Trend? Visualized by ema
ematrend = ta.ema(src, len)
generaluptrend = supertrend1 > ematrend and supertrend2 > ematrend and supertrend3 > ematrend
generaldowntrend = supertrend1 < ematrend and supertrend2 < ematrend and supertrend3 < ematrend
emacolor = if generaluptrend
    color.green
else if generaldowntrend
    color.red
else
    color.blue
plot(ematrend, title="EMA", color=emacolor, offset=offset)

// Bullish? min 2 supertrends green
bullish = (direction1 < 0 and direction2 < 0) or (direction1 < 0 and direction3 < 0) or (direction2 < 0 and direction3 < 0) and generaluptrend
extremebullish = direction1 < 0 and direction2 < 0 and direction3 < 0 and generaluptrend //all 3 green

// Bearish? min 2 supertrends red
bearish = (direction1 > 0 and direction2 > 0) or (direction1 > 0 and direction3 > 0) or (direction2 > 0 and direction3 > 0) and generaldowntrend
extremebearish = direction1 > 0 and direction2 > 0 and direction3 > 0 and generaldowntrend //all 3 red

// Open Long
//plotchar(((bullish and not bullish[1]) or (extremebullish and not extremebullish[1])) and (emacolor==color.green)? close : na, title = 'Start Long', char='▲', color = #80eb34, location = location.belowbar, size = size.small)

// TP 10% Long
TP10long = ((generaluptrend and bullish[1]) or (generaluptrend and extremebullish[1])) and (direction1 > 0 or direction2 > 0 or direction3 > 0)
//plotchar(TP10long and not TP10long[1]? close : na, title = 'TP on Long', char='┼', color = #ffd000, location = location.abovebar, size = size.tiny)

// Exit Long
//plotchar(extremebearish and not extremebearish[1] or bearish and not bearish[1]? close : na, title = 'Close all Longs', char='Ꭓ', color = #ff0037, location = location.abovebar, size = size.tiny)

// Open Short
//plotchar(((bearish and not bearish[1]) or (extremebearish and not extremebearish[1])) and (emacolor==color.red)? close : na, title = 'Start Short', char='▼', color = #0547e3, location = location.abovebar, size = size.small)

// TP 10% Short
TP10short = ((generaldowntrend and bearish[1]) or (generaldowntrend and extremebearish[1])) and (direction1 < 0 or direction2 < 0 or direction3 < 0)
//plotchar(TP10short and not TP10short[1]? close : na, title = 'TP on Short', char='┼', color = #ffd000, location = location.belowbar, size = size.tiny)

// Exit Short
//plotchar(extremebullish and not extremebullish[1] or bullish and not bullish[1]? close : na, title = 'Close all Shorts', char='Ꭓ', color = #ff0037, location = location.belowbar, size = size.tiny)

// Set stop loss level with input options (optional)
longLossPerc = input.float(title="Long Stop Loss (%)",
     minval=0.0, step=0.1, defval=1) * 0.01

shortLossPerc = input.float(title="Short Stop Loss (%)",
     minval=0.0, step=0.1, defval=1) * 0.01

// Determine stop loss price
longStopPrice  = strategy.position_avg_price * (1 - longLossPerc)
shortStopPrice = strategy.position_avg_price * (1 + shortLossPerc)

openlong = (((bullish and not bullish[1]) or (extremebullish and not extremebullish[1])) and (emacolor==color.green))
openshort = (((bearish and not bearish[1]) or (extremebearish and not extremebearish[1])) and (emacolor==color.red))
exitlong = (extremebearish and not extremebearish[1] or bearish and not bearish[1]) or TP10long
exitshort = (extremebullish and not extremebullish[1] or bullish and not bullish[1]) or TP10short
strategy.entry("buy", strategy.long, when=openlong)
strategy.entry("sell", strategy.short, when=openshort)

strategy.close("buy", when=exitlong)
strategy.close("sell", when=exitshort)

// Submit exit orders based on calculated stop loss price
if (strategy.position_size > 0)
    strategy.exit(id="Long Stop", stop=longStopPrice)

if (strategy.position_size < 0)
    strategy.exit(id="Short Stop", stop=shortStopPrice)