複数の移動平均値に基づくトレンド逆転戦略
作者: リン・ハーンチャオチャン,日付: 2023年11月21日 14:53:48タグ:

概要
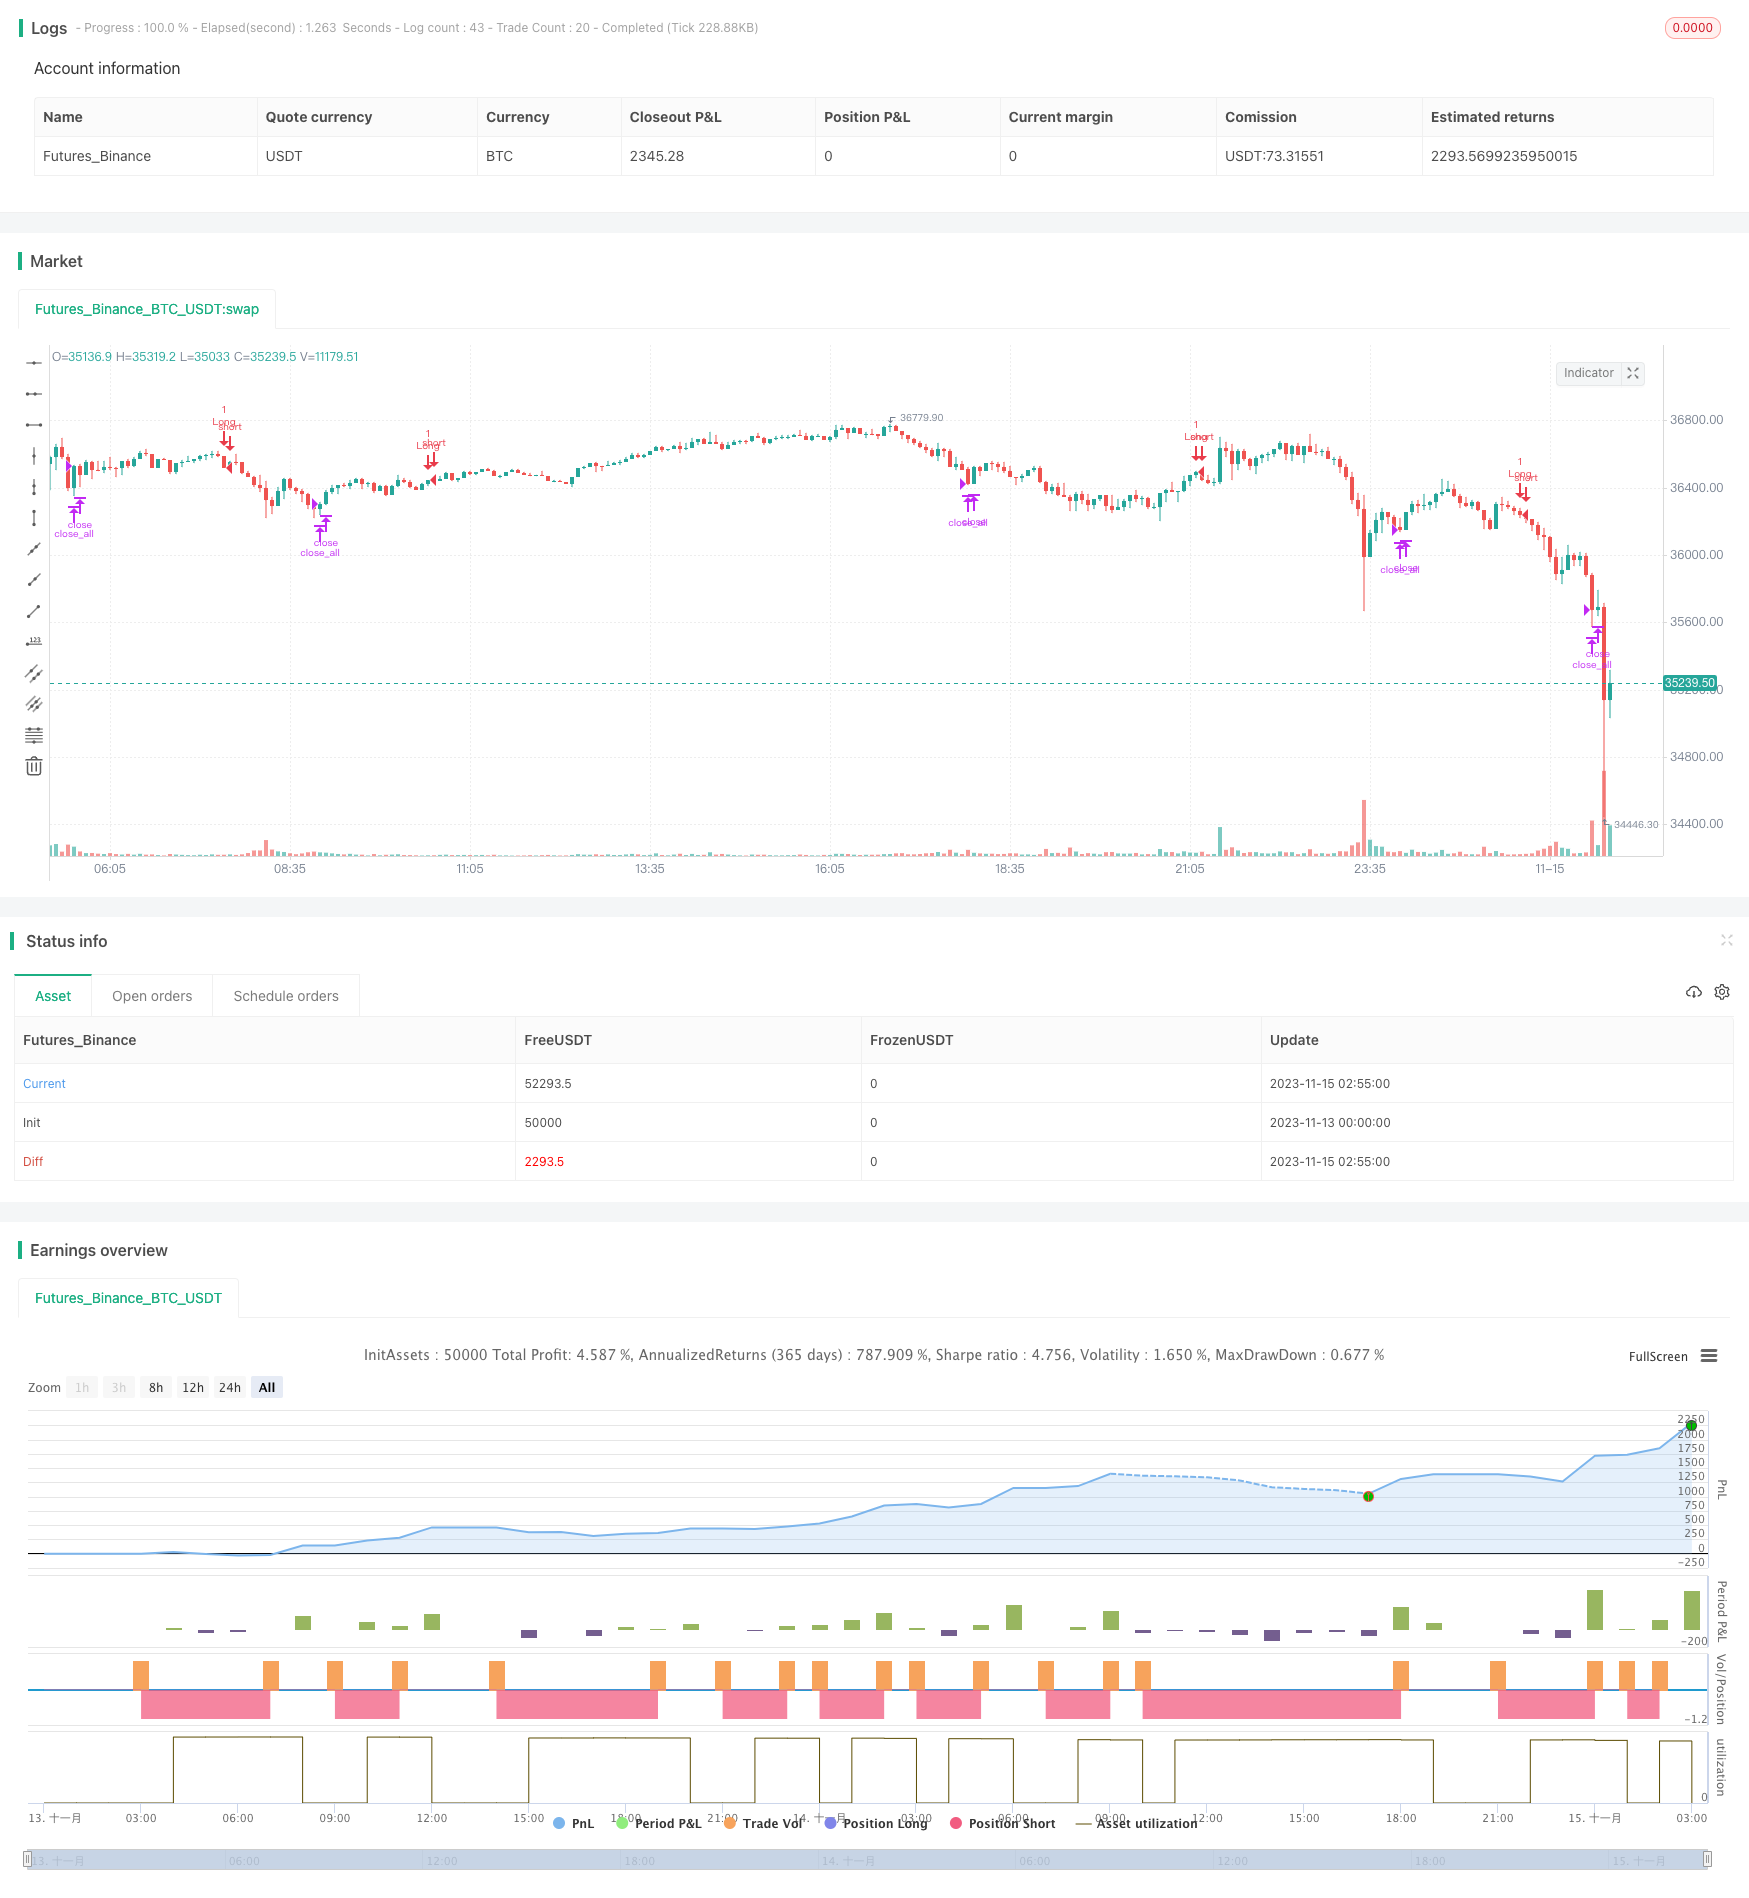
この戦略は,TDI,TCF,TTFおよびTIIを含む複数のトレンドインジケーターの逆転に基づいた購入および売却信号を生成する.この戦略は,エントリーと出口に使用するインジケーター信号を選択することを可能にします.
戦略の論理
-
TDI インディケーター
TDI インディケーターは,合計およびスムージング技術による価格動向を使用して構築されます. TDI 方向が TDI 線の上を横切ると長くなって,下を横切ると退きます.
-
TCF インディケーター
TCFインジケーターは,上昇力と下落力を測定するために,前向きと負の価格変化を測定します.前向きの変化が負の変化よりも大きい場合,長引きます.そうでなければ,終了します.
-
TTF インディケーター
TTFインジケーターは,トレンドを決定するために最高値と最低値の力を比較する.TTFが100を超えるとロングシグナルが表示され, -100を下回ると出口が表示される.
-
TII インディケーター
TIIは,トレンド逆転を特定するために移動平均値と価格帯を組み合わせます.短期的および長期的トレンドの両方を考慮します.ロングシグナルが80以上で,出口は80以下です.
入力長距離と近距離ロジックは,設定されたインジケーターに基づいて適切な信号を選択します.
利点
戦略には,一般的に使用されるトレンド取引指標がいくつか含まれ,変化する市場状況に適応する柔軟性があります. 具体的な利点:
- トレンド逆転の機会を,逆転信号を使用して,迅速に把握する.
- 異なる指標の設定によって最適化可能
- 信号の確認のために豊富な指標組み合わせを使用できます
リスク
この戦略が直面する主なリスクは
- インディケーター・シグナルには 誤った信号があり 損失を起こす可能性があります
- 個々の指標は,トレンドを完全に判断できず,市場の騒音に敏感です
- インディケーターや取引パラメータの誤った構成は,市場を誤って解釈し,誤った取引を生む可能性があります.
リスクは以下によって軽減できます.
- 最適な組み合わせを見つけるために指標パラメータを最適化
- 品質向上のために複数の指標信号の確認を要求する
- 単一の取引損失を制御するためにポジションのサイズ調整
増進 の 機会
この戦略は,いくつかの分野において強化できる.
- 異なる市場サイクルで最適な指標とパラメータをテストする
- 最適な組み合わせを見つけるために指標を追加または減らします
- 偽信号をフィルタリングする
- ポジションサイズ戦略を最適化する.例えば,変数サイズ,ストップ損失を後押しする
- 信号品質を助けるための機械学習スコアを組み込む
結論
この戦略は,複数のトレンド逆転指標と最適化構成を組み合わせることで,トレンドターニングポイントで動作するための異なる市場環境に適応できます.鍵はリスクを制御しながら最適なパラメータと指標を見つけることです.継続的な最適化と検証により,安定したアルファ戦略を構築できます.
/*backtest
start: 2023-11-13 00:00:00
end: 2023-11-15 03:00:00
period: 5m
basePeriod: 1m
exchanges: [{"eid":"Futures_Binance","currency":"BTC_USDT"}]
*/

//@version=4
//
// This source code is subject to the terms of the Mozilla Public License 2.0 at https://mozilla.org/MPL/2.0/
// © kruskakli
//
// Here is a collection of Trend Indicators as defined by M.H Pee and presented
// in various articles of the "STOCKS & COMMODITIES Magazine"
//
// The actual implementation of the indicators here are made by: everget
//
// I have gather them here so that they easily can be tested.
//
// My own test was made using 15 companies from the OMXS30 list
// during the time period of 2016-2018, and I only went LONG.
//
// The result was as follows:
//
//        Average    Std.Dev
//        profit
//  TDI    3.04%      5.97
//  TTF    1.22%.     5.73
//  TII    1.07%      6.2
//  TCF    0.32%      2.68
//
strategy("M.H Pee indicators", overlay=true)


use = input(defval="TDI", title="Use Indicator", type=input.string,
             options=["TDI","TCF","TTF","TII"])

src = close


//
// TDI
//
length = input(title="Length", type=input.integer, defval=20)
mom = change(close, length)
tdi = abs(sum(mom, length)) - sum(abs(mom), length * 2) + sum(abs(mom), length)
// Direction Indicator
tdiDirection = sum(mom, length)
tdiLong = crossover(tdiDirection, tdi)
tdiXLong = crossunder(tdiDirection, tdi)

//
// TCF
//
tcflength = input(title="Length", type=input.integer, defval=35)

plusChange(src) =>
    change_1 = change(src)
    change(src) > 0 ? change_1 : 0.0
minusChange(src) =>
    change_1 = change(src)
    change(src) > 0 ? 0.0 : -change_1

plusCF = 0.0
plusChange__1 = plusChange(src)
plusCF := plusChange(src) == 0 ? 0.0 : plusChange__1 + nz(plusCF[1])

minusCF = 0.0
minusChange__1 = minusChange(src)
minusCF := minusChange(src) == 0 ? 0.0 : minusChange__1 + nz(minusCF[1])

plusTCF = sum(plusChange(src) - minusCF, tcflength)
minusTCF = sum(minusChange(src) - plusCF, tcflength)

tcfLong = plusTCF > 0
tcfXLong = plusTCF < 0

//
// TTF
//
ttflength = input(title="Lookback Length", type=input.integer, defval=15)

hh = highest(length)
ll = lowest(length)

buyPower = hh - nz(ll[length])
sellPower = nz(hh[length]) - ll

ttf = 200 * (buyPower - sellPower) / (buyPower + sellPower)

ttfLong = crossover(ttf, 100)
ttfXLong = crossunder(ttf, -100)

//
// TII
//
majorLength = input(title="Major Length", type=input.integer, defval=60)
minorLength = input(title="Minor Length", type=input.integer, defval=30)
upperLevel = input(title="Upper Level", type=input.integer, defval=80)
lowerLevel = input(title="Lower Level", type=input.integer, defval=20)

sma = sma(src, majorLength)

positiveSum = 0.0
negativeSum = 0.0

for i = 0 to minorLength - 1 by 1
    price = nz(src[i])
    avg = nz(sma[i])
    positiveSum := positiveSum + (price > avg ? price - avg : 0)
    negativeSum := negativeSum + (price > avg ? 0 : avg - price)
    negativeSum

tii = 100 * positiveSum / (positiveSum + negativeSum)

tiiLong = crossover(tii, 80)
tiiXLong = crossunder(tii,80)

//
// LOGIC
//
enterLong = (use == "TDI" and tdiLong) or (use == "TCF" and tcfLong) or (use == "TTF" and ttfLong) or (use == "TII" and tiiLong)
exitLong = (use == "TDI" and tdiXLong) or (use == "TCF" and tcfXLong) or (use == "TTF" and ttfXLong) or (use == "TII" and tiiXLong)


// Time range for Back Testing
btStartYear  = input(title="Back Testing Start Year",  type=input.integer, defval=2016)
btStartMonth = input(title="Back Testing Start Month", type=input.integer, defval=1)
btStartDay   = input(title="Back Testing Start Day",   type=input.integer, defval=1)
startTime = timestamp(btStartYear, btStartMonth, btStartDay, 0, 0)

btStopYear  = input(title="Back Testing Stop Year",  type=input.integer, defval=2028)
btStopMonth = input(title="Back Testing Stop Month", type=input.integer, defval=12)
btStopDay   = input(title="Back Testing Stop Day",   type=input.integer, defval=31)
stopTime  = timestamp(btStopYear, btStopMonth, btStopDay, 0, 0)

window() => time >= startTime and time <= stopTime ? true : false


riskPerc     = input(title="Max Position  %", type=input.float, defval=20, step=0.5)
maxLossPerc  = input(title="Max Loss Risk %", type=input.float, defval=5, step=0.25)

// Average True Range (ATR) measures market volatility.
// We use it for calculating position sizes.
atrLen   = input(title="ATR Length", type=input.integer, defval=14)
stopOffset = input(title="Stop Offset", type=input.float, defval=1.5, step=0.25)
limitOffset = input(title="Limit Offset", type=input.float, defval=1.0, step=0.25)
atrValue = atr(atrLen)


// Calculate position size
maxPos = floor((strategy.equity * (riskPerc/100)) / src)
// The position sizing algorithm is based on two parts:
// a certain percentage of the strategy's equity and
// the ATR in currency value.
riskEquity  = (riskPerc / 100) * strategy.equity
// Translate the ATR into the instrument's currency value.
atrCurrency = (atrValue * syminfo.pointvalue)
posSize0    = min(floor(riskEquity / atrCurrency), maxPos)
posSize     = posSize0 < 1 ? 1 : posSize0

if (window())
    strategy.entry("Long", long=true, qty=posSize0, when=enterLong)
    strategy.close_all(when=exitLong)
もっと
- RSI+CCI+ボリンジャーバンド DCA戦略
- フィボナッチリトレースメント量的な取引戦略
- 2つの指標による振動戦略
- 2重移動平均価格突破戦略
- ダイナミックストップ・ロスト・トレイル戦略
- 調整された移動平均値と累積的な高低指数の組み合わせ戦略
- 双 EMA ウィリアムズ インディケーター トレンド トラッキング 戦略
- 双 EMA ゴールデンクロス トレンド トラッキング 戦略
- モメント・ブレークスルーTM戦略
- ダイナミック・レンジ・ブレークアウト戦略
- 中国生肖暦に基づくビットコイン取引戦略
- 逆 フィッシャー RSI 移動平均 多時間枠戦略
- 日々の閉じる価格比較に基づく定量的な取引戦略
- 二重移動平均値ジャンプ戦略
- コナーズ ダブル移動平均RSI逆転取引戦略
- スーパーグッピー 移動平均取引戦略
- 月射撃 双角三角突破戦略
- フィボナッチ帯振動戦略
- 定量的なジグザック戦略
- クロス移動平均戦略