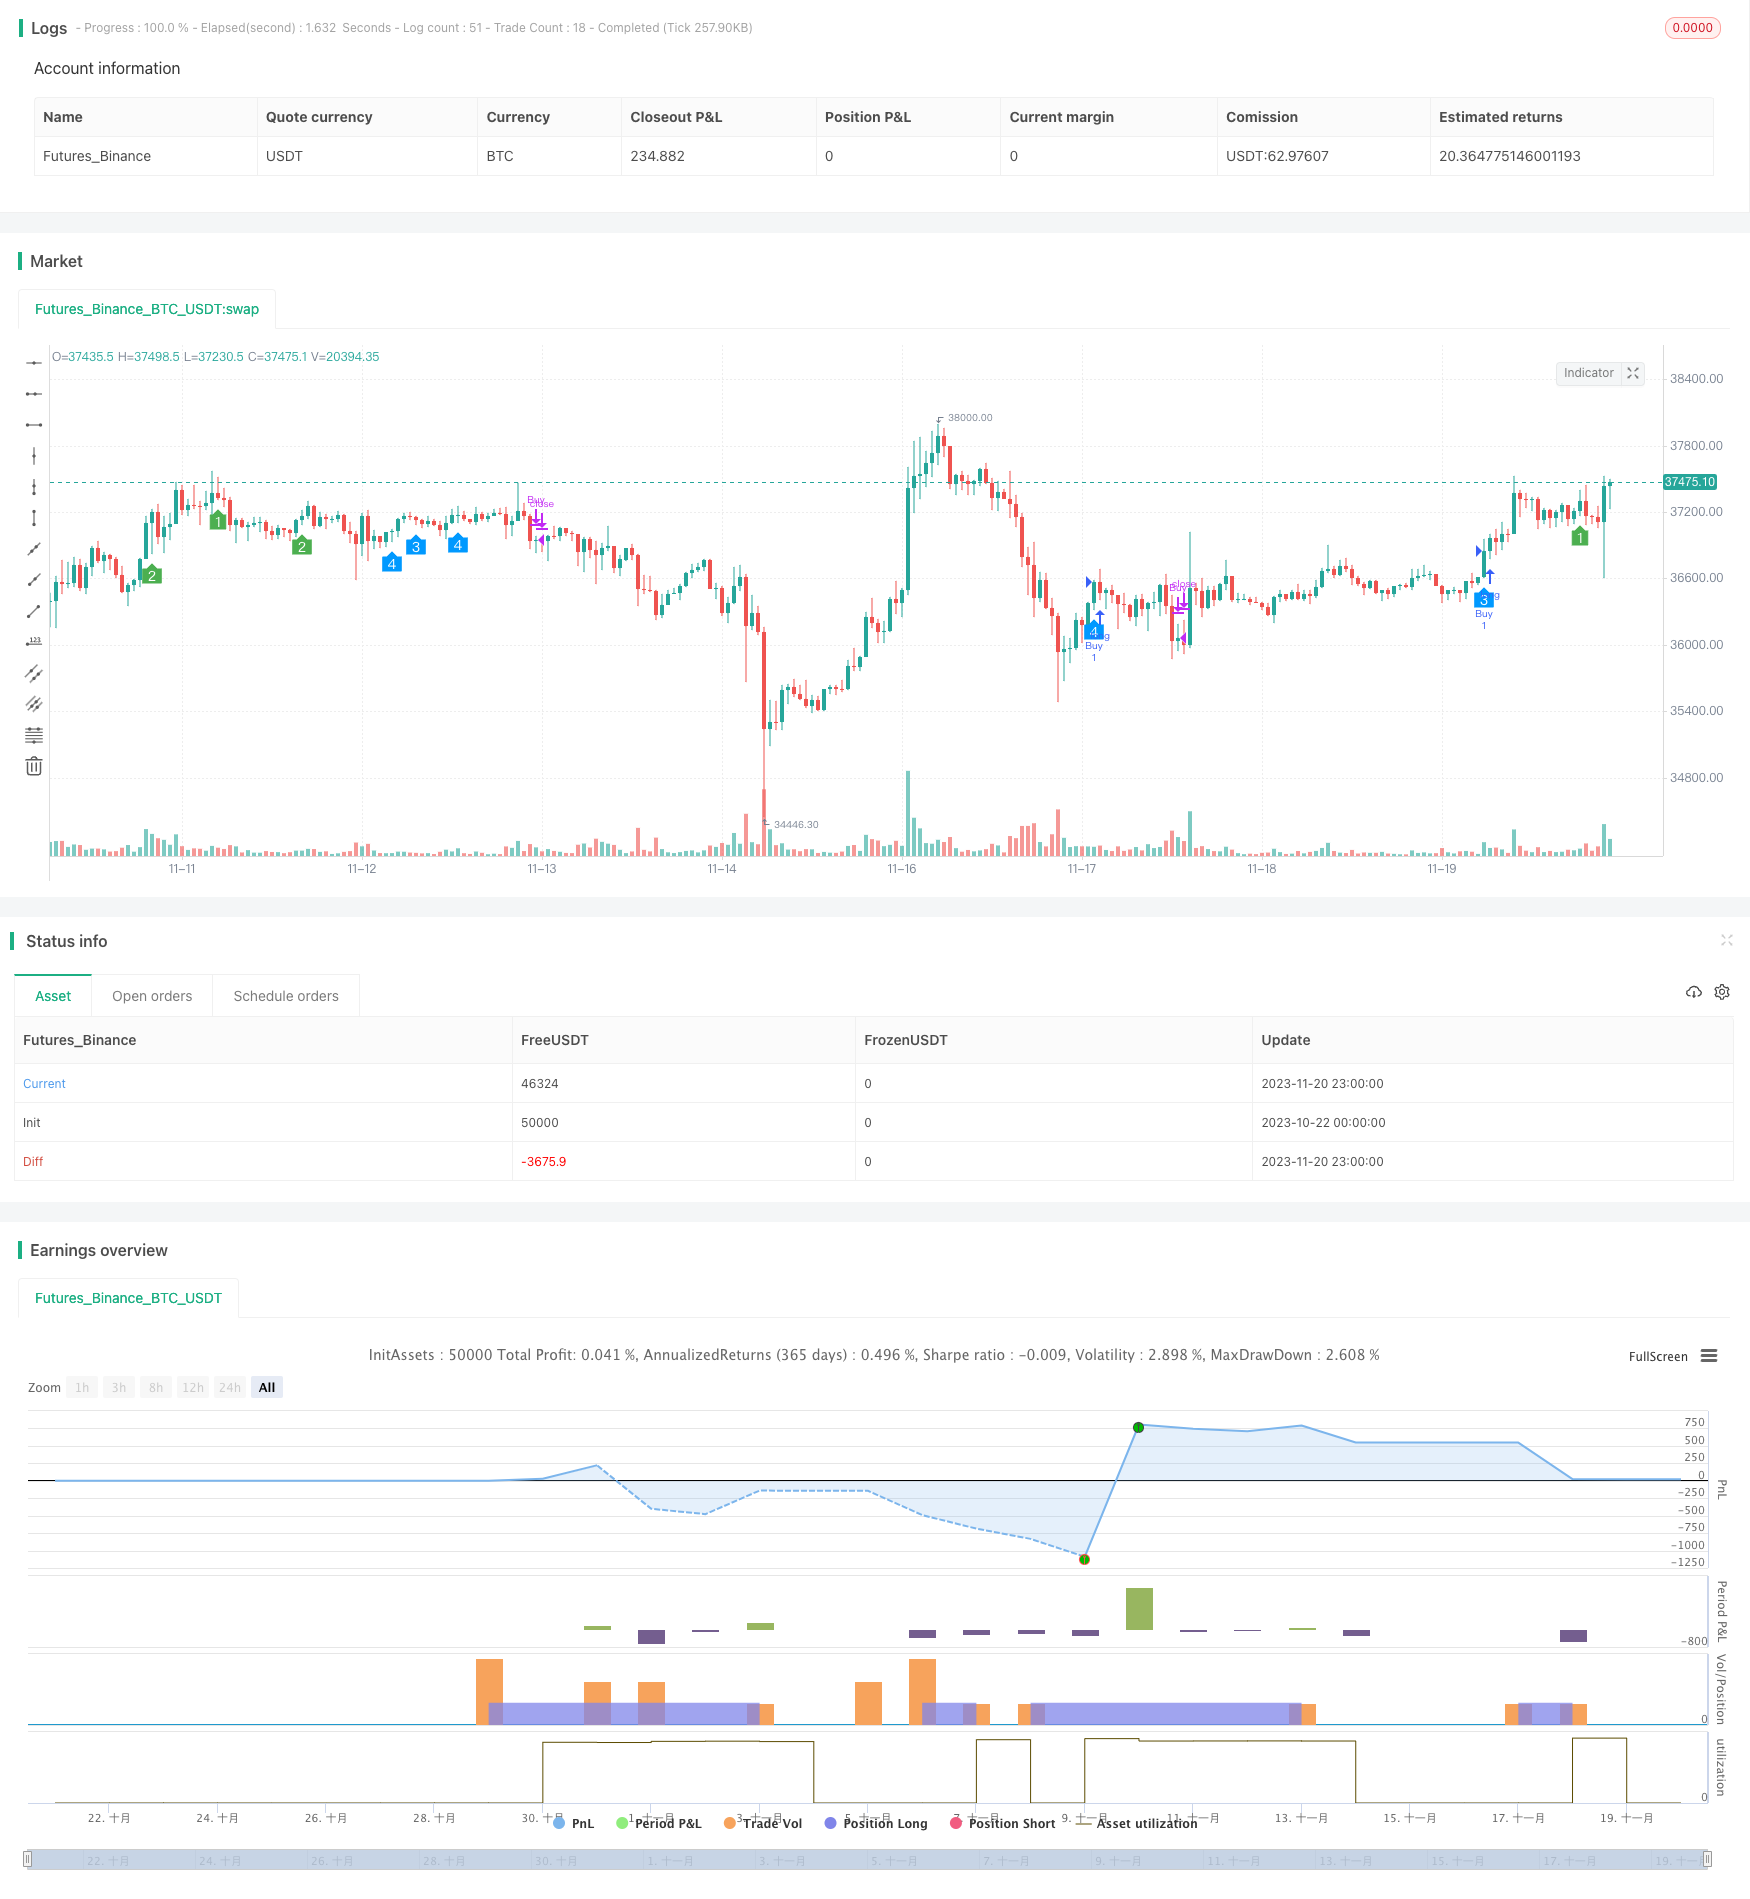
2つの移動平均のクロスオーバートレンド戦略
作者: リン・ハーンチャオチャン,日付: 2023年11月22日 17:29:04タグ:

概要
ダブル・ムービング・アベア・クロスオーバー・トレンド・ストラテジー (Dual Moving Average Crossover Trend Strategy) は,高速・遅い移動平均線が交差するときに買い・売る信号を生成するトレンドフォロー戦略である.トレンド方向を決定するためにMACDやRSIなどの複数の指標を組み込み,強力なトレンド追跡能力を備えている.
戦略の論理
戦略は主に以下の指標を用いて判断する.
-
速くて遅い移動平均線: 購入信号の黄金十字,販売信号の死亡十字.
-
MACD:シグナルライン上のMACD線と上昇するMACDが上昇信号の最低です.
-
RSI:RSIは上昇指数で50以上,下落指数で50以下.
-
Awesome Oscillator (AO): AO は 0 線以上を買い,下を売り.
-
3日間移動平均: 短い期間の日間MAが,より長い期間の日間MAを買い信号として越えてくる.
この戦略は,複数のタイムフレームとインジケーターを組み合わせて,購入と販売ロジックを生成する.複数のインジケーターが同時に上昇信号を示すとき,購入オーダーを作成し,下落信号が現れるときに販売オーダーを作成し,トレンドを追跡する.
利点分析
この戦略には以下の利点があります.
-
複数のインディケーターコンボで 誤った信号を減らして 精度を向上させる
-
複数のタイムフレームを組み込むことで,より大きなトレンド方向性を特定できます.
-
パラメータ調整により 利潤が上がります
-
リスクを制御し損失を制限するために移動ストップ損失を採用します.
-
手動による介入なしで自動的なトレンド追跡でコストを削減します
リスク分析
リスクもあります
-
範囲限定の市場では,より多くのウィプソーが発生する可能性があります. 誤った信号を減らすためにパラメータを最適化します.
-
ブラック・スワン・イベントは急激な減少を 引き起こすかもしれない
-
複雑な買い/売る論理は,最適なパラメータを見つけるために,大きな歴史的データに依存します.
-
適切なストップ・ロスの設定が不適切で 早期出口につながります
オプティマイゼーションの方向性
戦略は以下の側面から改善できます.
-
安定した,正確なシグナル,例えば波動性指数,OBVなど,より多くの指標組み合わせをテストします.
-
マシン学習と遺伝子アルゴリズムで指標のパラメータを最適化して 過剰取引を減らす
-
複数の独立した戦略モデルからの信号を統合するためのモデルアンサンブル技術導入,信頼性を向上させる.
-
取引をより長い時間枠で開始し,より短い時間枠で終了します. 引き上げリスクを減らす.
-
貿易停止損失パーセント,最大引き下げなどに厳格な制限を伴う定量リスク制御モジュールを構築する.
概要
ダブル・ムービング・平均クロスオーバートレンド戦略は,自動的なトレンド追跡のためのトレンド方向を判断するために,MACD,RSIとともに,高速および遅いMAクロスを取引信号として使用する. より多くの指標,パラメータチューニング,モデルエンセットなどを組み込むことで,戦略の有効性を高めるために,重要な最適化スペースがあります.
/*backtest
start: 2023-10-22 00:00:00
end: 2023-11-21 00:00:00
period: 1h
basePeriod: 15m
exchanges: [{"eid":"Futures_Binance","currency":"BTC_USDT"}]
*/

//@version=5
strategy('SteffVans', shorttitle='SteffVans strategy', overlay=true, process_orders_on_close = true)

// Input settings
macd_fast_length = input(12)
macd_slow_length = input(26)
macd_signal_length = input(9)

// Calculate MACD values
[macd_line, signal_line, _] = ta.macd(close, macd_fast_length, macd_slow_length, macd_signal_length)
mg = ta.lowest(signal_line, 30) >= -0

// RSI
ma(source, length, type) =>
    switch type
        "SMA" => ta.sma(source, length)
        "Bollinger Bands" => ta.sma(source, length)
        "EMA" => ta.ema(source, length)
        "SMMA (RMA)" => ta.rma(source, length)
        "WMA" => ta.wma(source, length)
        "VWMA" => ta.vwma(source, length)

rsiLengthInput = input.int(14, minval=1)
rsiSourceInput = input.source(close, "Source", group="RSI Settings")
maTypeInput = input.string("SMA", title="MA Type", options=["SMA", "Bollinger Bands", "EMA", "SMMA (RMA)", "WMA", "VWMA"], group="MA Settings")
maLengthInput = input.int(14, title="MA Length", group="MA Settings")
bbMultInput = input.float(2.0, minval=0.001, maxval=50, title="BB StdDev", group="MA Settings")

up = ta.rma(math.max(ta.change(rsiSourceInput), 0), rsiLengthInput)
down = ta.rma(-math.min(ta.change(rsiSourceInput), 0), rsiLengthInput)
RSI = down == 0 ? 100 : up == 0 ? 0 : 100 - (100 / (1 + up / down))


//  AO
AO = ta.sma((high + low) / 2, 5) - ta.sma((high + low) / 2, 34)
crossaosell = AO < AO[1] and AO[1] < AO[2] and AO[2] > AO[3]  and ta.lowest(low,3)

// Uptrend sma
len1 = input.int(5, minval=1)
len2 = input.int(10, minval=1)
len3 = input.int(20, minval=1)
src = input(close)

out1 = ta.sma(src, len1)
out2 = ta.sma(src, len2)
out3 = ta.sma(src, len3)


// Timeframe
macdl60 = request.security(syminfo.tickerid, "60", signal_line,lookahead = barmerge.lookahead_on)
ao = request.security(syminfo.tickerid, "60", AO,lookahead = barmerge.lookahead_on)
rsi = request.security(syminfo.tickerid, "60", RSI,lookahead = barmerge.lookahead_on)
good = request.security(syminfo.tickerid, "60", mg,lookahead = barmerge.lookahead_on)
bad = request.security(syminfo.tickerid, "60", crossaosell,lookahead = barmerge.lookahead_on)

ma1 = request.security(syminfo.tickerid, "D", out1,lookahead = barmerge.lookahead_on)
ma2 = request.security(syminfo.tickerid, "D", out2, lookahead = barmerge.lookahead_on)
ma3 = request.security(syminfo.tickerid, "D", out3, lookahead = barmerge.lookahead_on)


// Kriteria BUY and SELL
uptrend1 =  request.security(syminfo.tickerid, "D", close,lookahead = barmerge.lookahead_on) > ma1 and ma1 > ma3 and ma2 > ma3
uptrend2 = ta.lowest(ma1,12) > ta.lowest(ma3,12) and ta.lowest(ma2,12) > ta.lowest(ma3,12)


// Triger BUY and SELL
cross1 = ao > ao[1] and ao[1] < ao[2] and ao > 0 and good and rsi >= 60 and uptrend1
cross2 = ao > 0 and ao[1] < 0 and good and rsi >=50 and uptrend1
cross3 =  ao > 0 and ao[1] < 0 and not good and uptrend2 and uptrend1
cross4 =  ao > ao[1] and ao[1] > ao[2] and ao[2] < ao[3] and ao[3] < ao[4]  and not good and uptrend2 and uptrend1

s1 = ao < ao[1] and ao[1] < ao[2] and ao[2] < ao[3] and ao > 0 and rsi < 50 and request.security(syminfo.tickerid, "D", close,lookahead = barmerge.lookahead_on) < ma1
s2 =  ao < 0 and ao < ao[2] and rsi < 50 and request.security(syminfo.tickerid, "D", close,lookahead = barmerge.lookahead_on) < ma1

// Variabel Buy dan Sell
buySignal = false
sellSignal = false

// Syarat masuk Buy
buyCondition =  cross1 or cross2 or cross3 or cross4
if buyCondition
    buySignal := true

// Syarat masuk Sell
sellCondition = s1 or s2
if sellCondition
    sellSignal := true

// Reset sinyal jika ada sinyal berulang
if buySignal and sellSignal
    sellSignal := false
if sellSignal and buySignal
    buySignal := false

// Logika perdagangan
if buySignal
    strategy.entry("Buy", strategy.long, comment = "BUY")
if sellSignal
    strategy.close("Buy")


plotshape(cross1,title = "Stefkuy1", style = shape.labelup, location = location.belowbar, color = color.green,text = "1", textcolor = color.white,size = size.small)
plotshape(cross2,title = "Stefkuy2", style = shape.labelup, location = location.belowbar, color = color.green, text = "2", textcolor= color.white, size = size.small)
plotshape(cross3,title = "StefVan1", style = shape.labelup, location = location.belowbar, color = color.rgb(0, 153, 255), text = "3", textcolor= color.white,size = size.small)
plotshape(cross4,title = "StefVan2", style = shape.labelup, location = location.belowbar, color = color.rgb(0, 153, 255), text = "4", textcolor= color.white,size = size.small)
- 低高トレンド戦略
- 雲が飛ぶ高収益度 日々の取引戦略
- Bollinger トレンドショックの取引戦略
- ダイナミック・プライス・スウィング・オシレーター戦略
- 変化の二重率・勢い指標 トレーディング戦略
- ダイナミックボックス % トラッキング 戦略
- SSLチャネルバックテスト戦略とATRとマネーマネジメント
- ボリンジャー・バンド逆転に基づく定量戦略
- 双重逆転追跡戦略
- 現代のラガー変換相対強度指数最適化戦略
- ボリンジャー・バンド・トレンド・チェイサー
- 移動平均のクロスオーバー戦略
- カイロウ戦略
- ストカスティックとCCIに基づく戦略をフォローする傾向
- DPD-RSI-BB 定量戦略
- 2つの移動平均のクロスオーバー戦略
- リバース・オープニング・エングロフィング・戦略
- 複数の技術指標 モメントブレイクストラテジー
- トレンドをフォローする戦略
- 底辺 を 捉える 戦略