资源加载中... loading...

Bollinger Trend Shock Trading Strategy

Author: ChaoZhang, Date: 2023-11-23 10:48:58
Tags:

img

Overview

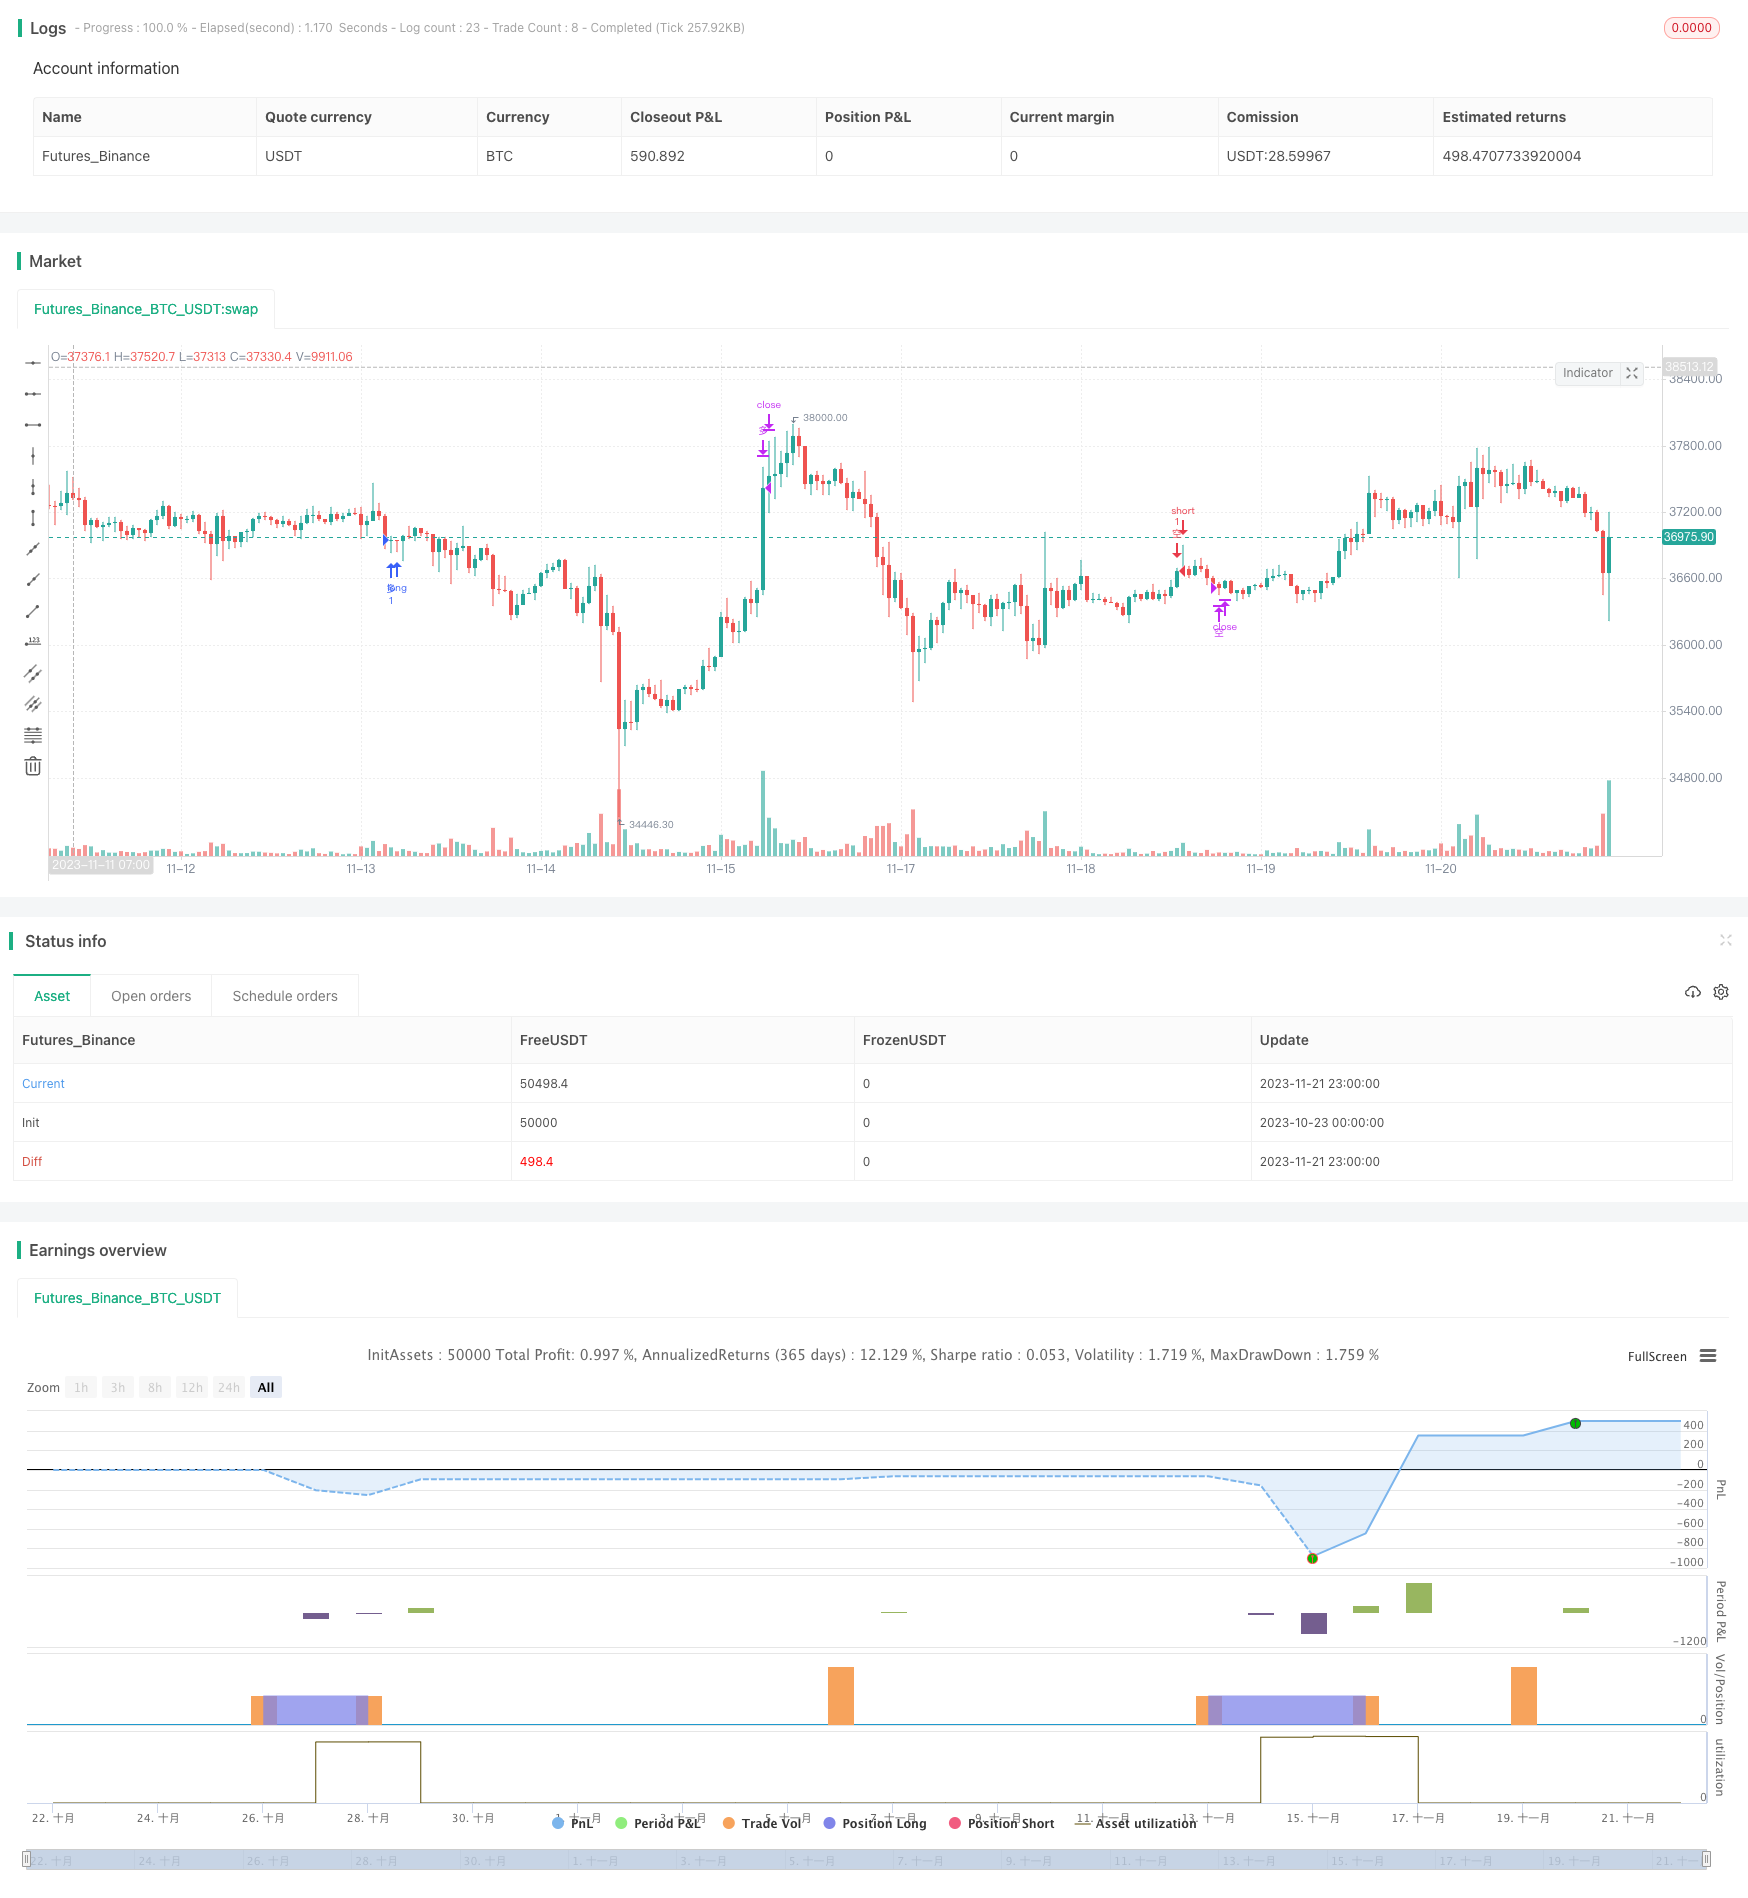
This strategy uses the Bollinger Bands indicator to determine market trend direction, and takes counter-trend trades when trend reversal occurs. It goes long when price breaks below the lower band in an uptrend; and goes short when price breaks above the upper band in a downtrend. Also, a moving average is used as the benchmark for long-term trend to make the strategy more stable.

Strategy Principle

This strategy utilizes the middle band, upper band and lower band of Bollinger Bands to determine market trend direction. The middle band is the n-period exponential moving average, while the upper band and lower band are middle band +2.3 standard deviation and middle band -2.3 standard deviation respectively. When price breaks below the lower band, it indicates a current uptrend. When price breaks above the upper band, it indicates a current downtrend.

In addition, the strategy sets a 200-period simple moving average (sma) as the benchmark for long-term trend judgement. Trading signals are only triggered when BB and sma indicators agree on the same direction. This can effectively filter out some false breakouts.

The specific trading logic is as follows:

  1. Determine uptrend: BB upper band > sma, middle band > sma, lower band >= sma
  2. Determine downtrend: BB upper band < sma, middle band < sma, lower band <= sma
  3. Long condition: Uptrend + Price breaks BB lower band
  4. Exit condition: Price breaks BB upper band
  5. Short condition: Downtrend + Price breaks BB upper band
  6. Exit condition: Price breaks below BB middle band or rebounds back above the 230-period MA

Advantage Analysis

  1. BB judges trend direction effectively and captures breakout trading opportunities
  2. Adding long-term MA filter reduces risks associated with false breakouts
  3. Clear long and short logic, easy to understand and follow
  4. Strict criteria for short exit helps limit losses

Risk Analysis

  1. Potential large slippage when BB and MA issue trading signals
  2. Overly strict short conditions lead to limited short side profit
  3. Improper parameter tuning can result in too high/low trading frequency
  4. Breakout strategies prone to huge losses

Improvements:

  1. Optimize BB parameters to reduce trading frequency
  2. Set stop loss to avoid huge losses per trade
  3. Add volume filter to ensure breakout validity

Summary

Overall this is a simple and easy to understand strategy, using BB to determine trends and taking counter-trend trades at turning points. Adding short-term and benchmark indicators also helps filter signals. Still large room for optimizations, like parameter tuning, volume indicators etc. can further improve it.


/*backtest
start: 2023-10-23 00:00:00
end: 2023-11-22 00:00:00
period: 1h
basePeriod: 15m
exchanges: [{"eid":"Futures_Binance","currency":"BTC_USDT"}]
*/

// This source code is subject to the terms of the Mozilla Public License 2.0 at https://mozilla.org/MPL/2.0/
// © Aayonga

//@version=5
strategy("布林趋势震荡单", overlay=true,initial_capital=10000,default_qty_type=strategy.fixed, default_qty_value=1 )
bollL=input.int(20,minval=1,title = "长度")
bollmult=input.float(2.3,minval=0,step=0.1,title = "标准差")
basis=ta.ema(close,bollL)
dev=bollmult*ta.stdev(close,bollL)
upper=basis+dev
lower=basis-dev
smaL=input.int(200,minval=1,step=1,title = "趋势分界线")
sma=ta.sma(close,smaL)
//多头趋势
longT=upper>sma and basis>sma and lower>=sma
//空头趋势
shortT=upper<sma and basis<sma and lower<=sma

//入场位
longE=ta.crossover(close,lower)
shortE=ta.crossover(close,upper)
//出场位

longEXIT=ta.crossover(high,upper) 
shortEXIT=ta.crossunder(close,basis) or ta.crossover(close,ta.sma(close,230)) 

if longT and longE
    strategy.entry("多",strategy.long)

if longEXIT
    strategy.close("多",comment = "多出场")

if shortE and shortT
    strategy.entry("空",strategy.short)

if shortEXIT
    strategy.close("空",comment = "空出场")

More