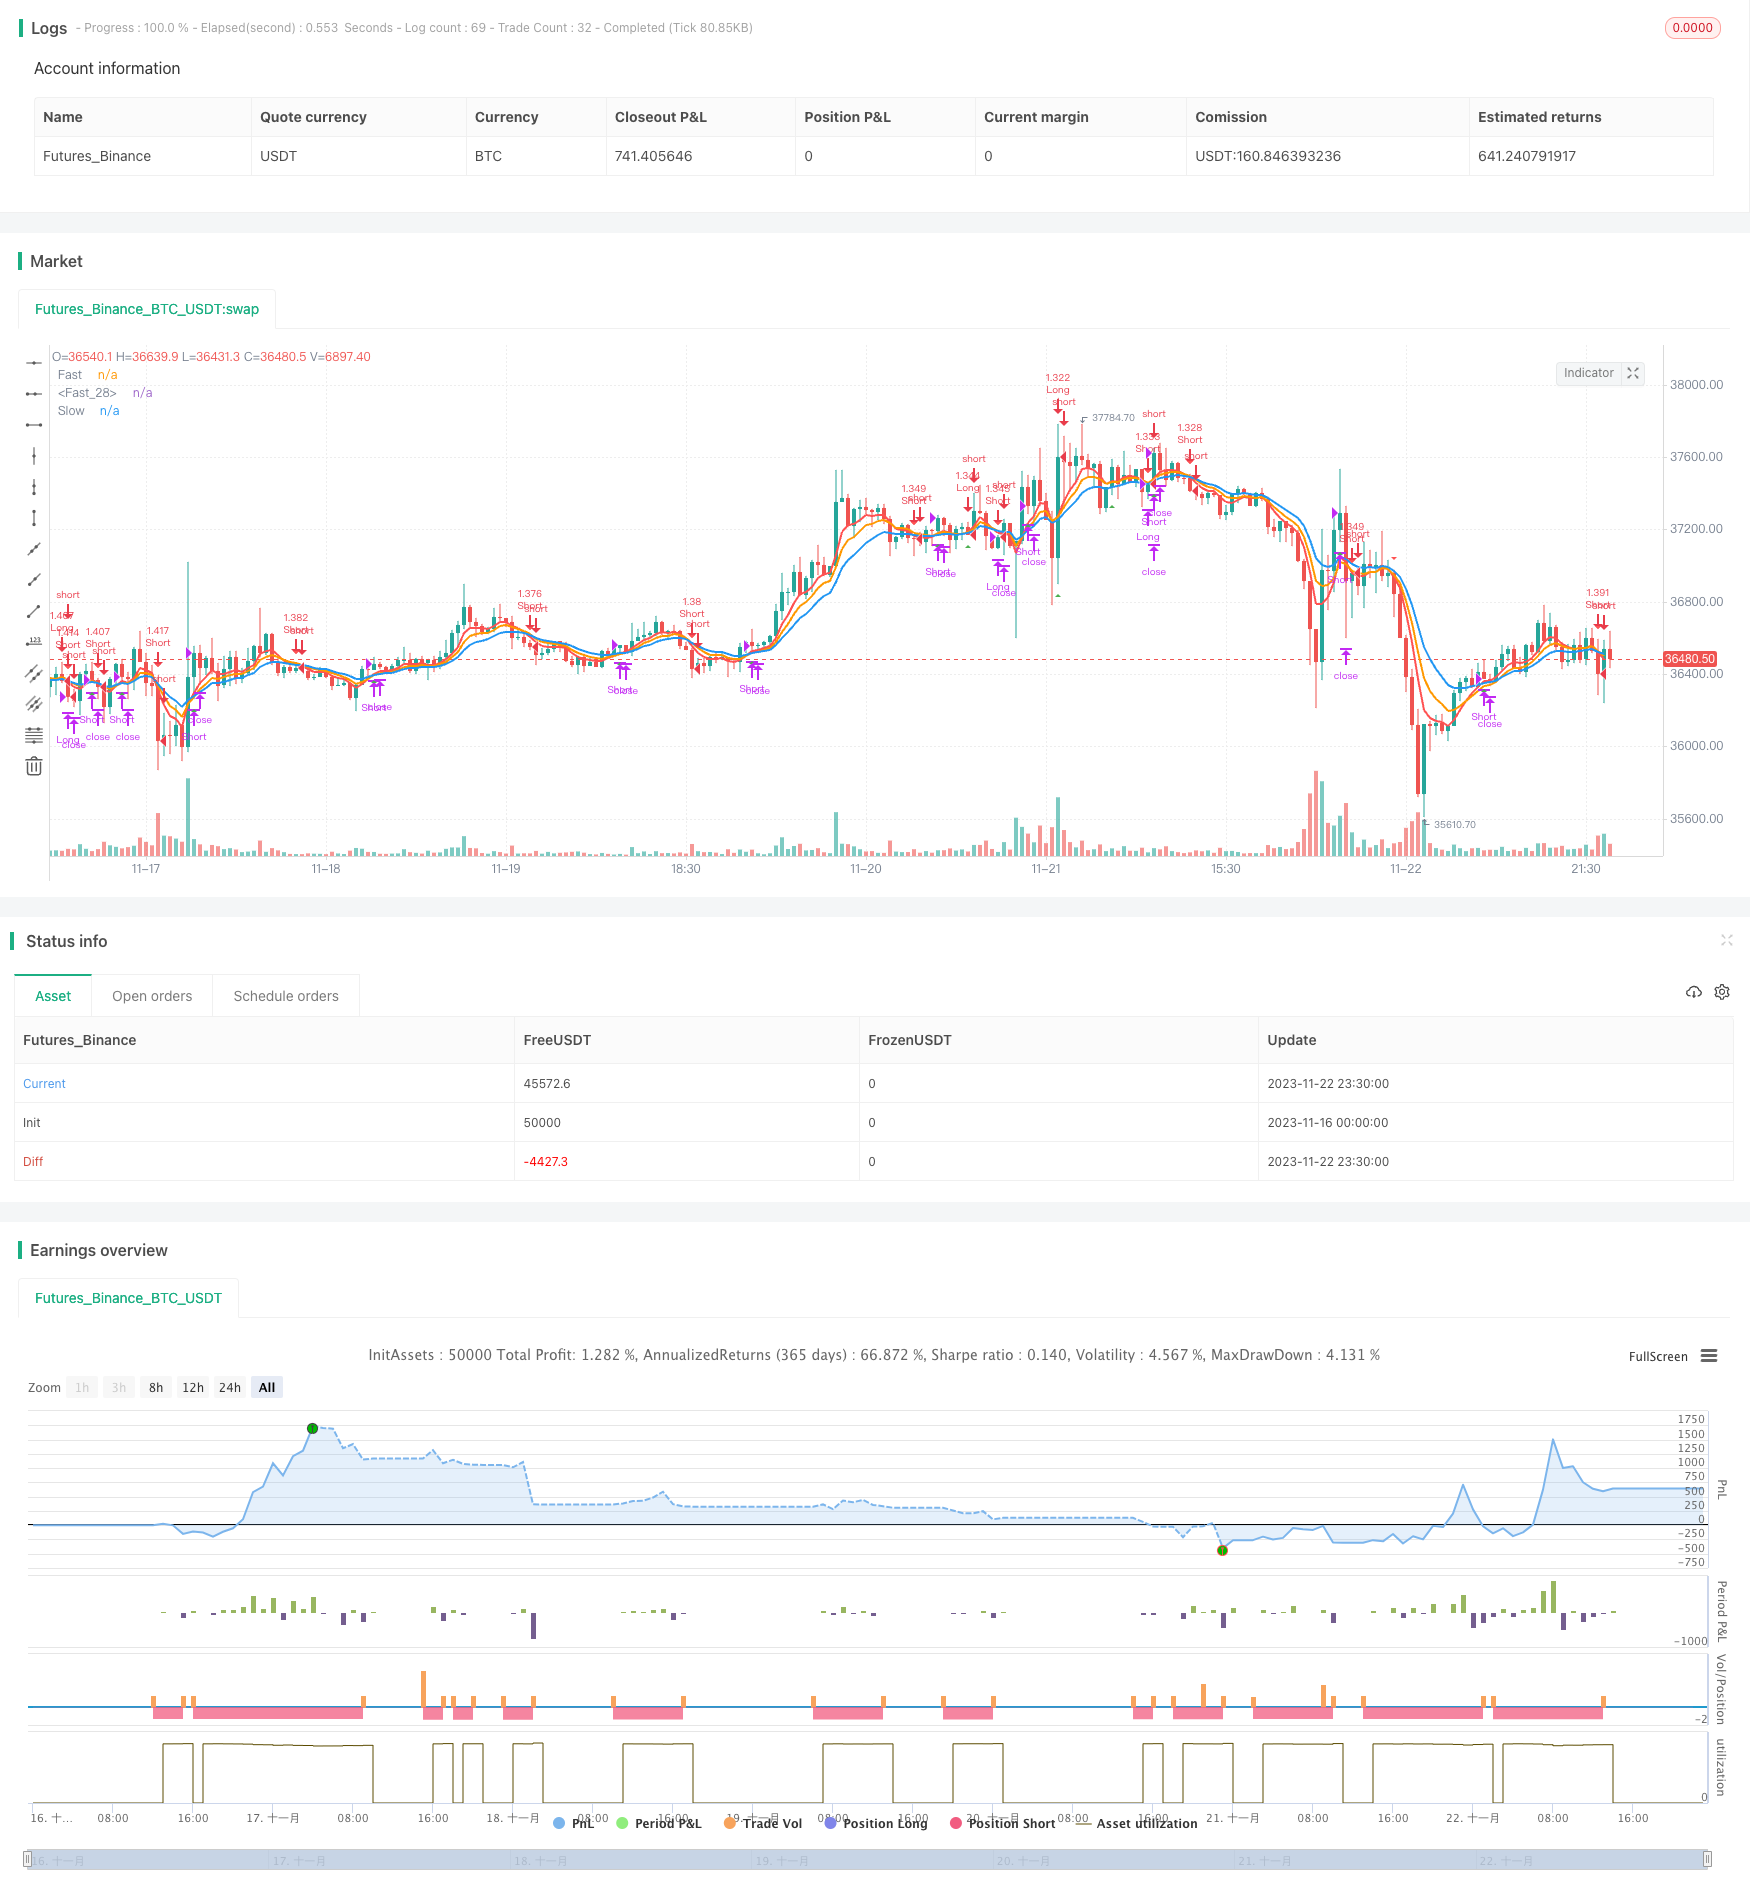
短期・中期・長期のEMAクロスオーバー取引戦略
作者: リン・ハーンチャオチャン, 日付: 2023-11-24 13:33:21タグ:

この戦略は,異なる期間の3つの指数関数移動平均線 (EMA) に基づいて取引信号を生成する. 5日間の短期EMA, 8日間の中期EMA, 13日間の長期EMA. 短期EMAが中期と長期EMAを横切ったとき,長期EMAが中期と長期EMAを横切ったとき,短くなります.
戦略の論理
この戦略は,異なる期間のEMAを計算することによって市場傾向を判断する.短期EMAは,過去数日の平均価格を反映し,中期および長期EMAは,より長い時間枠における平均価格を反映する.中期および長期EMAに対する短期EMAのクロスオーバーは,価格の上昇突破を示し,ロングポジションをとる.逆に,短期EMAが他の2つを下に突破すると,下値突破を示し,ショートポジションをとる.
この戦略は, 5 日, 8 日, 13 日間の EMA を同時に計算する. 5 日間の EMA が 8 日間の EMA と 13 日間の EMA を横切ったとき,長信号を生成し, 5 日間の EMA が他の 2 日間の EMA を横切ったとき,短信号を生成する. 5 日間の EMA が 13 日間の EMA を横切ったとき,ロングに行く後,ポジションは閉じる.ショートポジションも同じです.
戦略 の 利点
- 多期EMAを使用すると,過短または過長な単一のEMA期間で発生する主要なトレンド逆転ポイントを欠けていることが回避されます.
- 短期,中期,長期の3つのEMAを組み合わせることで,取引信号の信頼性が向上します.
- EMA を 通す 価格 調整 は 市場 の 騒音 を 微調整 し,不要 な 入場 を 防止 する
戦略 の リスク
- 3つのEMAは,実質的な価格ブレイク前のいくつかの時間遅れを含んでいる遅延傾向指標であり,遅い信号のリスクがあります.
- EMA は,実際の傾向と短期的訂正を効果的に区別できず,誤った信号を出す傾向があります.
- 固定EMA期間は,異なる時間枠で異なる市場体制に適応できない.
改善のアイデア:
- MACD のような他の指標を追加して,誤った信号を避けるため,実際のトレンドをよりよく測定する
- 異なる製品と市場環境に対するEMA期間パラメータの柔軟な調整
- 移動ストップ損失を追加して利益を固定し,リスクを制御する
概要
これは,短期,中期,長期期間のEMA間のクロスオーバーを比較することによってトレンド逆転を判断する典型的なブレークアウトシステムである.そのシグナリングのシンプルさは取引の容易さを容易にするが,EMAsに固有の遅れと一時的な訂正から実際のトレンドをフィルタリングする能力が欠けている.将来の改良は,他の技術指標または適応パラメータ調整を統合して最適化することができる.
/*backtest
start: 2023-11-16 00:00:00
end: 2023-11-23 00:00:00
period: 30m
basePeriod: 15m
exchanges: [{"eid":"Futures_Binance","currency":"BTC_USDT"}]
*/

//@version=4
//
// This source code is subject to the terms of the Mozilla Public License 2.0 at https://mozilla.org/MPL/2.0/
// © gregoirejohnb
// @It is modified by ttsaadet.
// Moving average crossover systems measure drift in the market. They are great strategies for time-limited people.
// So, why don't more people use them?
//

//
strategy(title="EMA Crossover Strategy", shorttitle="EMA-5-8-13 COS by TTS", overlay=true, pyramiding=0, default_qty_type=strategy.percent_of_equity, default_qty_value=100, currency=currency.TRY,commission_type=strategy.commission.percent,commission_value=0.04, process_orders_on_close = true, initial_capital = 100000)

// === GENERAL INPUTS ===
//strategy start date
start_year = input(defval=2020, title="Backtest Start Year")

// === LOGIC ===
short_period = input(type=input.integer,defval=5,minval=1,title="Length")
mid_period = input(type=input.integer,defval=8,minval=1,title="Length")
long_period = input(type=input.integer,defval=13,minval=1,title="Length")

longOnly = input(type=input.bool,defval=false,title="Long Only")
shortEma = ema(hl2,short_period)
midEma = ema(hl2,mid_period)
longEma = ema(hl2,long_period)

plot(shortEma,linewidth=2,color=color.red,title="Fast")
plot(midEma,linewidth=2,color=color.orange,title="Fast")
plot(longEma,linewidth=2,color=color.blue,title="Slow")

longEntry = ((shortEma > midEma) and crossover(shortEma,longEma)) or ((shortEma > longEma) and crossover(shortEma,midEma))
shortEntry =((shortEma < midEma) and crossunder(shortEma,longEma)) or ((shortEma < longEma) and crossunder(shortEma,midEma))

plotshape(longEntry ? close : na,style=shape.triangleup,color=color.green,location=location.belowbar,size=size.small,title="Long Triangle")
plotshape(shortEntry and not longOnly ? close : na,style=shape.triangledown,color=color.red,location=location.abovebar,size=size.small,title="Short Triangle")
plotshape(shortEntry and longOnly ? close : na,style=shape.xcross,color=color.black,location=location.abovebar,size=size.small,title="Exit Sign")

// === STRATEGY - LONG POSITION EXECUTION ===
enterLong() =>
    longEntry
exitLong() =>
    crossunder(shortEma,longEma)

strategy.entry(id="Long", long=strategy.long, when=enterLong())
strategy.close(id="Long", when=exitLong())


// === STRATEGY - SHORT POSITION EXECUTION ===

enterShort() =>
    not longOnly and shortEntry
exitShort() =>
    crossover(shortEma,longEma)

strategy.entry(id="Short", long=strategy.short, when=enterShort())
strategy.close(id="Short", when=exitShort())
もっと
- 固い移動平均システム戦略
- 先進的なボリンジャー帯移動平均グリッドトレンド追跡戦略
- イチモク・キンコ・ヒョー指標 バランストレンド戦略
- ボリューム価格指標 バランスのとれた取引戦略
- 歪んだ SMA 適応型クロスオーバー ロングライン戦略
- 2つの移動平均の仲裁戦略
- 月間購入日に基づく定量投資戦略
- 標準偏差を考慮した取引戦略
- トリプル・ムービング・平均量的な取引戦略
- EMAのクロスオーバー戦略
- 時系列分解とボリンジャーバンドの量重量化に基づく戦略をフォローする傾向
- 価格オシレーター数値取引戦略
- 多指標の傾向 戦略をフォローする
- CCIの二重タイムフレームトレンド 戦略をフォローする
- T3-CCI トレンドトラッキング戦略
- クロスタイムフレーム スーパートレンド ブレイクストラテジー
- モメント逆転移動平均組み合わせ戦略
- ダイナミック・ムービング・アベア・リトレースメント マーティン戦略
- コンボ・モメント・リバース・ダブル・レールマッチング戦略
- イチモク・クラウド・量子戦略